Overview
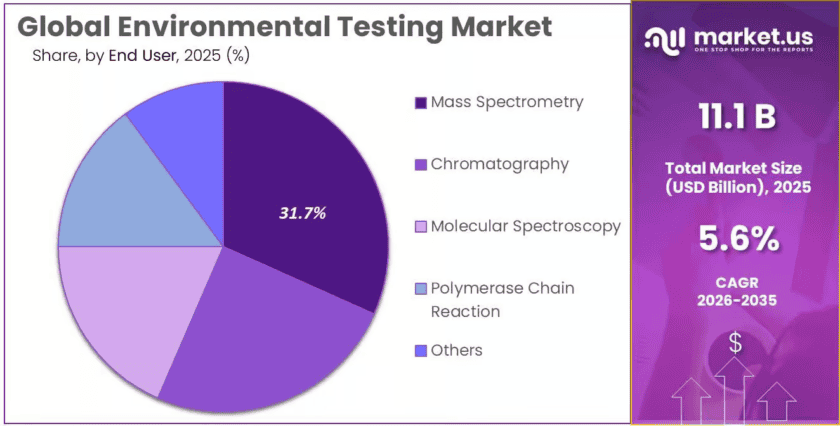
New York, NY – Oct 01, 2026 – The global Environmental Testing Market is expanding as governments, utilities, industrial facilities, laboratories, and environmental agencies increase monitoring of water, wastewater, air, soil, hazardous substances, and emerging contaminants. The market was valued at USD 11.1 billion in 2025 and is projected to reach approximately USD 19.2 billion by 2035, growing at a 5.6% CAGR from 2026 to 2035.
Environmental testing helps organizations identify chemicals, microorganisms, heavy metals, PFAS, pesticides, nutrients, and other pollutants before they create larger environmental or public-health problems. Regulatory monitoring remains a major demand source. EPA’s UCMR 5 program required drinking-water testing for 29 PFAS compounds and lithium between 2023 and 2025, with the final dataset released in August 2026.
The testing requirement is also expanding across soil and surface-water management. The European Commission reports that 60–70% of EU soils are currently unhealthy, with degradation costing more than €50 billion each year.
Europe monitored more than 22,000 bathing-water sites in 2025, with 85% meeting the highest “excellent” classification, showing the scale of continuous environmental sampling needed to protect public health.
Key Takeaways
- The Environmental Testing Market was valued at USD 11.1 billion in 2025 and is expected to reach around USD 19.2 billion by 2035, expanding at a 5.6% CAGR.
- Wastewater/Effluent dominated by sample type with more than 30.30% share in 2025.
- Chemical testing held more than 24.80% share, supported by monitoring for PFAS, metals, pesticides, hydrocarbons, nutrients, and other contaminants.
- Rapid Testing accounted for more than 57.20% share, reflecting demand for faster laboratory and field results.
- Mass Spectrometry led rapid-testing methods with more than 31.00% share because of its ability to measure trace contaminants at very low concentrations.
- Government and Regulatory Agencies captured more than 26.67% share, making them the leading end-user group.
- North America dominated the market with more than 34.60% share, generating approximately USD 3.8 billion in 2025.
Regional Analysis
In 2025, North America held a dominant Environmental Testing Market position, capturing more than 34.60% share and generating approximately USD 3.8 billion. Strong environmental regulations, extensive laboratory infrastructure, industrial compliance requirements, PFAS monitoring, wastewater testing, and public water-quality programs continue to support regional demand.
The United States has a particularly large testing requirement. EPA estimates that drinking-water systems need approximately USD 625 billion in infrastructure investment over 20 years. Around USD 420.8 billion, or 67%, relates to distribution and transmission, while USD 106.4 billion, or 17%, relates to treatment infrastructure.
PFAS monitoring is also increasing laboratory demand. EPA’s UCMR 5 required monitoring for 30 contaminants, including 29 PFAS and lithium, across public water systems between 2023 and 2025.
Air-quality monitoring further broadens the testing base. State, local, and tribal agencies operate more than 4,000 criteria-pollutant monitors at roughly 2,100 sites across the United States, creating continuous demand for sampling, analytical equipment, calibration, quality assurance, and laboratory support.
Market Dynamics
Driver – Stricter Monitoring of Emerging Contaminants
The growing need to identify emerging contaminants is a major driver for environmental testing. EPA’s UCMR 5 required public water systems to monitor 29 PFAS compounds plus lithium between 2023 and 2025, with the final dataset published in August 2026. The program covered all eligible systems serving 3,300 or more people, along with a representative sample of 800 smaller systems. Such programs increase demand for sample collection, certified laboratories, chromatography, mass spectrometry, and data reporting. EPA Method 1633 can also measure 40 PFAS compounds across wastewater, groundwater, soil, sediment, biosolids, landfill leachate, and fish tissue.
Trend – Shift Toward Rapid and High-Sensitivity Testing
Environmental laboratories are moving toward faster, more sensitive analytical technologies. Rapid Testing already accounted for more than 57.20% of the market in 2025, while Mass Spectrometry held more than 31.00% of rapid-testing methods. EPA continues updating approved laboratory procedures as analytical technology improves. In January 2025, the agency approved 2 alternative drinking-water test procedures designed to provide laboratories with additional compliant analytical options. EPA has also proposed Method 1633A for measuring 40 PFAS, Method 1621 for adsorbable organic fluorine, and Method 1628 covering all 209 PCB congeners, showing the move toward broader and more precise contaminant detection.
Restraint – High Laboratory and Compliance Costs
Environmental testing often requires expensive instruments, trained analysts, sample preparation, laboratory certification, quality-control procedures, and regular equipment calibration. Advanced methods such as LC-MS/MS can detect contaminants at extremely low levels but require significant laboratory investment. Smaller utilities and industrial facilities can therefore face financial and technical barriers. The scale of water infrastructure needs demonstrates this pressure: EPA estimates U.S. drinking-water systems require around USD 625 billion over 20 years, a 32% increase compared with the previous infrastructure assessment. Laboratories must also manage multiple regulatory methods and sample matrices, increasing operating complexity and potentially slowing testing where qualified staff, instrumentation, or certified laboratory capacity are limited.
Opportunity – Expansion of Water, Soil and PFAS Monitoring
Large environmental monitoring programs create strong opportunities for laboratories and analytical-equipment providers. The European Commission reports that 60–70% of EU soils are unhealthy and soil degradation costs more than €50 billion annually. The EU’s Soil Monitoring Law entered into force on 16 December 2025, strengthening the long-term need for standardized soil assessment and contamination data. In the United States, EPA’s nationwide PFAS monitoring covers 29 PFAS substances plus lithium, while Method 1633 measures 40 PFAS compounds across multiple environmental media. These programs create opportunities in laboratory services, sampling, sensors, mass spectrometry, data management, and remediation monitoring.
Emerging Trends
1. PFAS Testing Expansion
PFAS testing is moving beyond drinking water into soil, wastewater, biosolids, groundwater, and sediment. EPA Method 1633 supports analysis of 40 PFAS compounds, while UCMR 5 monitored 29 PFAS plus lithium nationwide.
2. Growth of Rapid Analytical Methods
Environmental laboratories are adopting faster methods to shorten result times. EPA approved 2 additional alternative drinking-water methods in January 2025, giving utilities and laboratories more analytical options while maintaining regulatory performance requirements.
3. Wider Soil Monitoring
Soil testing is becoming more important as governments address contamination and degradation. The European Commission estimates 60–70% of EU soils are unhealthy, while degradation costs the region more than €50 billion every year.
4. Continuous Air Monitoring
Environmental testing is increasingly supported by continuous sensor networks. U.S. state, local, and tribal agencies operate more than 4,000 criteria-pollutant monitors across approximately 2,100 ambient-air sites, generating ongoing data for regulatory assessment.
5. Broader Multi-Contaminant Methods
Laboratories are moving toward analytical methods capable of screening many contaminants in one workflow. EPA’s proposed Method 1628 measures all 209 PCB congeners, while Method 1633A can determine 40 individual PFAS compounds.
Use Cases
1. Drinking-Water Testing
Utilities use environmental laboratories to detect PFAS, metals, microorganisms, pesticides, and other contaminants. EPA’s UCMR 5 required testing for 30 contaminants, including 29 PFAS compounds and lithium, between 2023 and 2025.
2. Wastewater and Effluent Compliance
Industrial facilities and municipal treatment plants test effluent before discharge. Wastewater/Effluent represented more than 30.30% of the Environmental Testing Market in 2025, making it the largest sample-type segment.
3. Soil Contamination Assessment
Environmental testing identifies heavy metals, hydrocarbons, PFAS, pesticides, and other pollutants in soil. The EU reports 60–70% of soils are unhealthy, creating greater demand for baseline assessments, remediation testing, and long-term monitoring.
4. Ambient Air Monitoring
Governments use monitoring stations to measure pollutants and verify air-quality standards. More than 4,000 criteria-pollutant monitors operate at roughly 2,100 U.S. sites, supporting continuous environmental and public-health assessment.
5. Recreational Water Monitoring
Authorities test bathing waters for microorganisms that can affect public health. In 2025, the EU assessed around 22,000 bathing-water locations, with 85% rated excellent and 96% meeting minimum quality requirements.
Frequently Asked Questions on Environmental Testing and Environmental Testing Market
What is the Environmental Testing Market size?
The global Environmental Testing Market was valued at approximately USD 11.1 billion in 2025 and is projected to reach around USD 19.2 billion by 2035, expanding at a 5.6% CAGR.
What is environmental testing?
Environmental testing involves collecting and analyzing air, water, wastewater, soil, sediment, waste, and biological samples to identify contaminants and measure environmental quality for regulatory compliance, pollution control, remediation, and public-health protection.
Which sample type dominates the Environmental Testing Market?
Wastewater/Effluent was the leading sample category in 2025, accounting for more than 30.30% market share, supported by industrial discharge monitoring, municipal wastewater regulations, treatment-plant operations, and pollution-control requirements.
Which testing target leads the market?
Chemical testing held the largest position in 2025 with more than 24.80% share. Laboratories use chemical analysis to identify PFAS, metals, pesticides, nutrients, hydrocarbons, volatile compounds, and many other environmental contaminants.
Which technology dominates environmental testing?
Rapid Testing held more than 57.20% market share in 2025. Demand is supported by laboratories and field teams requiring faster contaminant identification, quicker compliance decisions, automated analysis, and reduced turnaround time.
Mass Spectrometry dominated rapid-testing methods with more than 31.00% share in 2025. Its high sensitivity makes it valuable for measuring PFAS, pesticides, pharmaceuticals, organic pollutants, and other contaminants at trace concentrations.
Which end user dominates the Environmental Testing Market?
Government and Regulatory Agencies held more than 26.67% share in 2025. Government bodies routinely test drinking water, wastewater, soil, air, industrial discharges, and emerging contaminants to enforce environmental and public-health standards.
Which region leads the Environmental Testing Market?
North America led the global market in 2025 with more than 34.60% share, generating approximately USD 3.8 billion, supported by extensive environmental regulation, laboratory infrastructure, PFAS programs, and water-quality monitoring.
Why is PFAS testing becoming important?
EPA’s UCMR 5 monitored 29 PFAS compounds across public drinking-water systems, while Method 1633 supports measurement of 40 PFAS in several environmental media, significantly expanding laboratory requirements for emerging-contaminant testing.
What is the future outlook for environmental testing?
Future growth will be supported by stricter contaminant monitoring, PFAS testing, soil-health rules, rapid analytical technology, and water infrastructure investment. The global market is projected to reach approximately USD 19.2 billion by 2035.
Conclusion
The Environmental Testing Market is expected to expand as regulators and industries increase monitoring of water, wastewater, soil, air, and emerging pollutants. The market is projected to grow from USD 11.1 billion in 2025 to USD 19.2 billion by 2035, at a 5.6% CAGR. North America leads with 34.60% share and USD 3.8 billion in revenue. PFAS testing, soil assessment, rapid technologies, and continuous monitoring are creating new opportunities. EPA’s monitoring of 29 PFAS plus lithium, together with EU concern over 60–70% unhealthy soils, shows why accurate environmental data will remain central to compliance, remediation, infrastructure management, and public-health protection.
Discuss your needs with our analyst
Please share your requirements with more details so our analyst can check if they can solve your problem(s)