

Table of Contents
- Introduction
- Editor’s Choice
- Shared Mobility Market Statistics
- Ride-sharing Market Size Worldwide
- Shared Mobility Users and Penetration Statistics
- Leading Car-sharing Providers Worldwide
- Users in the Car-sharing Segment Worldwide
- Users of Digital Ride-hailing Services Worldwide
- Ride Sharing / Online Taxi Users in Various Countries Worldwide
- Users of Ride-Hailing & Taxi Worldwide
- Users of Uber’s Ride-sharing App Worldwide
- Age-Associated Dynamics of Shared Mobility Users Statistics
- Gender-Associated Dynamics of Shared Mobility Users
- Price Range Preference for Shared Mobility Subscriptions Statistics
- Opposition and Challenges
- Regulations for Shared Mobility Services
- Conclusion
- FAQs
Introduction
Shared Mobility Statistics: Shared mobility refers to transportation services that allow individuals to use vehicles without owning them, offering alternatives like car sharing, ride-hailing, bike and scooter rentals, and carpooling.
It is increasingly popular in urban areas due to its convenience, cost-effectiveness, and environmental benefits.
Services such as Zipcar, Uber, Lyft, Lime, and BlaBlaCar allow users to access vehicles or rides on-demand, helping reduce the need for private car ownership and providing efficient, sustainable transportation options.
Editor’s Choice
- By 2029, the global shared mobility market revenue is expected to reach USD 1,784.22 billion.
- The 2024 Global Shared Mobility Market Revenue highlights China’s dominance at USD 365 billion, with the United States following at USD 314 billion, both making significant contributions.
- In 2022, the global car-sharing market was led by Zipcar, which held the largest market share at 8%.
- As of February 2024, Vietnam leads with 68% of respondents using ride-sharing, hailing, and online taxi services, with significant variation across 56 countries.
- As of March 2024, convenience and reliability are the top reasons for using shared mobility services in Thailand, cited by 62% of males and 63% of females.
- In Hong Kong, the most important reason cited was that shared mobility services are more expensive than public transport (36%), followed by unavailability in their area (26%) and feeling unsafe (24%).
- Europe has been proactive in setting guidelines, especially for micro-mobility solutions like e-scooters and e-bikes, often reacting to the rapid proliferation of shared mobility services to address urban transport challenges and sustainability goals.
Global Shared Mobility Market Revenue Statistics
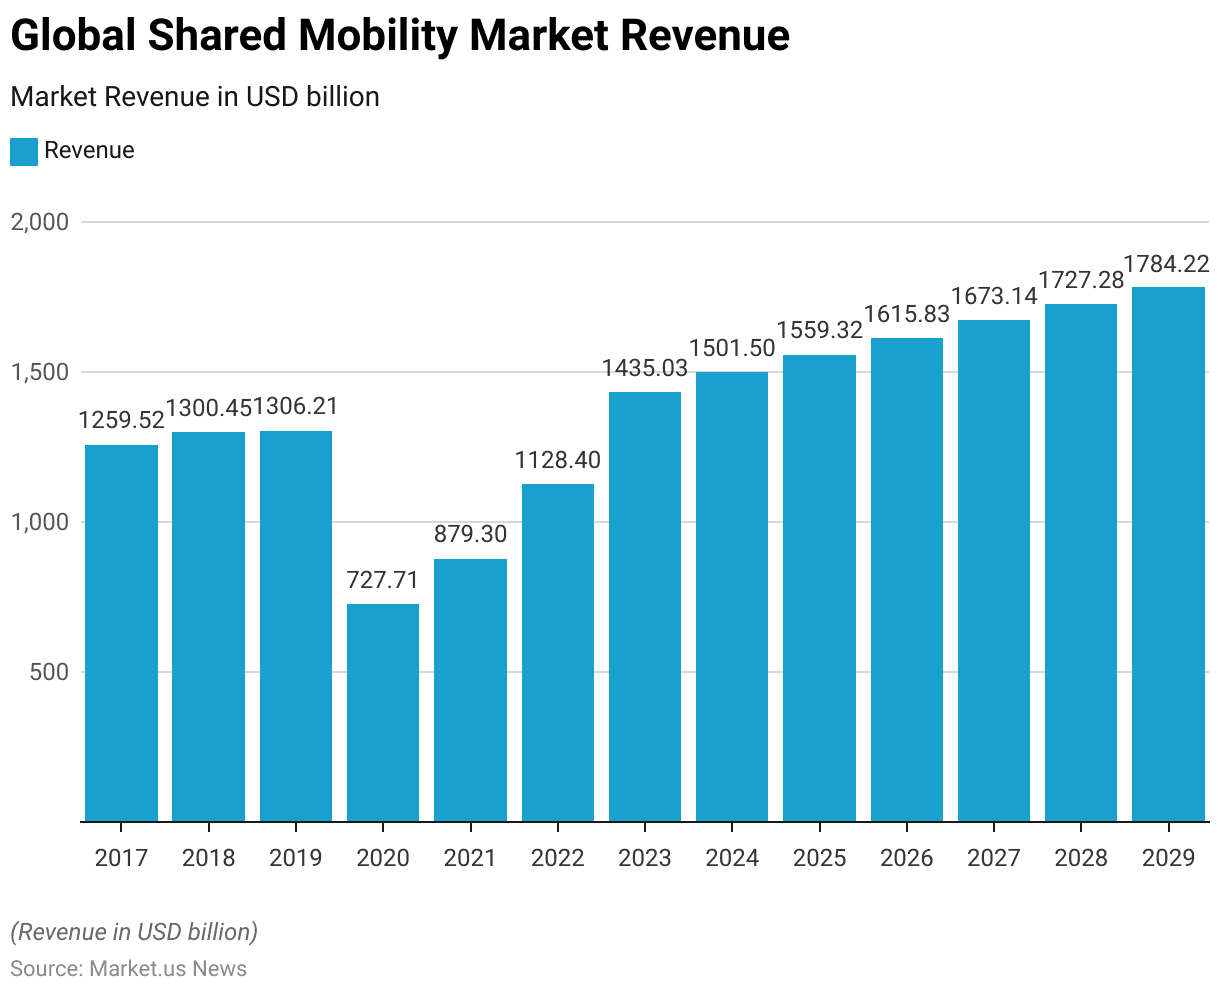
- The Global Shared Mobility Market Revenue has experienced significant changes between 2017 and 2029 at a CAGR of 3.51%.
- Starting at USD 1,259.52 billion in 2017, the market showed steady growth in 2018 at USD 1,300.45 billion and further increased to USD 1,306.21 billion in 2019.
- However, in 2020, revenue experienced a sharp decline to USD 727.71 billion, primarily due to the global impact of the COVID-19 pandemic.
- In 2021, the market began its recovery, reaching USD 879.3 billion, followed by a notable increase in 2022 to USD 1,128.4 billion.
- By 2023, the market revenue surged to USD 1,435.03 billion, reflecting robust growth.
- This upward trend is projected to continue, with revenues estimated at USD 1,501.5 billion in 2024, USD 1,559.32 billion in 2025, and USD 1,615.83 billion in 2026.
- Further growth is anticipated through 2027 and 2028, with revenues forecasted to hit USD 1,673.14 billion and USD 1,727.28 billion, respectively.
- By 2029, the market is expected to reach USD 1,784.22 billion, indicating consistent expansion over the forecast period.
(Source: Statista)
Global Shared Mobility Market Revenue – By Type Statistics
Minor
- The Global Shared Mobility Market Revenue by Type has exhibited varying growth patterns across segments between 2017 and 2029.
- Bike-sharing revenues grew steadily from USD 3.73 billion in 2017 to an estimated USD 12.66 billion in 2029, reflecting consistent expansion.
- Bus tickets, however, faced fluctuations, starting at USD 19.68 billion in 2017, dipping to USD 9.81 billion in 2021 due to pandemic impacts, before surging to USD 80.81 billion in 2023 and tapering to USD 12.32 billion by 2029.
- Car rentals demonstrated stable growth, increasing from USD 85.89 billion in 2017 to a projected USD 124.1 billion in 2029, despite a decline in 2020 to USD 56.16 billion.
- Similarly, car-sharing rose gradually from USD 8.41 billion in 2017 to USD 15.78 billion in 2029. E-scooter-sharing, a relatively new segment, grew exponentially from USD 0.01 billion in 2017 to an expected USD 2.49 billion in 2029.
Major
- Flights experienced notable volatility, with revenues dropping from USD 523.6 billion in 2019 to USD 187.7 billion in 2020 due to travel restrictions but rebounding to USD 581.4 billion in 2023 and further to USD 771.3 billion by 2029. Moped-sharing showed a similar trend, increasing from USD 0.02 billion in 2017 to USD 2.87 billion by 2029.
- Public transportation revenues fluctuated, starting at USD 288.2 billion in 2017, declining to USD 208.6 billion in 2020, and recovering to USD 322.6 billion in 2029. Ride-hailing grew from USD 105.7 billion in 2017 to USD 212.8 billion in 2029, reflecting strong demand despite a temporary drop to USD 79.58 billion in 2020.
- Taxi services have shown a gradual decline, with revenue dropping from USD 156.3 billion in 2017 to USD 132.7 billion in 2029, while train tickets increased steadily from USD 98.88 billion in 2017 to USD 161.6 billion by 2029, recovering from a 2020 low of USD 69.8 billion.
- This analysis highlights the dynamic growth and recovery patterns of shared mobility types across the global market.
(Source: Statista)
Average Revenue Per User – By Type
- The Average Revenue Per User (ARPU) for the Global Shared Mobility Market by type highlights varied trends across different segments from 2017 to 2029.
- Bike-sharing ARPU started at USD 7.26 in 2017 and steadily increased to a projected USD 11.21 in 2029, reflecting consistent growth. Bus tickets, however, saw fluctuations, beginning at USD 41.76 in 2017 and dropping significantly to USD 21.99 in 2020 before recovering to USD 41.93 by 2029.
- Car rentals declined from USD 208.1 in 2017 to USD 152.2 in 2029, with intermittent decreases, particularly in 2023 at USD 182.4.
- Car-sharing ARPU displayed stability, increasing slightly from USD 233.4 in 2017 to USD 231.3 in 2029, despite a dip to USD 165.1 in 2020. E-scooter-sharing, starting at USD 20.68 in 2017, grew gradually to USD 23.19 in 2029, reflecting increasing adoption.
- Flights remained the highest revenue segment, with ARPU peaking at USD 580.9 in 2022 before stabilizing at USD 554.5 in 2029, although it saw a temporary drop to USD 505.8 in 2020.
- Moped-sharing ARPU began at USD 96.28 in 2017 but declined to USD 62.72 in 2029, showing marginal fluctuations.
- Public transportation experienced volatility, starting at USD 70.89 in 2017, dropping to USD 54.87 in 2020, and stabilizing around USD 62.35 in 2029. Ride-hailing saw its ARPU grow from USD 80.7 in 2017 to USD 92.29 in 2029, with a significant drop to USD 52.85 in 2020.
- Taxi services began at USD 113.7 in 2017, reached USD 133.4 in 2029, and saw stable growth after recovering from a USD 79.5 low in 2020.
- Finally, train tickets displayed an upward trend, growing from USD 125.1 in 2017 to a peak of USD 132.5 in 2026 before slightly declining to USD 126.2 in 2029. These trends underscore varying recovery trajectories and growth opportunities across shared mobility types.
(Source: Statista)
Market Drivers for Revenue Change
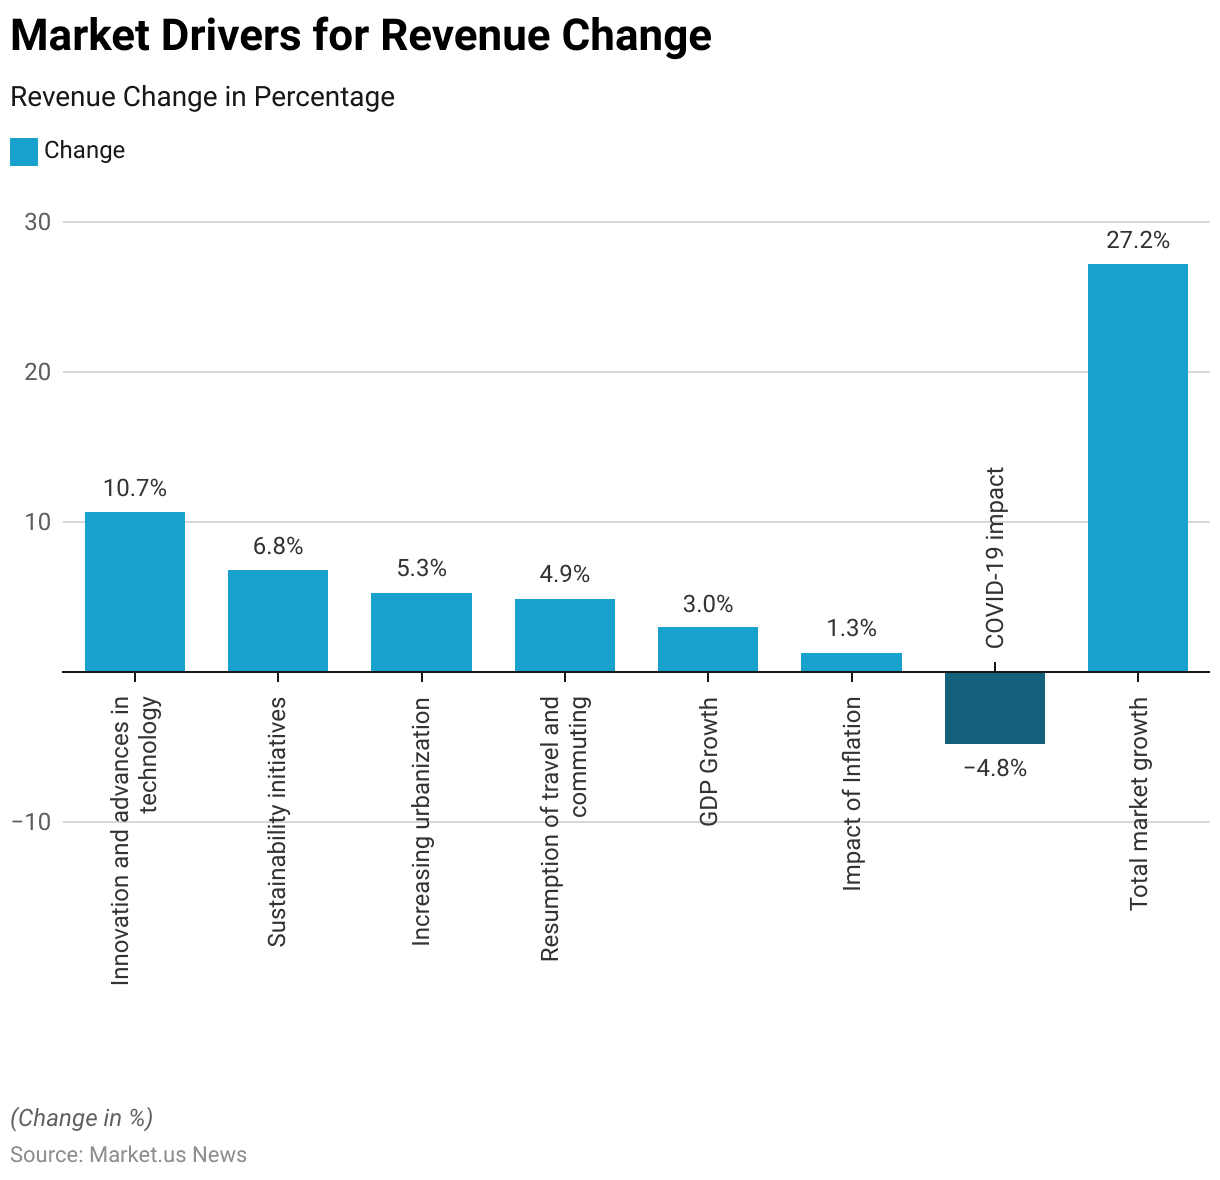
- The Global Shared Mobility Market Revenue has been driven by several factors, contributing to an overall market growth of 27.2%.
- The primary drivers are innovation and advances in technology, which contributed 10.7% to revenue change.
- This was followed by sustainability initiatives, adding 6.8%, reflecting the shift toward eco-friendly transportation solutions.
- Increasing urbanization contributed 5.3%, highlighting the demand for shared mobility services in growing cities.
- Additionally, the resumption of travel and commuting post-pandemic boosted revenue by 4.9%, while GDP growth added 3% to the market expansion.
- However, external economic challenges, such as the impact of inflation, accounted for a smaller increase of 1.3%.
- The COVID-19 impact, on the other hand, led to a negative revenue change of -4.8%, indicating the lingering disruptions caused by the pandemic.
- Collectively, these drivers illustrate the balance of positive and negative influences shaping the market’s overall growth trajectory.
(Source: Statista)
Global Shared Mobility Market Share – By Sales Channel Statistics
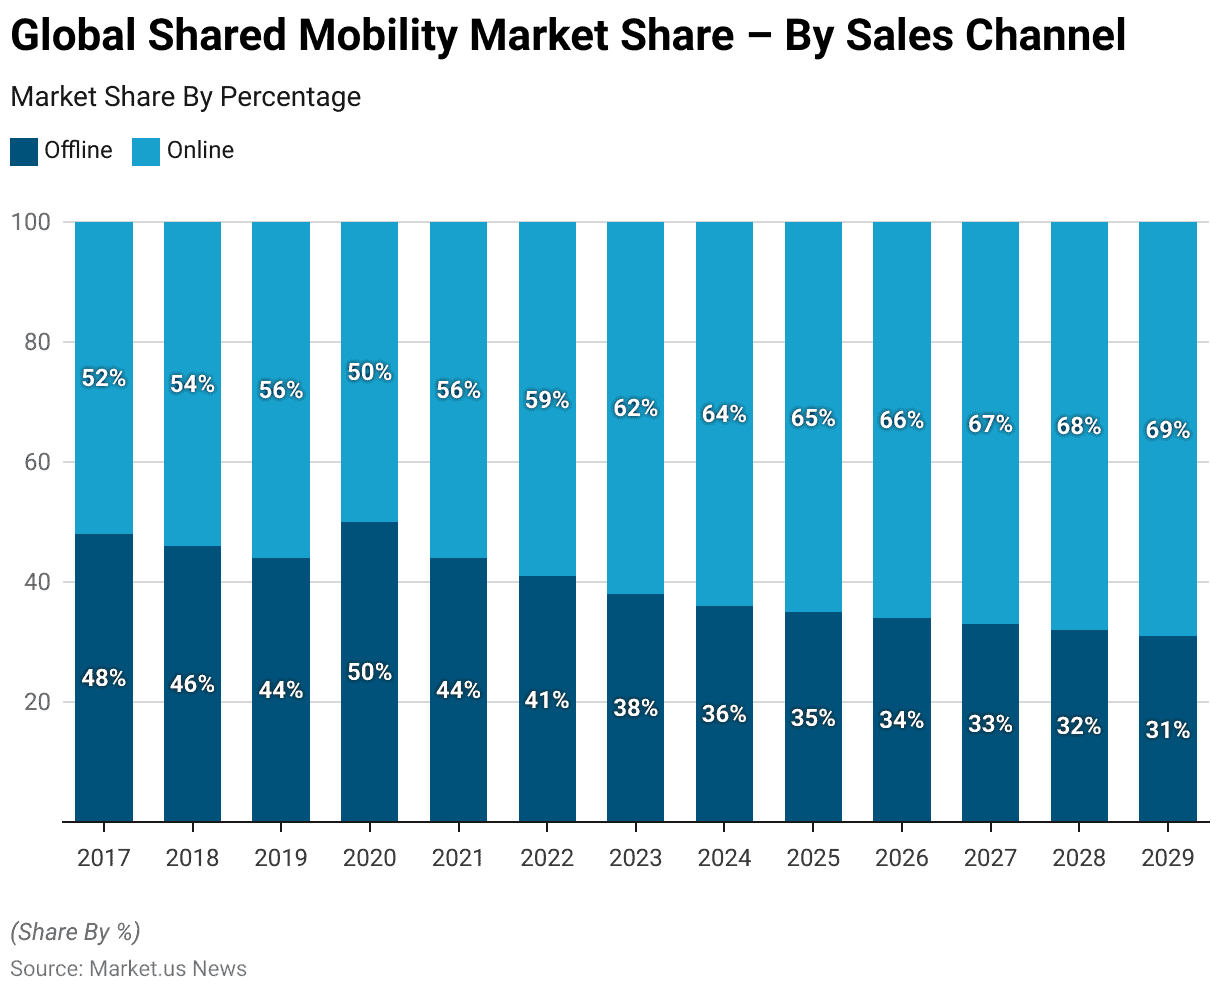
- The Global Shared Mobility Market Share by Sales Channel has shown a steady shift from offline to online channels between 2017 and 2029.
- In 2017, offline channels accounted for 48% of the market share, while online sales held a slight majority at 52%.
- This trend continued in 2018 and 2019, with offline channels declining to 46% and 44%, respectively, as online sales increased to 54% and 56%.
- In 2020, offline and online channels reached parity at 50% each due to pandemic-related disruptions.
- Post-2020, the market shifted strongly towards online channels. By 2021, offline share decreased again to 44%, with online increasing to 56%.
- This trend accelerated, with offline declining to 41% in 2022, 38% in 2023, and 36% in 2024, while online channels grew to 59%, 62%, and 64%, respectively.
- The forecasted data shows a continued decline in offline sales, reaching 35% in 2025, 34% in 2026, 33% in 2027, and 32% in 2028, ultimately dropping to 31% in 2029.
- Correspondingly, online market share is expected to climb steadily to 65% in 2025, 66% in 2026, 67% in 2027, 68% in 2028, and 69% by 2029.
- This data highlights the growing dominance of online sales channels in the shared mobility market, driven by digital transformation, convenience, and changing consumer preferences.
(Source: Statista)
Global Shared Mobility Market Size – By Region Statistics
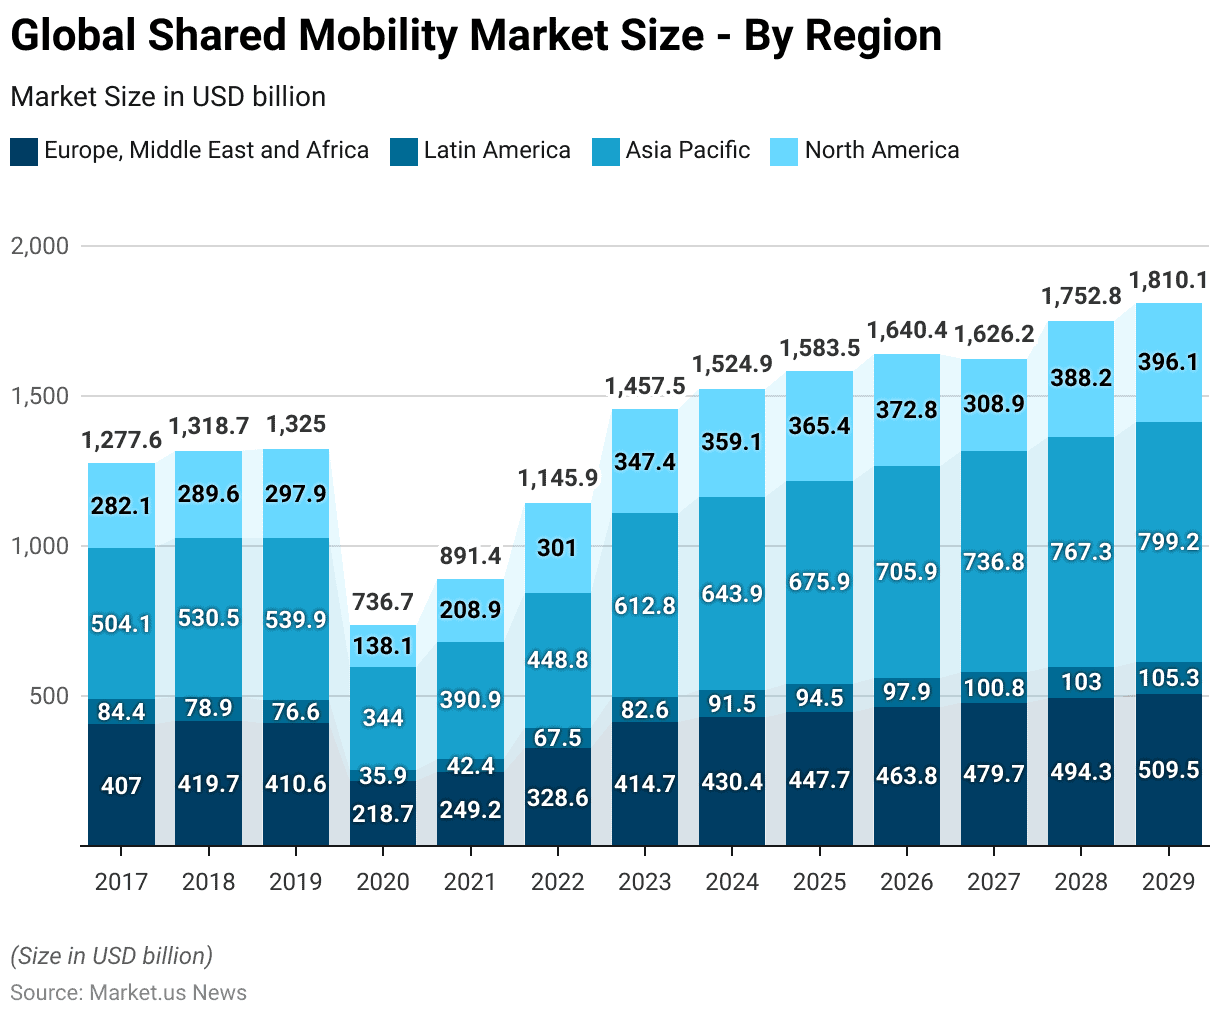
- The global shared mobility market size by region has demonstrated varied trends from 2017 to 2029, with significant growth across Europe, the Middle East, Africa (EMEA), Latin America, Asia Pacific, and North America.
- In 2017, the market size stood at $407 billion in EMEA, $84.44 billion in Latin America, $504.1 billion in Asia Pacific, and $282.1 billion in North America. By 2018, Asia Pacific led the market with $530.5 billion, while EMEA and North America followed at $419.7 billion and $289.6 billion, respectively.
- In 2019, Asia Pacific reached $539.9 billion, EMEA stood at $410.6 billion, Latin America dipped slightly to $76.59 billion, and North America grew to $297.9 billion.
- The 2020 pandemic severely impacted the market, with Asia Pacific shrinking to $344 billion, EMEA to $218.7 billion, Latin America to $35.93 billion, and North America to $138.1 billion. Recovery began in 2021, with Asia Pacific reaching $390.9 billion, EMEA at $249.2 billion, and North America rebounding to $208.9 billion.
- By 2022, Asia Pacific surged to $448.8 billion, while EMEA and North America grew to $328.6 billion and $301 billion, respectively. Projections for 2023 indicate Asia Pacific at $612.8 billion, EMEA at $414.7 billion, North America at $347.4 billion, and Latin America at $82.61 billion.
- The market is forecast to grow steadily through 2029, with Asia Pacific leading at $799.2 billion, followed by EMEA at $509.5 billion, North America at $396.1 billion, and Latin America at $105.3 billion.
- This data highlights Asia Pacific’s dominance in the shared mobility market, with steady contributions from other regions driven by urbanization, technology adoption, and economic recovery.
(Source: Statista)
Global Shared Mobility Market Revenue – By Country Statistics
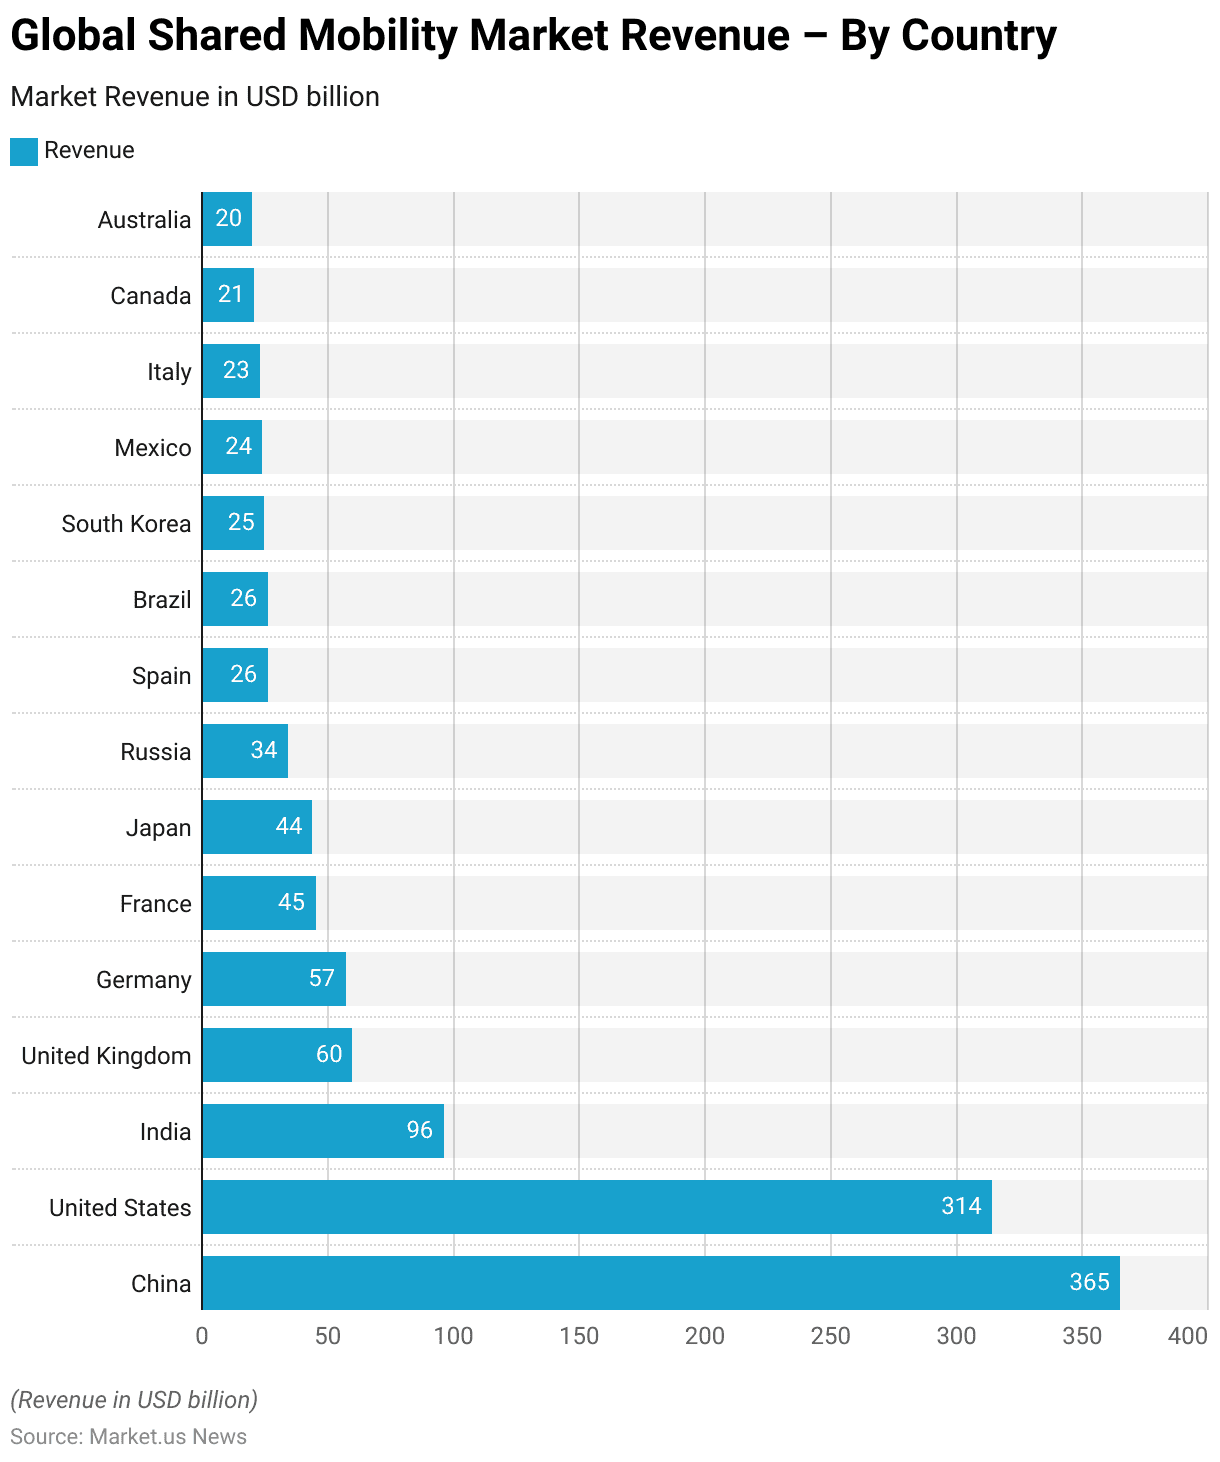
- The Global Shared Mobility Market Revenue by Country for 2024 highlights China’s dominance with a projected revenue of USD 365 billion, followed closely by the United States at USD 314 billion, showcasing their significant contributions to the market.
- India ranks third with USD 96 billion, reflecting the growing adoption of shared mobility services in the region.
- In Europe, the United Kingdom and Germany report revenues of USD 60 billion and USD 57 billion, respectively, while France contributes USD 45 billion.
- In Asia, Japan holds a revenue share of USD 44 billion, while South Korea follows with USD 25 billion.
- Russia accounts for USD 34 billion, illustrating its position among leading markets.
- In Southern Europe and Latin America, Spain and Brazil each generate USD 26 billion, while Mexico and Italy report revenues of USD 24 billion and USD 23 billion, respectively.
- North America’s Canada contributes USD 21 billion, and Australia closes the list with USD 20 billion.
- This data emphasizes the regional differences in market size, with China and the U.S. leading the way. In contrast, emerging markets like India and Brazil demonstrate significant potential for growth in the shared mobility sector.
(Source: Statista)
Ride-sharing Market Size Worldwide
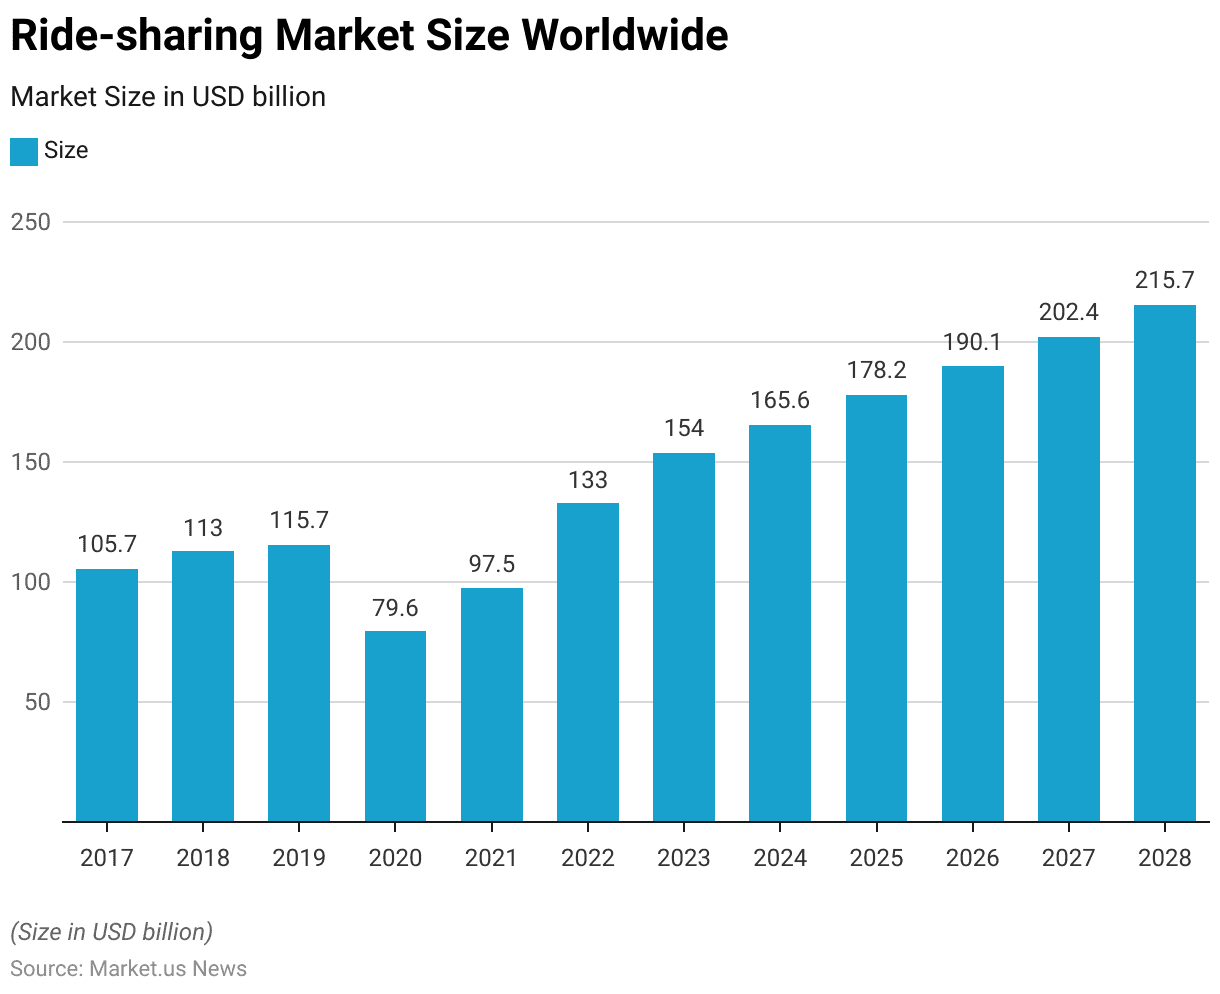
- The global ride-sharing market size has shown significant growth trends from 2017 to 2023, with a promising forecast through 2028.
- In 2017, the market size was valued at USD 105.7 billion and increased to USD 113 billion in 2018.
- By 2019, the market reached USD 115.7 billion, showcasing steady growth.
- However, the 2020 pandemic led to a sharp decline, with the market contracting to USD 79.58 billion.
- Recovery began in 2021, with the market rebounding to USD 97.52 billion and further accelerating to USD 133 billion in 2022.
- In 2023, the market size is projected to reach USD 154 billion, marking significant growth.
- Forecasts indicate continued expansion, with the market expected to rise to USD 165.6 billion in 2024, USD 178.2 billion in 2025, and USD 190.1 billion in 2026.
- By 2027, the market is anticipated to grow to USD 202.4 billion, and by 2028, it is forecasted to reach USD 215.7 billion.
- This data highlights the resilience and strong recovery of the ride-sharing market, driven by increased urbanization, technological adoption, and rising demand for cost-effective and convenient transportation solutions worldwide.
(Source: Statista)
Shared Mobility Users – By Type Statistics
- The Global Shared Mobility User Base by Type (in million users) has demonstrated significant variation between 2017 and 2029.
- Bike-sharing saw continuous growth from 513.1 million users in 2017 to a projected 1,129 million users in 2029, reflecting rising popularity.
- Bus tickets grew modestly from 471.3 million users in 2017 to 604 million users in 2029, showing steady demand. Car rentals, however, experienced a drop to 284.6 million users in 2020 but rebounded to 815.3 million users in 2029.
- Car-sharing started with 36.04 million users in 2017 and grew gradually to 68.19 million users by 2029 while e-scooter-sharing surged from a mere 0.52 million users in 2017 to an expected 107.4 million users in 2029, indicating rapid adoption.
- Flights experienced a significant decline to 371.1 million users in 2020 due to pandemic restrictions but are forecasted to recover strongly to 1,391 million users by 2029.
- Moped-sharing showed exponential growth from 0.25 million users in 2017 to 45.68 million users by 2029.
- Public transportation remained the largest segment, growing from 4,066 million users in 2017 to 5,174 million users by 2029, recovering from a dip to 3,659 million users in 2021. Ride-hailing users increased steadily from 1,310 million in 2017 to a forecasted 2,305 million in 2029.
- Conversely, taxi services showed a declining trend, falling from 1,375 million users in 2017 to 995.2 million users in 2029.
- Lastly, train ticket users steadily increased from 790.5 million in 2017 to 1,281 million users by 2029, reflecting the growing demand for rail travel. This data highlights dynamic growth patterns and shifts in user preferences across shared mobility services globally.
(Source: Statista)
Shared Mobility Penetration Rate – By Type Statistics
- The Global Shared Mobility Penetration Rate by Type (%) has shown diverse trends between 2017 and 2029.
- Bike-sharing consistently grew from 7% in 2017 to a projected 14% in 2029, indicating its increasing adoption.
- Bus tickets maintained stability, starting at 6.5% and gradually increasing to 7.5% in 2029. Car rentals experienced fluctuations, dropping to 3.8% in 2020 due to pandemic disruptions but recovering to 10.1% in 2029.
- Car-sharing saw minor growth, moving from 0.5% in 2017 to 0.9% in 2029, while e-scooter-sharing, starting at 0% in 2017, expanded to 1.3% by 2022 and remained steady through 2029.
- Flights dropped significantly to 4.9% in 2020 but rebounded to a projected 17.3% in 2029, reflecting post-pandemic recovery and demand.
- Moped-sharing exhibited slow growth, rising from 0% in 2017 to 0.6% in 2029, while public transportation maintained its dominance, starting at 55.8% in 2017, dipping to 50.7% in 2020, and recovering to 64.2% by 2029.
- Ride-hailing displayed consistent growth, increasing from 18% in 2017 to 28.6% in 2029, showing strong market penetration.
- Conversely, taxi services faced a steady decline, dropping from 18.9% in 2017 to 12.4% in 2029, reflecting a shift toward other mobility options. Lastly, train tickets grew steadily from 10.9% in 2017 to 15.9% in 2029, indicating rising demand for rail transportation.
- This data underscores evolving consumer preferences, with shared mobility options like bike-sharing, ride-hailing, and flights gaining traction while traditional taxis decline.
(Source: Statista)
Leading Car-sharing Providers Worldwide
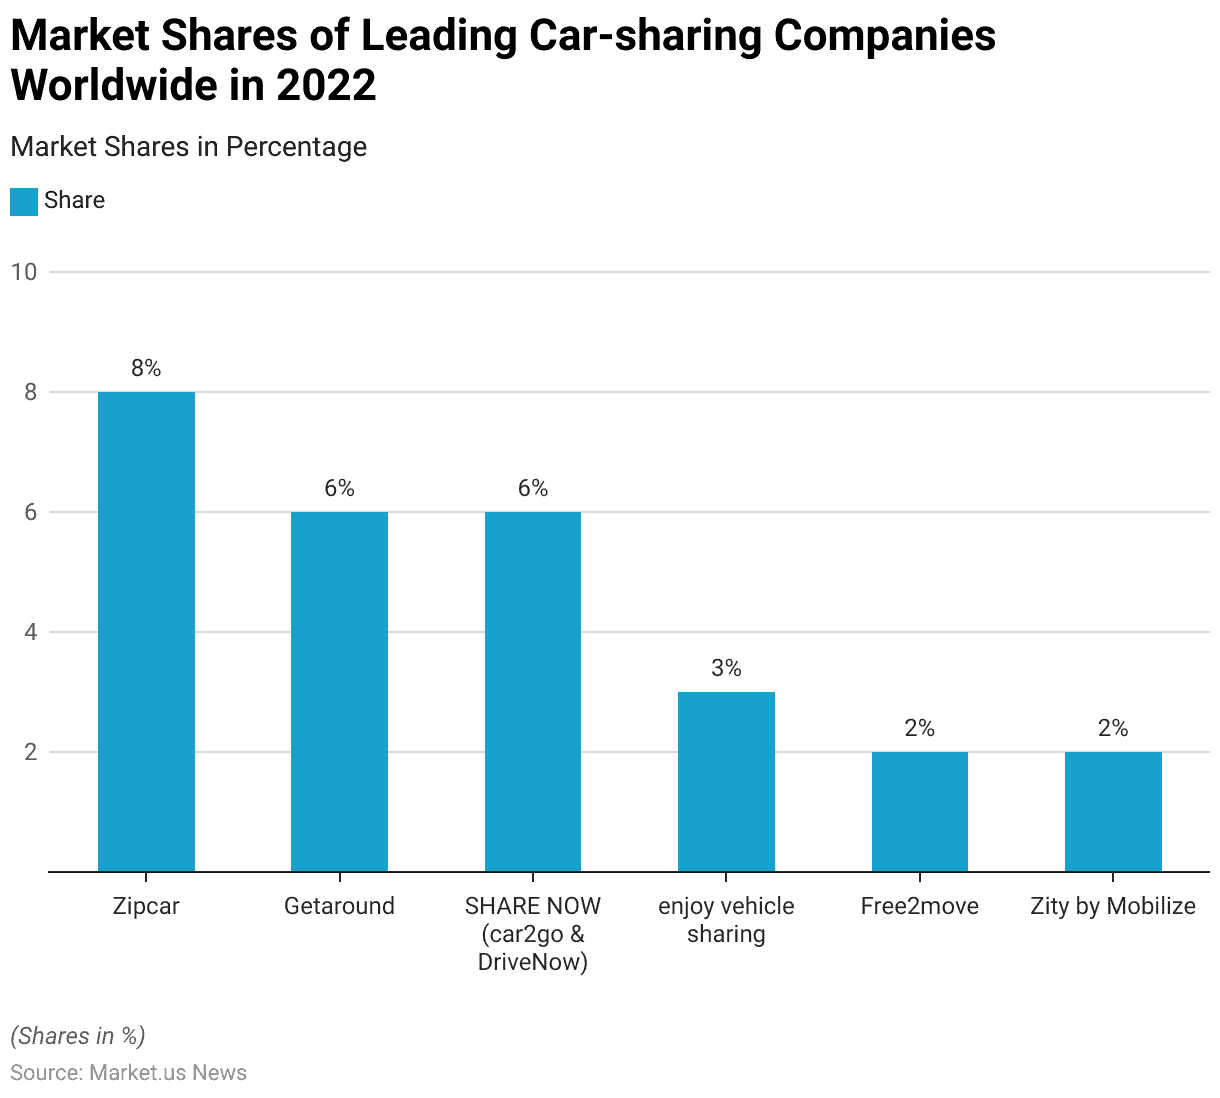
- In 2022, the global car-sharing market was led by Zipcar, which held the largest market share at 8%.
- Both Getaround and SHARE NOW (car2go & DriveNow) followed closely, each capturing a 6% market share.
- Enjoy vehicle sharing accounted for 3% of the market, while Free2move and Zity by Mobilize held smaller shares, each at 2%.
- This data highlights Zipcar’s dominance in the car-sharing sector, with significant competition from other key players striving to expand their market presence.
(Source: Statista)
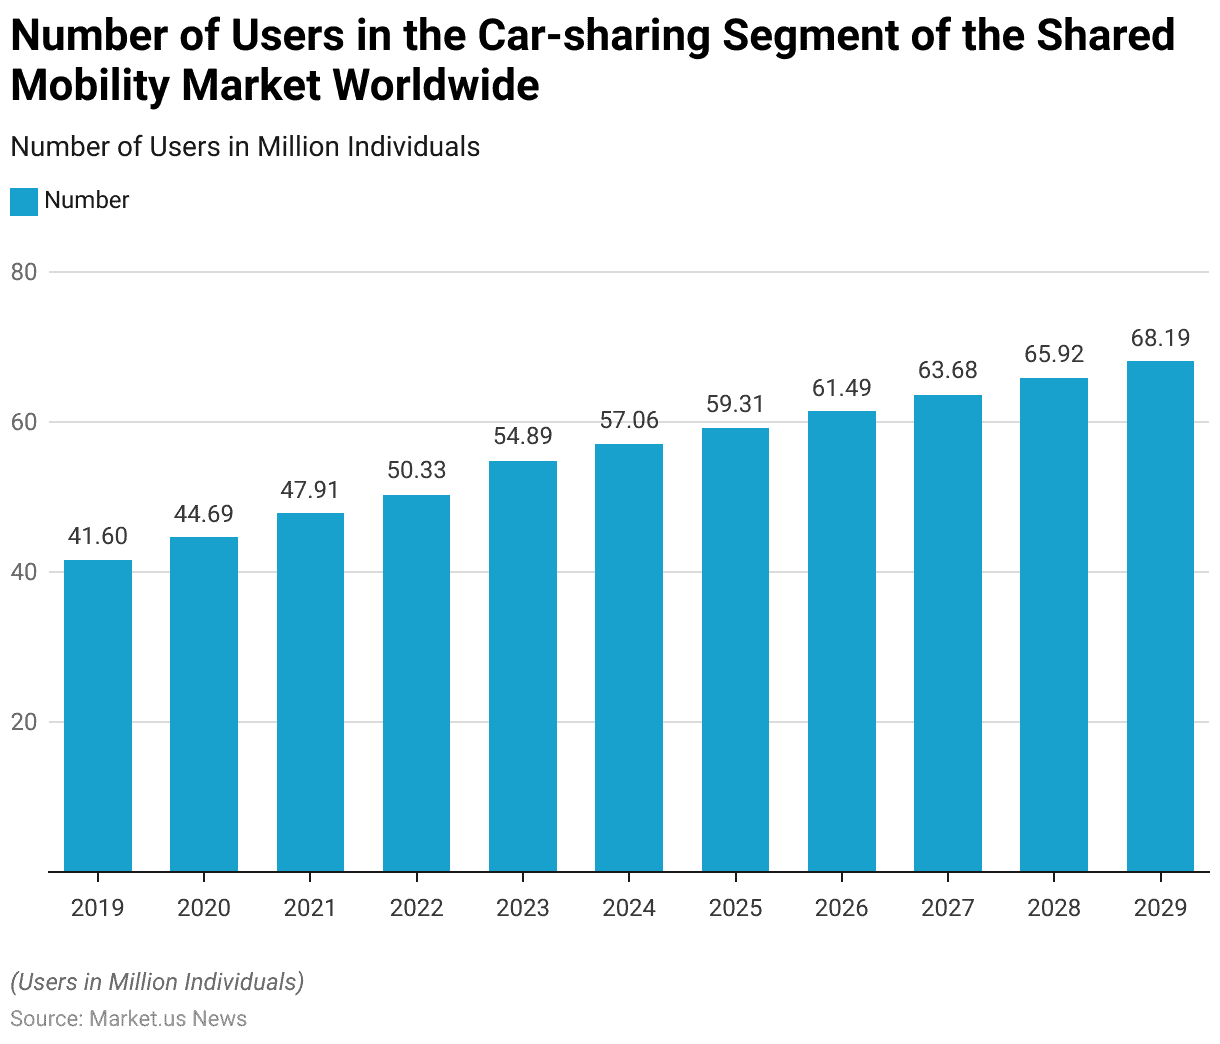
Users in the Car-sharing Segment Worldwide
- The number of users in the car-sharing segment of the shared mobility market worldwide has shown consistent growth from 2019 to 2029.
- In 2019, the number of users stood at 41.6 million, which increased to 44.69 million in 2020.
- By 2021, the user base grew to 47.91 million, and further to 50.33 million in 2022.
- This upward trend continued in 2023, reaching 54.89 million users.
- Projections indicate steady growth in the coming years, with the number of users expected to rise to 57.06 million in 2024 and 59.31 million in 2025.
- The user base is forecasted to expand further to 61.49 million in 2026, 63.68 million in 2027, and 65.92 million in 2028.
- By 2029, the car-sharing segment is anticipated to reach 68.19 million users, showcasing sustained growth driven by increasing urbanization, demand for cost-effective transportation, and the adoption of shared mobility services globally.
(Source: Statista)
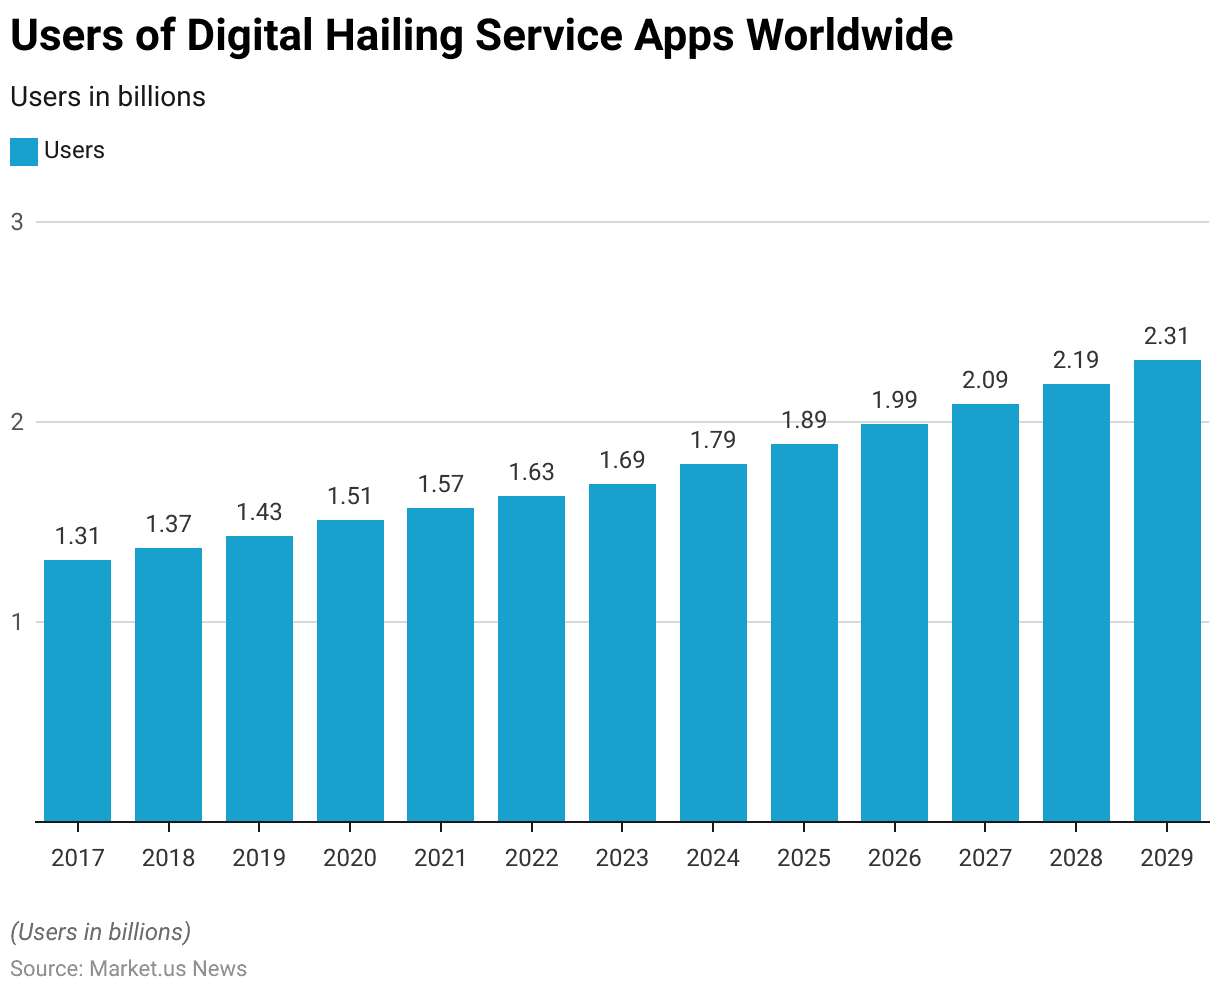
Users of Digital Ride-hailing Services Worldwide
- The number of users of digital-hailing service apps worldwide has shown consistent growth between 2017 and 2029.
- In 2017, the user base stood at 1.31 billion, which increased steadily to 1.37 billion in 2018 and 1.43 billion in 2019.
- Despite challenges in 2020, the user base reached 1.51 billion, indicating resilience in the sector.
- Growth continued in 2021 and 2022, with users rising to 1.57 billion and 1.63 billion, respectively.
- Projections for the upcoming years reflect a strong upward trend, with the user base expected to reach 1.69 billion in 2023 and further grow to 1.79 billion in 2024.
- By 2025, users are forecasted to hit 1.89 billion, followed by 1.99 billion in 2026.
- This growth accelerates through 2027, with users reaching 2.09 billion and 2.19 billion in 2028.
- By the end of the forecast period in 2029, the number of users is expected to rise to 2.31 billion, reflecting increasing global reliance on digital hailing services driven by urbanization, technological advancements, and changing transportation preferences.
(Source: Statista)
Ride Sharing / Online Taxi Users in Various Countries Worldwide
- As of February 2024, the share of ride-sharing, hailing, and online taxi users varied significantly across 56 countries and territories worldwide.
- Leading the list is Vietnam, with 68% of respondents using these services, followed closely by Colombia, Mexico, and Peru, each at 67%. China recorded a user share of 66%, while Singapore, Dominican Republic, and Russia all stood at 65%.
- Kenya and Nigeria followed closely with 63%, while Chile and Indonesia reported 62%. South Africa registered 60%, and Brazil and Egypt had a user base of 58%.
- The United Arab Emirates and Hong Kong each had 56%, while India and Saudi Arabia stood at 55%. Australia reported 51%, while Malaysia recorded 47%.
- In the 43% range were Argentina, Thailand, South Korea, and the Philippines, whereas the United Kingdom reported 42%. Pakistan and Lithuania stood at 41%, followed by Romania and New Zealand at 40%.
- Turkey had 39%, and Poland and Ireland shared 37%. In North America, the United States recorded 36%, while Canada was at 34%, alongside Portugal and Taiwan.
- Spain registered 33%, followed by Israel at 30%, and Sweden and Finland both at 29%. Greece had 28%, while Serbia, Switzerland, and Norway each stood at 26%.
- Further down, Morocco recorded 21%, while Germany had 19%. France and Czechia shared 18%, with Austria at 17% and Italy and the Netherlands at 16%, respectively. Japan and Belgium reported 12%, while Hungary had the lowest share at 10%.
- This data highlights substantial regional variations, with developing markets in Asia, Latin America, and Africa showing higher adoption rates compared to many developed European nations.
(Source: Statista)
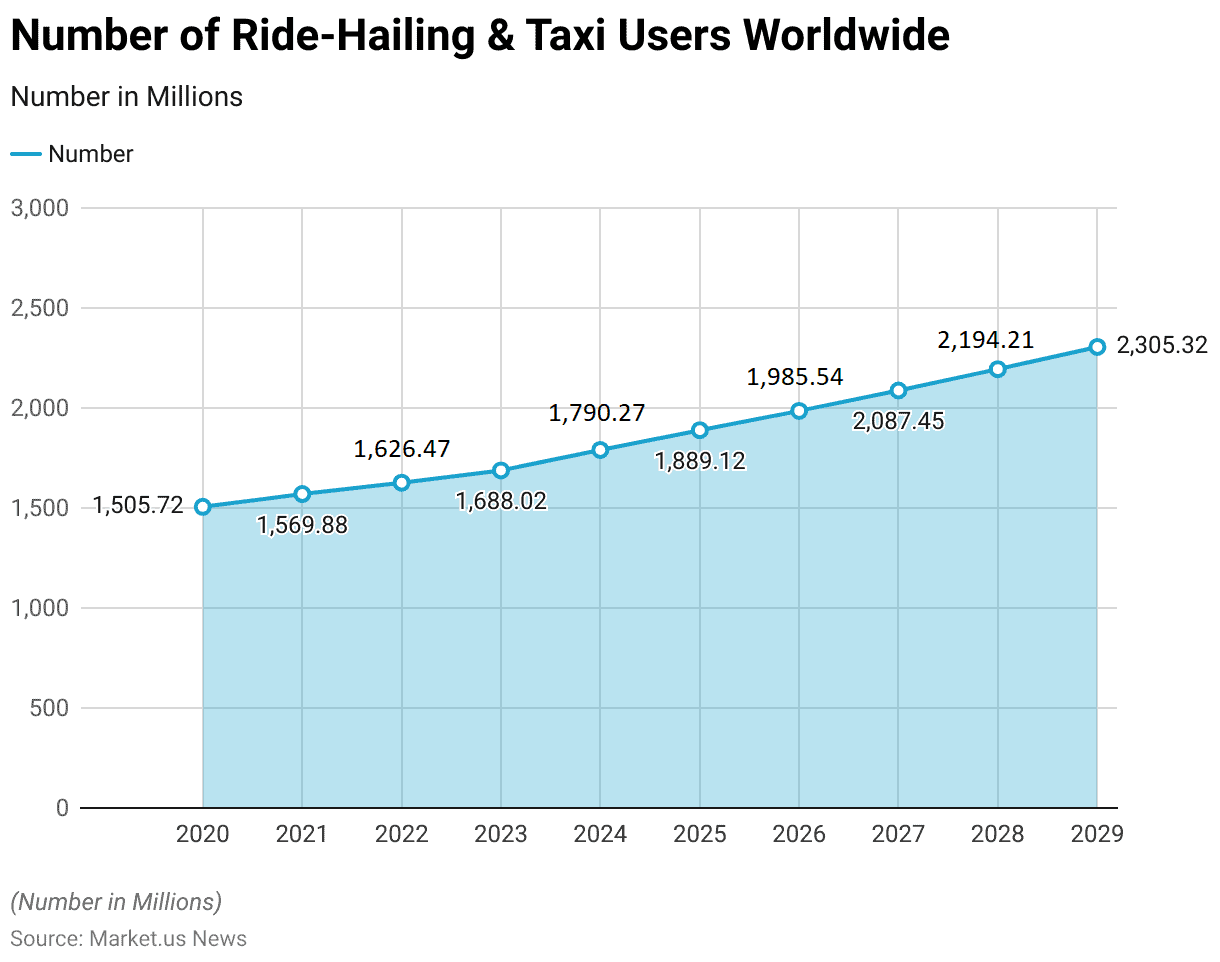
Users of Ride-Hailing & Taxi Worldwide
- The number of users of ride-hailing and taxi services worldwide has shown consistent growth from 2020 to 2029.
- In 2020, the user base stood at 1,505.72 million, which grew to 1,569.88 million in 2021 and further to 1,626.47 million in 2022.
- By 2023, the user count reached 1,688.02 million, reflecting increasing global demand for ride-hailing and taxi services.
- The upward trend continues into the forecast years, with the number of users projected to reach 1,790.27 million in 2024, surpassing 1,889.12 million in 2025.
- By 2026, the user base is expected to grow to 1,985.54 million, crossing the 2 billion mark in 2027 at 2,087.45 million.
- This growth accelerates further in 2028, with an estimated 2,194.21 million users, culminating in 2,305.32 million users by 2029.
- This consistent growth highlights the increasing reliance on ride-hailing and taxi services worldwide, driven by urbanization, technological adoption, and shifting consumer preferences toward convenient and cost-effective mobility solutions.
(Source: Statista)
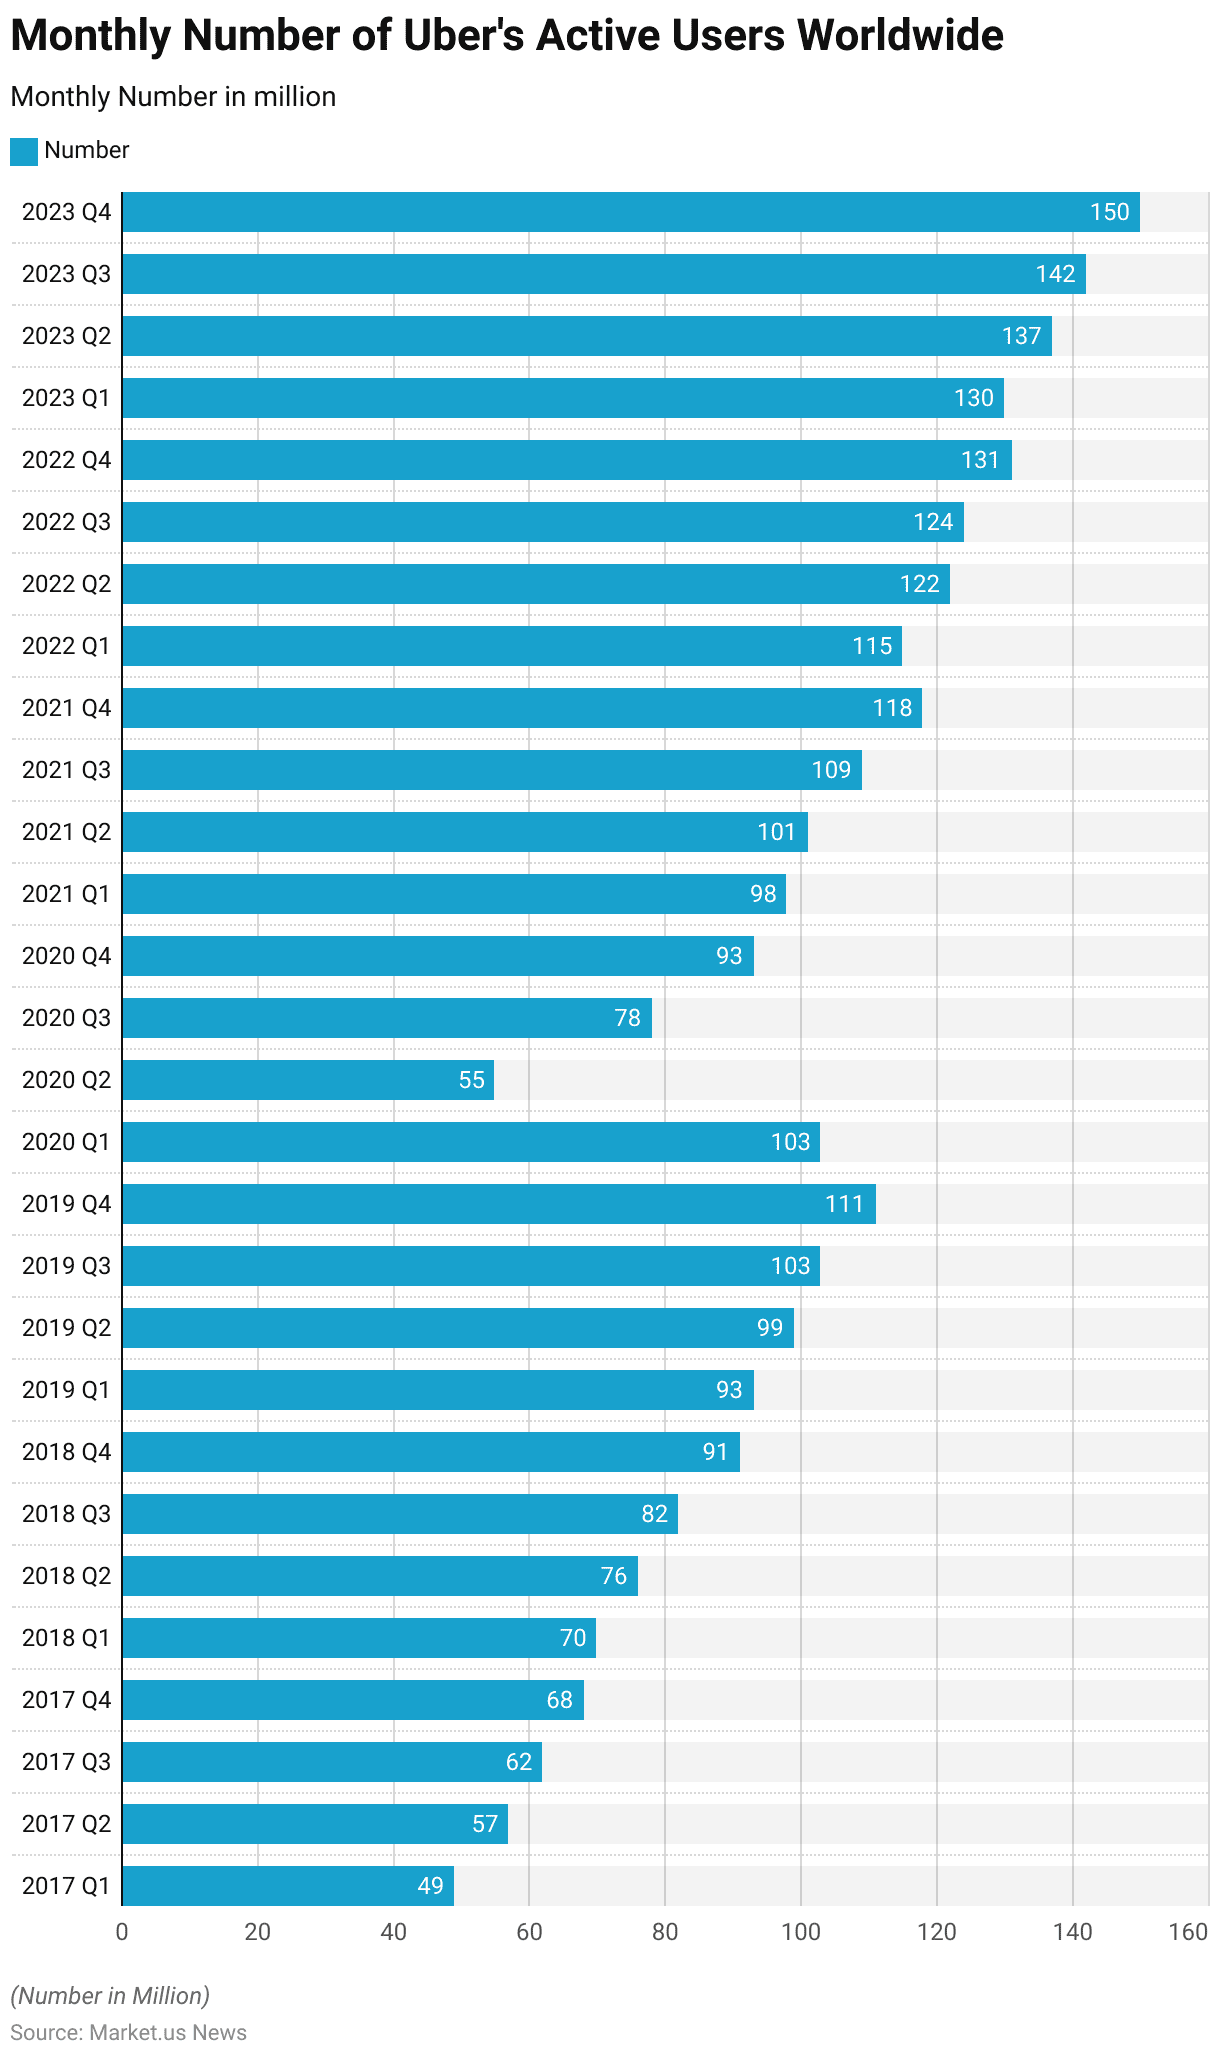
Users of Uber’s Ride-sharing App Worldwide
- The monthly number of Uber’s active users worldwide has exhibited significant growth from 2017 to 2023, with notable variations by quarter.
- In 2017, the user base increased steadily from 49 million in Q1 to 68 million in Q4.
- This upward trend continued in 2018, starting at 70 million in Q1 and reaching 91 million by Q4, reflecting consistent growth.
- By 2019, Uber’s users grew further to 93 million in Q1, 99 million in Q2, 103 million in Q3, and 111 million in Q4, marking a strong year for the company.
- The 2020 pandemic significantly disrupted this growth, with users declining sharply to 55 million in Q2 2020 after peaking at 103 million in Q1 2020.
- Recovery began in subsequent quarters, with numbers climbing back to 78 million in Q3 2020 and 93 million in Q4 2020. In 2021, Uber witnessed a steady rebound, starting at 98 million in Q1, rising to 101 million in Q2, 109 million in Q3, and reaching 118 million by Q4 2021.
- Growth continued in 2022, with active users increasing from 115 million in Q1 to 122 million in Q2, 124 million in Q3, and 131 million in Q4.
- By 2023, the recovery solidified, with Q1 recording 130 million users, Q2 at 137 million, Q3 at 142 million, and a significant increase to 150 million users in Q4 2023.
- This data highlights Uber’s resilience, strong user recovery post-pandemic, and consistent growth trajectory over the years.
(Source: Statista)
Most Used Shared Mobility Services – By Age Group Statistics
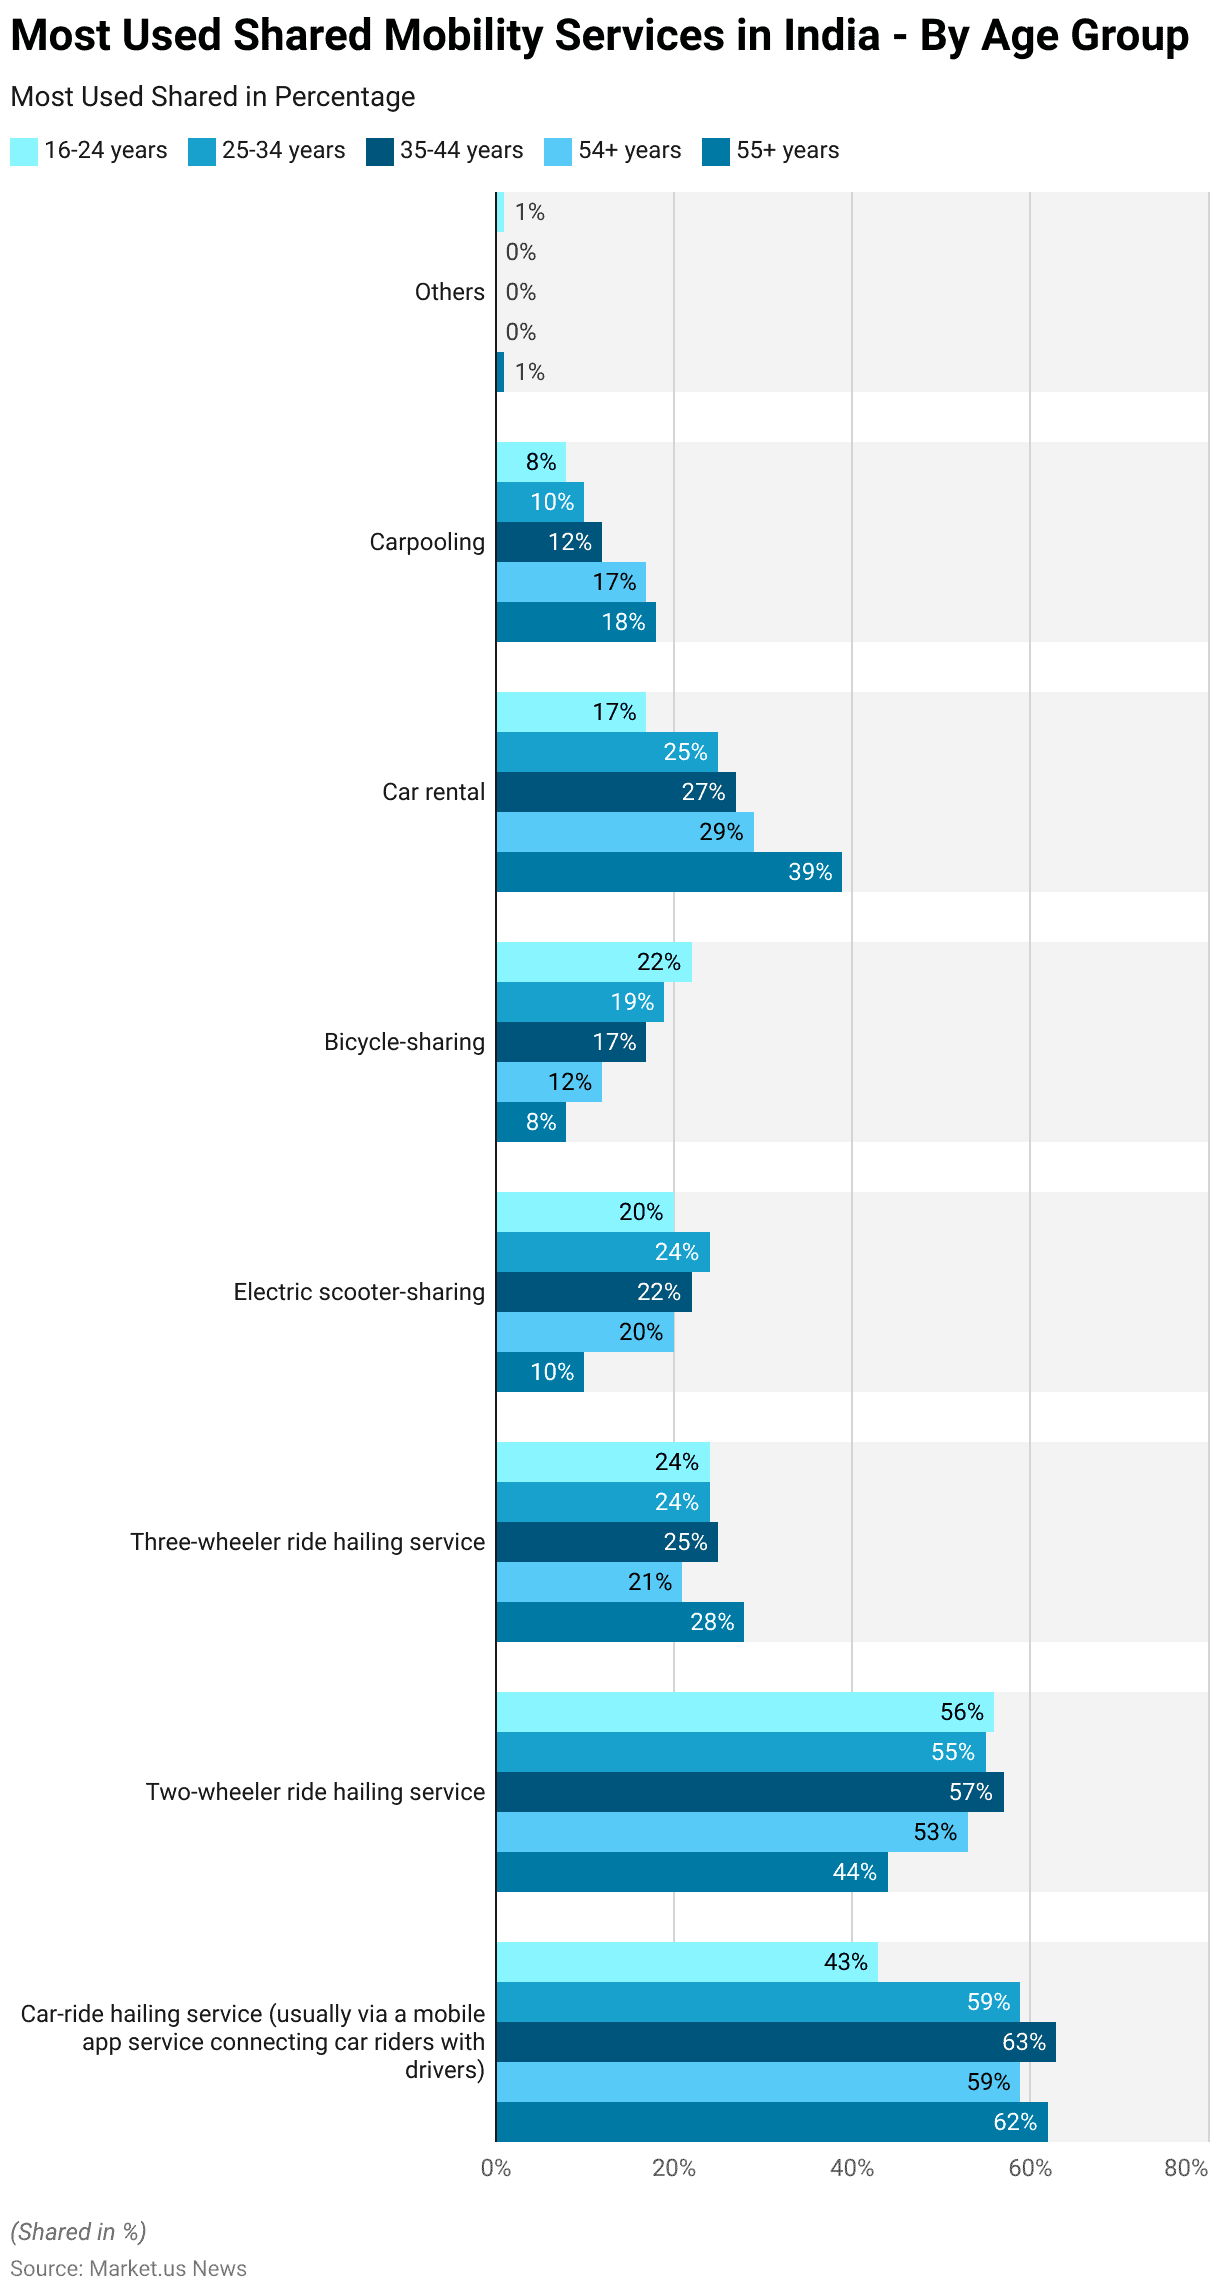
- As of March 2024, the most used shared mobility services in India vary significantly by age group.
- Car-ride hailing services remain highly popular across all age groups, with usage at 43% for 16-24 years, 59% for 25-34 years, peaking at 63% for 35-44 years, and slightly decreasing to 59% for 54+ years and 62% for 55+ years.
- Two-wheeler ride-hailing services also see widespread adoption, especially among younger users, with 56% usage among 16-24 years and 55% for 25-34 years, while it decreases to 44% for the 55+ age group.
- Three-wheeler ride-hailing services maintain moderate popularity, with 24% usage for 16-34 years and 25% for 35-44 years, while increasing to 28% for 55+ years.
- Electric scooter-sharing services appeal more to younger age groups, with 20% usage for 16-24 years and 24% for 25-34 years, but this declines steadily to 10% for 55+ years.
- Similarly, bicycle-sharing services are primarily used by the younger demographic, at 22% for 16-24 years, reducing to 8% for 55+ years.
- Car rentals see a reverse trend, being least popular with younger groups at 17% for 16-24 years but growing steadily with age to 39% for 55+ years.
- Carpooling also increases with age, starting at 8% for 16-24 years and reaching 18% for 55+ years.
- Finally, the ‘Others’ category remains negligible across all age groups, with usage not exceeding 1%. This data highlights generational preferences, with younger users favoring two-wheelers and shared scooters, while older demographics lean towards car rentals and carpooling services.
(Source: Statista)
Motivations for Using Shared Mobility Services – By Age Group Statistics
- As of March 2024, the leading reasons for using shared mobility services in Malaysia vary across different age groups.
- Convenience and reliability emerged as the top reason across all age groups, with 59% for 16-24 years, rising to 63% for 25-34 years, peaking at 72% for 45-54 years, and settling at 67% for 55 years and above.
- The ease of using ride-sharing/hailing apps was more prominent among younger users, with 32% for 16-24 years and 38% for 25-34 years, but this declined to 25% for the 55+ age group. Similarly, cashless payments were favored by younger groups, with 26% for 16-24 years and 30% for 25-34 years, decreasing to 24% for 55+ years.
- Fare transparency was cited by 13% of 16-24 years, rising to 19% for 45-54 years and 17% for 55+ years. The perception that shared mobility is cheaper than other alternatives was more consistent across age groups, ranging from 18% to 22%. Late-hours availability was valued uniformly, with 11-13% across all age categories.
More Insights
- Other reasons included being a good option after alcohol consumption, increasing with age from 7% for 16-24 years to 13% for 55+ years, and the ability to verify drivers, which rose from 7% for 16-24 years to 15% for 55+ years.
- Display of trip details was cited by fewer users, ranging from 6% to 9% across groups. Environmental sustainability remained steady, with 10-12% across all age groups.
- Unique trends emerged for younger users, with 32% of 16-24-year-olds relying on shared mobility due to not owning a car, compared to just 10% for the 55+ group. Similarly, 14% of those 16-24 years old reported not knowing how to drive, decreasing to 4% for those 55+ years.
- Lastly, the ‘Others’ category saw a notable rise among the oldest age group at 6%, while being negligible for younger groups.
- These insights highlight generational differences in priorities, with convenience dominating across all age groups and specific concerns like affordability and accessibility varying by age.
(Source: Statista)
Frequency of Using Shared Mobility Services – By Age Group Statistics
- As of March 2024, the frequency of using shared mobility services in the Philippines varies across different age groups.
- Among 16 to 24-year-olds, 26% use shared mobility services daily, the highest across age groups, while 29% use them 2-5 times per week. Usage declines slightly for older groups, with 21% of 25 to 34 years and 14% of 55 years and above using these services daily.
- Similarly, 2-5 times per week is reported by 26% of 25 to 34 years, 24% of 35 to 44 years, 23% of 45 to 54 years, and 24% of 55+ years.
- The once-per-week usage pattern is consistent for 16 to 24 years (16%) and 35 to 44 years (16%) but increases to 20% among the 45 to 54 years group and drops to 13% for 55+ years.
- Usage 2-5 times per month remains relatively stable across most age groups, ranging from 7% to 11%, with the highest being 11% for the 55+ years group.
- Monthly usage patterns show slight variations, with 7% of 16 to 24 years and 25 to 34 years using services once per month, increasing to 12% for the 55+ years group. Occasional use grows with age, starting at 14% for 16 to 24 years and peaking at 25% for 55+ years.
- Notably, the ‘Never’ category is minimal across all age groups except for 55+ years, where it rises to 7%, compared to only 1% for 16 to 44 years and 0% for 45 to 54 years.
- This data highlights that younger individuals, particularly those 16 to 24 years old, are more frequent users, while older age groups, especially those 55+ years, favor occasional use or abstain altogether.
(Source: Statista)
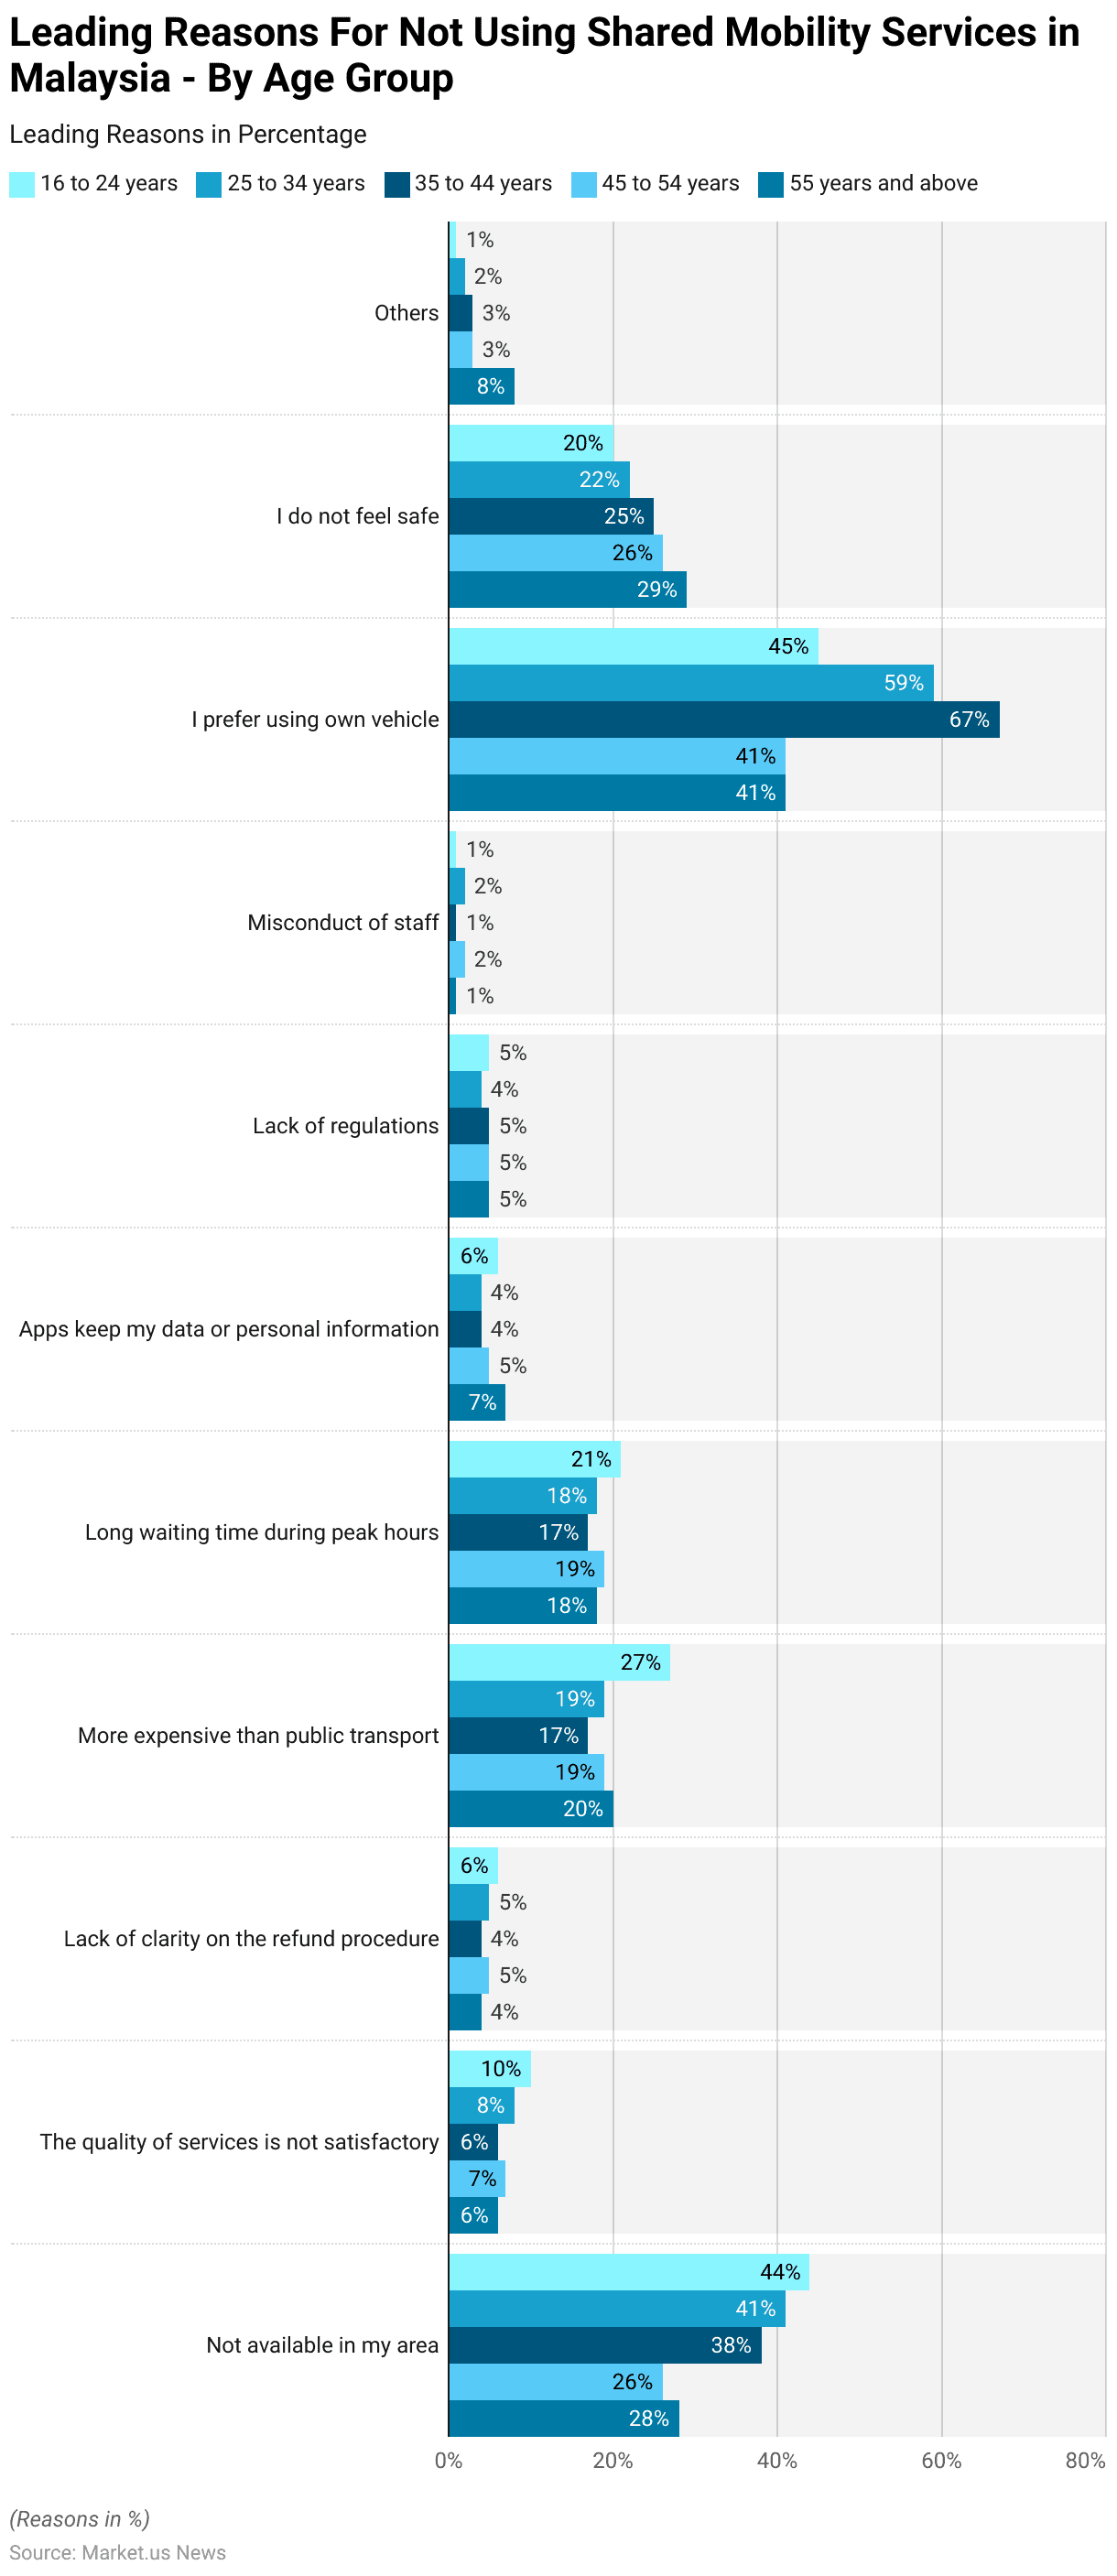
Leading Reasons for Not Using Shared Mobility Services – By Age Group Statistics
- As of March 2024, the leading reasons for not using shared mobility services in Malaysia differ across age groups.
- A major factor is the unavailability of services in certain areas, with 44% of 16-24 years, 41% of 25-34 years, and 38% of 35-44 years reporting this issue, though it decreases to 26% for 45-54 years and slightly rises to 28% for 55+ years. The quality of services was cited as unsatisfactory by 10% of 16-24 years, declining to 8% for 25-34 years and 6-7% for older groups.
- The lack of clarity on refund procedures was a minor concern across all age groups, reported by 4-6%. Costs remain a significant barrier, with 27% of 16-24-year-olds finding shared mobility more expensive than public transport, decreasing to 17-20% for other age groups.
- Long waiting times during peak hours were mentioned consistently, with 21% for 16-24 years, 18% for 25-34 years, and 17-19% across older demographics.
- Concerns about data privacy affected 6% of 16-24 years and increased slightly to 7% for 55+ years, while lack of regulations was cited by 4-5% across all age groups. Instances of staff misconduct were minimal, reported by only 1-2%.
- A significant proportion of users prefer their vehicles, with this reason increasing with age: 45% for 16-24 years, 59% for 25-34 years, and peaking at 67% for 35-44 years, before dropping to 41% for 45-54 years and 55+ years.
- Safety concerns are more prominent among older users, rising from 20% for 16-24 years to 29% for 55+ years.
- Finally, ‘Other’ reasons were reported by 1-3% of younger groups but increased to 8% for 55+ years. This data highlights generational differences, with younger groups facing availability and cost barriers, while older users prioritize safety and prefer personal vehicles.
(Source: Statista)
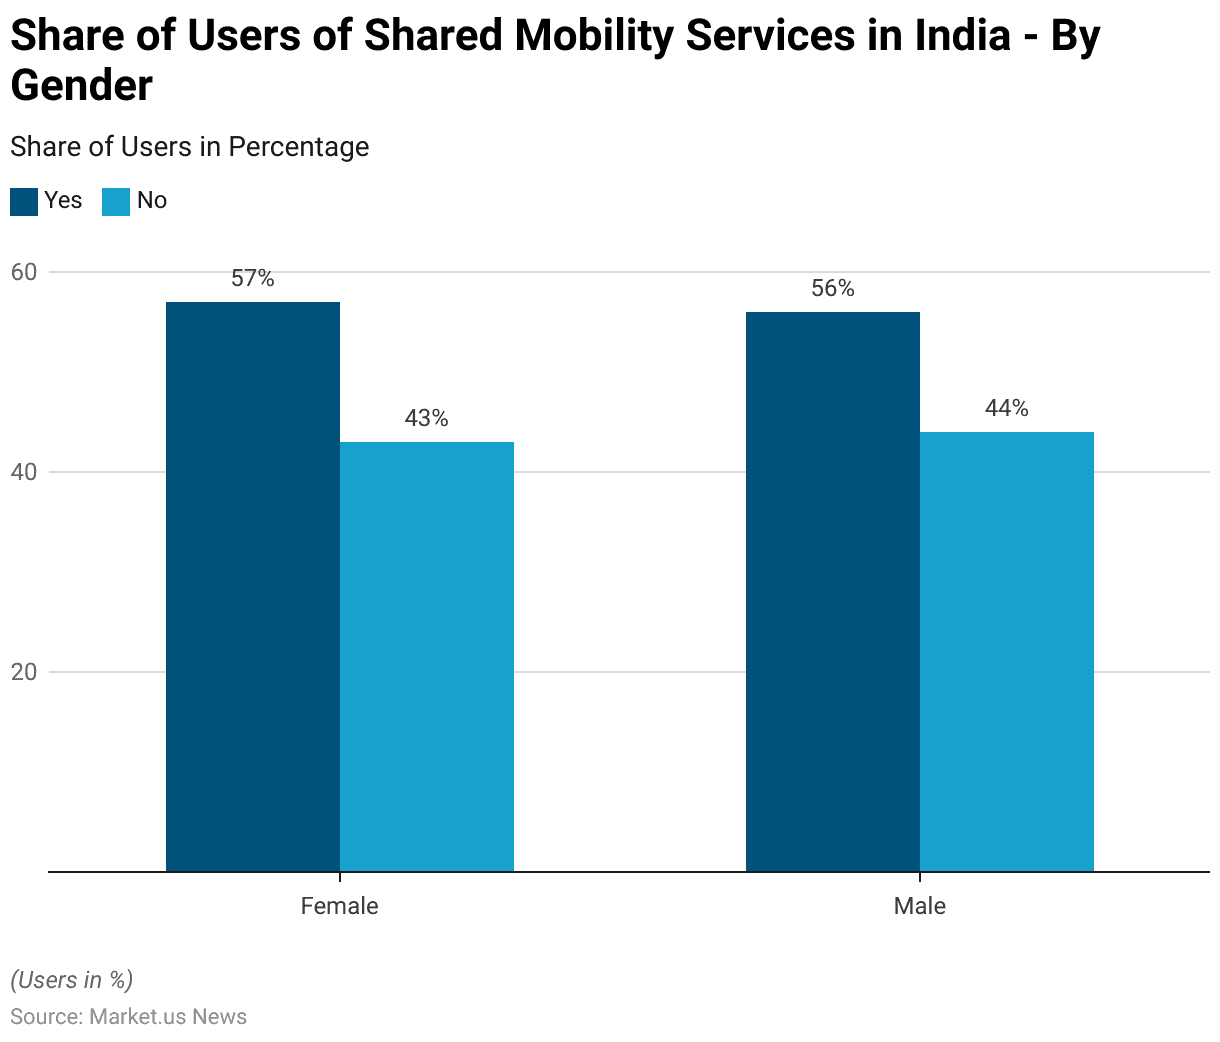
Users of Shared Mobility Services – By Gender Statistics
- As of March 2024, the share of users of shared mobility services in India shows a slight gender-based variation.
- Among females, 57% reported using shared mobility services, while 43% indicated they do not use these services.
- Similarly, among males, 56% are users of shared mobility services, while 44% do not use them.
- This data highlights nearly equal adoption rates of shared mobility services among both genders in India, with females showing a marginally higher participation rate.
(Source: Statista)
Leading Reasons for Using Shared Mobility Services – By Gender Statistics
- As of March 2024, the leading reasons for using shared mobility services in Thailand vary slightly between genders.
- For both males and females, the most cited reason is convenience and reliability, with 62% of males and 63% of females agreeing.
- The ease of using ride-sharing or hailing apps was reported by 26% of males and 29% of females. Cashless payments were valued by 21% of males and 22% of females, while fare transparency was cited by 19% of males and 17% of females.
- The perception of shared mobility being cheaper than other alternatives was higher among males at 28% compared to 25% for females. Late-hour availability was noted by 15% of males and 16% of females. Using the service as a good option for traveling after alcohol consumption was more common among males (14%) than females (10%).
- Additional reasons include the ability to verify drivers (reported by 7% of males and 6% of females) and the display of trip details (noted by 11% of males and 10% of females). Environmental sustainability had lower recognition, with 6% of males and 4% of females citing it.
- Notably, 22% of females reported not having a car, compared to 14% of males, while 5% of females said they do not know how to drive, compared to only 2% of males. Finally, 1% of respondents from both genders mentioned “Other” reasons.
- This data highlights that while convenience drives shared mobility adoption for both genders, practical factors such as car ownership and driving ability play a larger role among females.
(Source: Statista)
Frequency of Using Shared Mobility Services – By Gender Statistics
- As of March 2024, the frequency of using shared mobility services in Thailand shows slight variations between males and females.
- Daily usage was reported by 17% of males and 18% of females, indicating similar adoption for regular use.
- 2-5 times per week usage was equal across both genders at 21%, reflecting consistent mid-level frequency.
- However, the proportion of users relying on services once per week was notably higher for males at 19%, compared to 13% for females.
- For less frequent usage, 2-5 times per month was consistent for both genders at 7%, while using shared mobility once per month was reported by 11% of males and slightly less at 9% of females.
- Occasional use was higher among females, with 30% reporting this frequency compared to 24% of males, indicating females prefer more irregular or need-based use.
- Finally, 2% of both males and females reported that they never use shared mobility services.
- This data highlights that while males and females have comparable daily and weekly usage rates, females are more likely to use these services occasionally. In contrast, males tend to display slightly higher weekly reliance.
(Source: Statista)
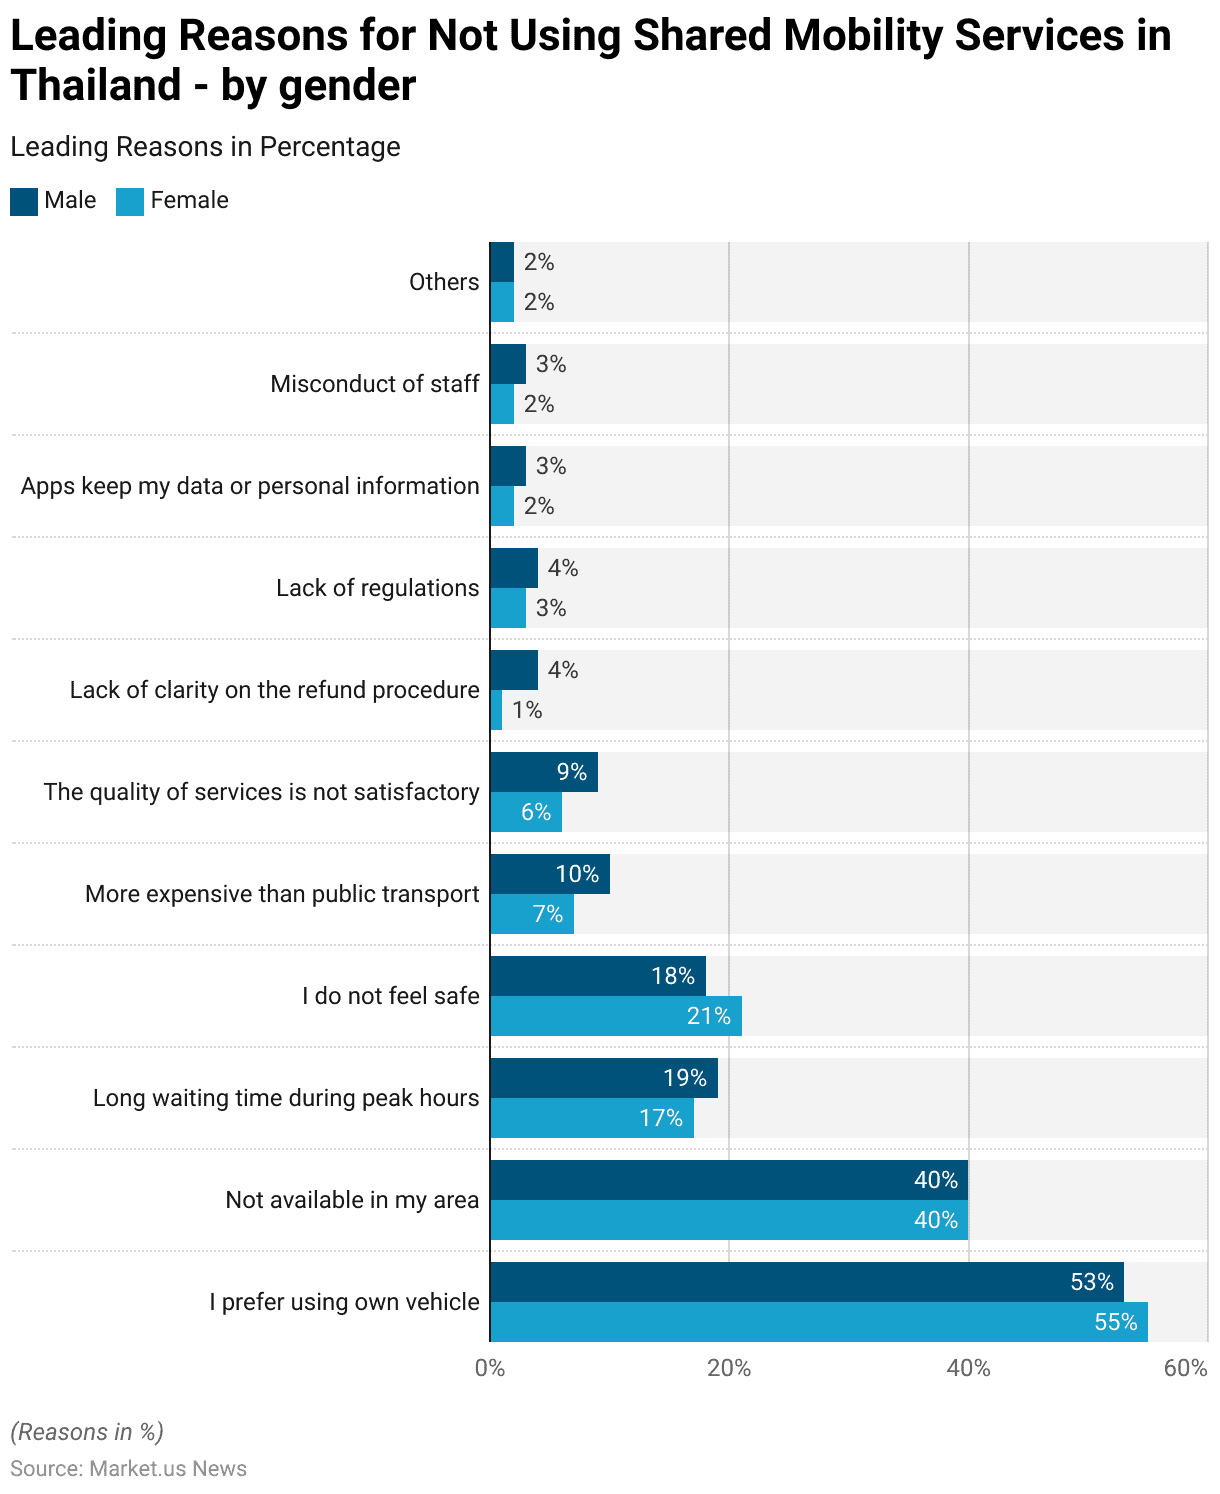
Leading Reasons for Not Using Shared Mobility Services – By Gender Statistics
- As of March 2024, the leading reasons for not using shared mobility services in Thailand differ slightly between genders.
- The primary reason for both males and females is a preference for using their vehicles, cited by 53% of males and 55% of females. The unavailability of services in certain areas affects both genders equally, with 40% reporting this as a barrier.
- Long waiting times during peak hours were noted by 19% of males and 17% of females, while feeling unsafe was a bigger concern for females (21%) compared to males (18%).
- Higher costs compared to public transport were cited by 10% of males and 7% of females, while the quality of services being unsatisfactory was mentioned by 9% of males and 6% of females.
- Other concerns included the lack of clarity on refund procedures, reported by 4% of males but only 1% of females, and lack of regulations, cited by 4% of males and 3% of females.
- Concerns about data privacy were raised by 3% of males and 2% of females, while misconduct of staff was mentioned by 3% of males and 2% of females. Finally, 2% of both genders mentioned “Other” reasons.
- This data highlights that while personal vehicle preference and unavailability of services dominate the reasons for non-usage, safety and service quality concerns are more pronounced among females. In contrast, males express slightly higher concerns about costs and refunds.
(Source: Statista)
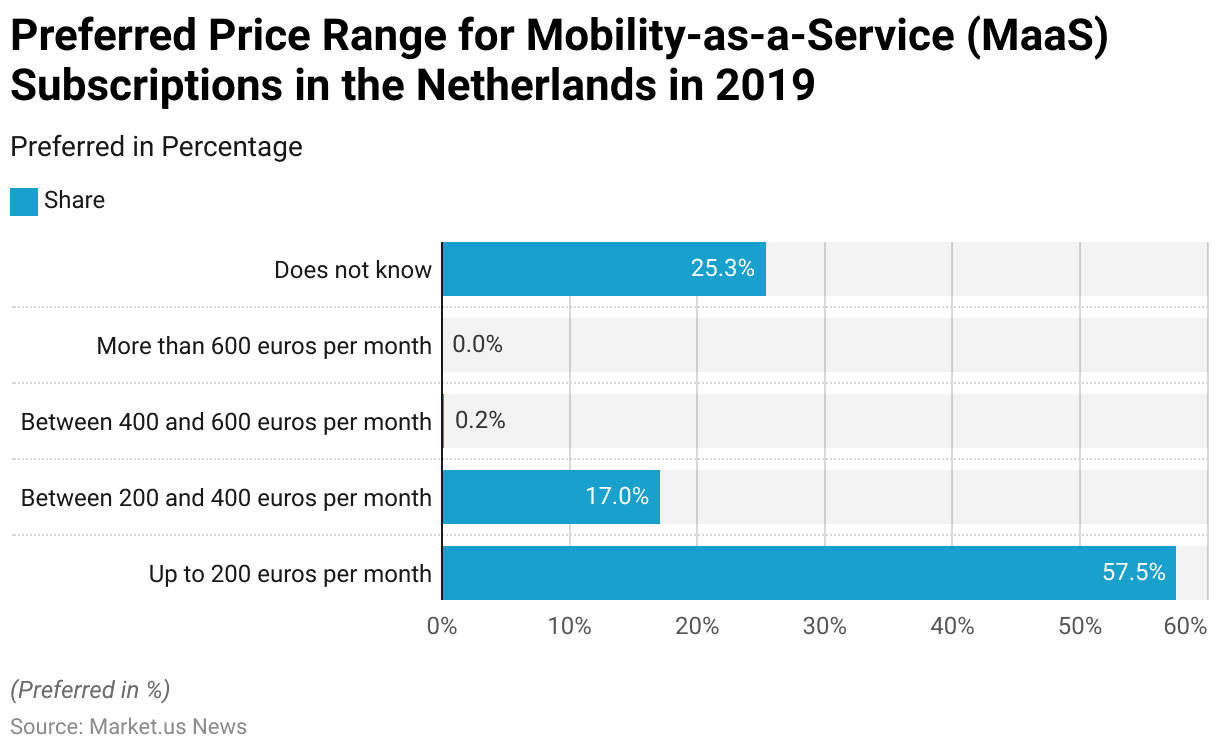
- In 2019, the preferred price range for Mobility-as-a-Service (MaaS) subscriptions in the Netherlands varied significantly among respondents.
- A majority, accounting for 57.5%, preferred a price of up to 200 euros per month, reflecting a clear inclination toward affordable options.
- A smaller segment, 17.0%, indicated a willingness to pay between 200 and 400 euros per month.
- Only a negligible 0.2% of respondents** were open to paying between 400 and 600 euros per month, and none (0.0%) expressed interest in subscriptions costing more than 600 euros per month.
- Additionally, 25.3% of respondents indicated that they did not know their preferred price range.
- This data highlights a strong preference for lower-cost MaaS subscriptions, emphasizing affordability as a key factor for adoption in the Dutch market.
(Source: Statista)
Opposition and Challenges
- In 2024, the leading reasons against the use of shared mobility services in Asia varied across countries and territories, with key factors being cost, service availability, and safety concerns.
- In Hong Kong, the most important reason cited was that shared mobility services are more expensive than public transport (36%), followed by unavailability in their area (26%) and feeling unsafe (24%).
- In Indonesia, the primary concern was the unavailability of services (54%), while preference for using their vehicle (44%) and safety concerns (18%) followed.
- In India, 40% reported service unavailability as the most significant barrier, followed by a preference for using their vehicle (27%) and feeling unsafe (17%).
- Similarly, in Japan, 40% preferred using their vehicle, with 39% citing unavailability of services and 12% noting that services were more expensive than public transport. In South Korea, the leading reason was preference for using their vehicle (42%), followed by safety concerns (31%) and cost-related issues (23%).
- In Malaysia, the preference for using their vehicle (61%) dominated, followed by service unavailability (38%) and safety concerns (22%). In the Philippines, the unavailability of services was the top concern at 48%, while 33% preferred their vehicles, and 30% found shared mobility more expensive than public transport.
More Insights
- For Singapore, cost emerged as the primary issue, with 31% stating shared mobility is more expensive than public transport, followed by 28% preferring their vehicles and 23% citing safety concerns.
- In Thailand, the majority (54%) preferred using their vehicles, followed by 40% experiencing service unavailability and 20% raising safety concerns.
- Taiwan showed similar trends, with 54% preferring their vehicles, while 23% cited unavailability of services, and 21% found the services too expensive.
- Lastly, in Vietnam, 50% reported that shared mobility was not available in their area, followed by 47% preferring their vehicles, and 23% raising safety concerns.
- This data highlights regional variations in barriers to shared mobility adoption, with service availability being a dominant issue in countries like Indonesia, India, and Vietnam. At the same time, cost and safety concerns are notable in regions like Hong Kong, Singapore, and South Korea.
(Source: Statista)
- The landscape of regulations for shared mobility services varies significantly across different countries, reflecting a dynamic interplay between emerging technologies and the regulatory frameworks developed to manage their deployment.
- For instance, Europe has been proactive in setting guidelines, especially for micro-mobility solutions like e-scooters and e-bikes, often reacting to the rapid proliferation of these services to address urban transport challenges and sustainability goals.
- Notably, European cities have implemented various measures ranging from urban space allocation to setting vehicle requirements and shaping user behavior to ensure safety, order, and environmental compatibility.
- In the U.S., the approach has been somewhat fragmented, with city and state-level regulations that vary widely, focusing on aspects like vehicle safety standards, operation zones, and data-sharing requirements between operators and city authorities. This reflects a broader trend where local conditions and public sentiment heavily influence regulatory outcomes.
- Similarly, Asia shows a mixed regulatory response, with some cities embracing shared mobility as a core part of their public transport strategy, while others have imposed strict controls or bans to manage congestion and safety concerns.
- Global market leaders in shared mobility are increasingly influencing regulatory discussions by showcasing the potential of technologies like autonomous vehicles and electric models, promising enhanced urban mobility solutions that could reduce reliance on personal vehicles and decrease urban congestion.
- In summary, the regulation of shared mobility services is a complex, evolving field that requires balancing innovation and public welfare, with significant variations across different regions and influenced heavily by local needs, technological advancements, and sustainability objectives.
(Source: EU Urban Mobility Observatory, McKinsey & Company, POLIS Network)
Conclusion
Shared Mobility Statistics – The shared mobility market is expanding globally, driven by urbanization, technological advancements, and demand for cost-effective, sustainable travel solutions.
While emerging markets in Asia-Pacific and Latin America are experiencing strong adoption, developed regions focus on sustainable options like carpooling and electric vehicles.
Key challenges include service unavailability, higher costs, safety concerns, and a preference for personal vehicles, particularly in markets like Japan and South Korea.
Addressing issues such as data privacy and regulatory clarity will be crucial. Moving forward, digital infrastructure, innovative pricing models, and collaboration among stakeholders will drive shared mobility’s role in modern urban transportation.
FAQs
Shared mobility refers to transportation services and resources that are shared among users, including ride-hailing, car-sharing, bike-sharing, scooter-sharing, and public transportation.
Shared mobility offers cost savings, reduces traffic congestion, lowers carbon emissions, and provides convenient, flexible, and on-demand transportation options.
Asia-Pacific, particularly countries like China, India, and Vietnam, leads in adoption, followed by North America and Europe. Emerging markets in Latin America and Africa are also showing rapid growth.
Key challenges include service unavailability in some regions, higher costs compared to public transport, safety concerns, data privacy issues, and the preference for personal vehicles.
Yes, shared mobility helps reduce the number of vehicles on the road, lowers fuel consumption, and promotes sustainable transportation options like electric vehicles and bicycles.
Discuss your needs with our analyst
Please share your requirements with more details so our analyst can check if they can solve your problem(s)