

Table of Contents
- Introduction
- Editor’s Choice
- Microwave Oven Market Statistics
- Export and Import Statistics of Microwave Oven
- Owners of Microwaves in Different Countries Worldwide
- Price Statistics of Microwave Oven
- Microwave Oven Sales Trends Statistics
- Household Ownership of Microwave Ovens in Different Countries/Regions Statistics
- Consumer Preferences and Trends
- Expenditure on Microwave Oven Statistics
- Regulations for Microwave Ovens
- Recent Developments
- Conclusion
- FAQs
Introduction
Microwave Oven Statistics: A microwave oven uses microwave radiation to heat and cook food quickly. The appliance generates electromagnetic waves (around 2.45 GHz) through a component called a magnetron, which causes water molecules in the food to vibrate and generate heat.
Many microwaves have a rotating turntable or fan to ensure even cooking. There are different types of microwave ovens: solo models for reheating and basic cooking. Grill microwaves that can also grill food, and convection microwaves that combine microwave cooking with traditional oven features for baking and roasting.
Editor’s Choice
- The global microwave oven market size is projected to reach USD 10.89 billion by 2027.
- The competitive landscape of the global microwave oven market in 2022 showcases a diverse range of players, with Samsung leading the market with an 11% share.
- In 2022, China led global microwave oven exports with USD 3.82 billion. Representing 70.30% of the market.
- In 2022, the global microwave oven imports market was dominated by the United States. Which recorded an import value of USD 1.63 billion, accounting for 30% of the total imports.
- As of February 2024, microwave ownership varies across 56 countries, with Portugal leading at 93%.
- In the United States, brand preferences for microwave ovens in 2016 varied by age group, with GE leading at 15.3% among 18-34-year-olds.
- In the European Union, microwave ovens are regulated under the Low Voltage Directive (LVD). Which mandates strict safety standards, including radiation leakage limits and safe design requirements.

Microwave Oven Market Statistics
Global Microwave Oven Market Size Statistics
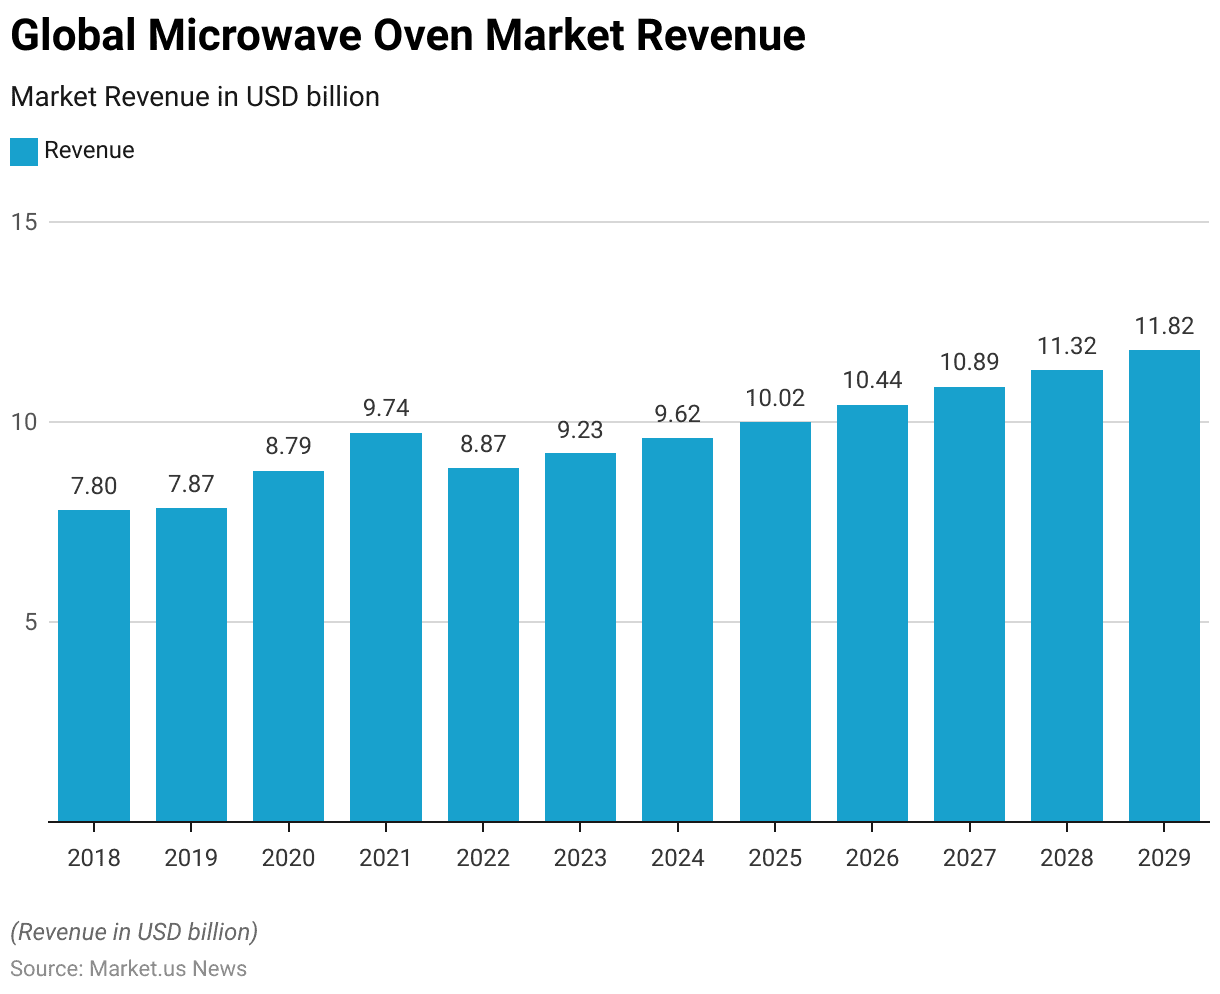
- The global microwave oven market has demonstrated notable growth over the years at a CAGR of 4.2%, with revenue figures reflecting consistent increases across most years.
- In 2018, the market revenue stood at USD 7.80 billion, rising slightly to USD 7.87 billion in 2019.
- By 2020, the market experienced significant growth, reaching USD 8.79 billion, followed by a notable increase to USD 9.74 billion in 2021.
- However, the revenue in 2022 slightly dipped to USD 8.87 billion before regaining momentum, rising to USD 9.23 billion in 2023.
- The upward trend is expected to continue, with projected revenues of USD 9.62 billion in 2024 and crossing the USD 10 billion mark to reach USD 10.02 billion in 2025.
- By 2026, the market size is anticipated to further expand to USD 10.44 billion, growing to USD 10.89 billion in 2027.
- This growth trajectory persists, with forecasts of USD 11.32 billion in 2028 and USD 11.82 billion in 2019 (possibly reflecting an updated or secondary analysis for the year).
- Further, these figures illustrate the increasing demand for microwave ovens globally, driven by advancements in technology, evolving consumer lifestyles, and the growing popularity of convenient home appliances. Despite minor fluctuations, the market continues to show a strong growth trajectory in the coming years.
(Source: Statista)
Global Microwave Oven Market Revenue Change Statistics
- The global microwave oven market revenue change percentage has fluctuated over the years, highlighting varying growth rates.
- In 2019, the market saw a modest increase of 1.0%.
- The growth accelerated significantly in 2020, with a notable rise of 11.7%.
- In 2021, the market continued to grow robustly, recording a 10.8% increase.
- However, 2022 experienced a decline, with market revenue shrinking by -9.0%, marking a rare dip in the otherwise upward trajectory.
- The market rebounded in 2023 with a 4.2% increase, showing signs of recovery.
- This steady growth is expected to continue in the following years, with a 4.1% rise projected for 2024 and a slightly higher growth rate of 4.3% in 2025.
- In 2026 and 2028, the market is anticipated to grow at a consistent rate of 4.2%, while 2027 is expected to match the 2025 growth rate of 4.3%.
- Interestingly, the data for 2019 also reflects a repeat growth rate of 4.2%, potentially indicating a secondary or updated analysis for that year.
- The consistent recovery and projected growth rates reflect the resilience and adaptability of the market in the face of challenges.
(Source: Statista)
Microwave Oven Market Share – By Sales Channel Statistics
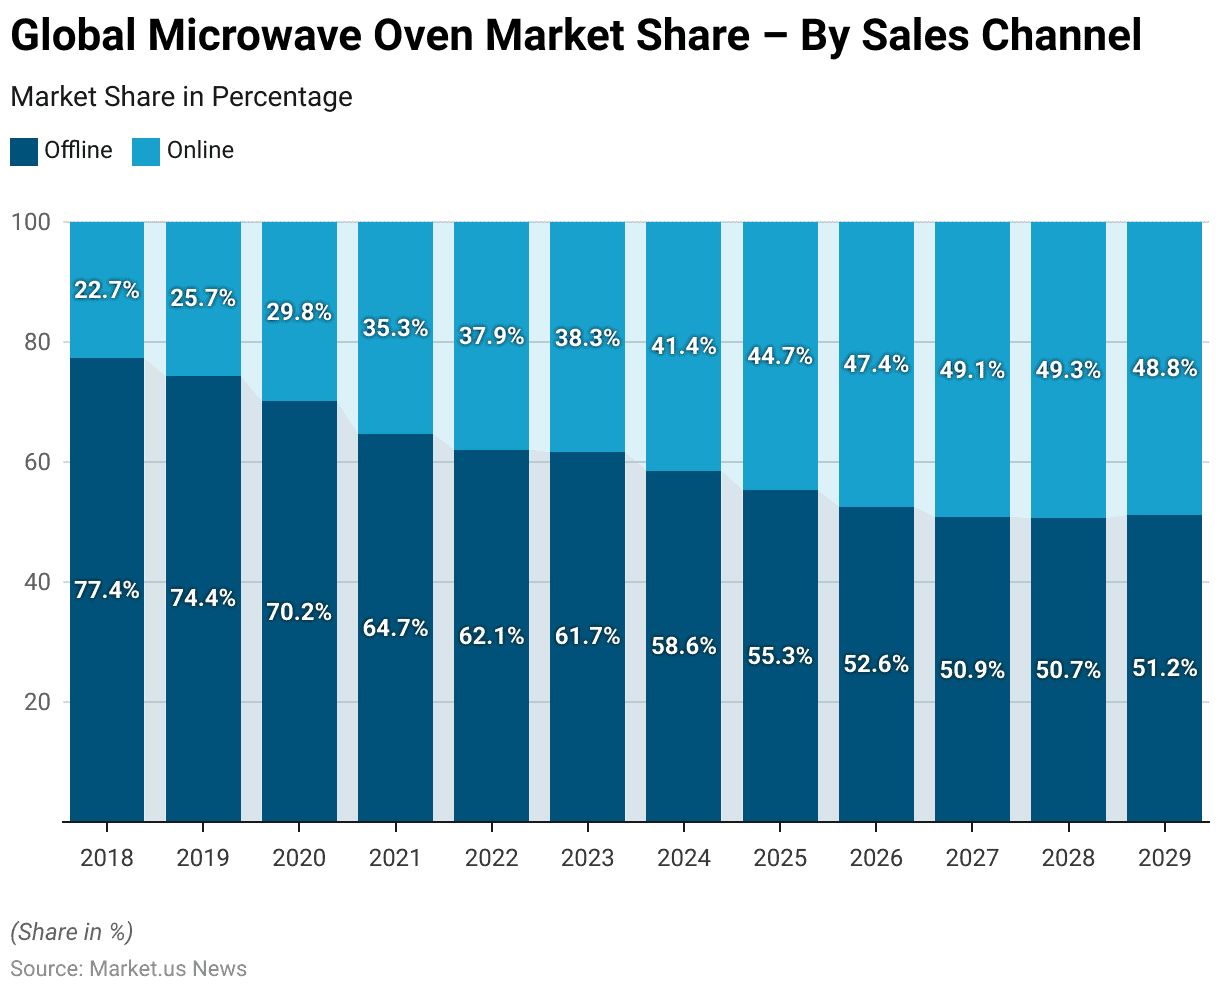
- The global microwave oven market has exhibited a significant shift in sales channel preferences over the years, reflecting a growing trend toward online purchases.
- In 2018, offline sales dominated with 77.4%, while online sales accounted for 22.7%. By 2019, offline sales slightly decreased to 74.4%, with online sales rising to 25.7%. This trend continued in 2020, as offline sales dropped further to 70.2%, and online sales grew to 29.8%.
- The shift became more pronounced in 2021, with offline sales declining to 64.7% and online sales increasing to 35.3%. In 2022, offline sales fell to 62.1%, while online sales reached 37.9%.
- By 2023, the gap narrowed even further, with offline sales at 61.7% and online sales at 38.3%. The projection for 2024 indicates that offline sales will constitute 58.6%, while online sales will surpass 41.4%.
- This trend continues, with offline sales expected to decline to 55.3% in 2025 and further to 52.6% in 2026, while online sales rise to 44.7% and 47.4%, respectively. By 2027, offline sales are anticipated to drop below 51% to 50.9%, while online sales increase to 49.1%. In 2028, the market share for offline sales will stabilize at 50.7%, with online sales slightly surpassing 49.3%.
- Notably, a secondary data point for 2019 reflects offline sales at 51.2% and online sales at 48.8%, indicating a significant alignment with the broader trend of increasing online dominance.
- This data highlights the evolving consumer behavior driven by the convenience of online shopping and technological advancements in e-commerce platforms.
(Source: Statista)
Competitive Landscape of Global Microwave Oven Market Statistics
- The competitive landscape of the global microwave oven market in 2022 showcases a diverse range of players, with Samsung leading the market with an 11% share.
- GE and Sharp each hold 7% of the market, followed by Panasonic with 6%.
- Toshiba and Whirlpool maintain a 5% share each, while LG accounts for 4% of the market.
- Smaller players such as Bosch, Candy, and Frigidaire each contribute 2% to the market.
- A significant portion of the market, 49%, is occupied by other companies, reflecting the fragmented nature of the industry.
- This distribution highlights the dominance of key brands while also showcasing the competitive opportunities for other players within the market.
(Source: Statista)
Global Microwave Oven Market Revenue – By Country Statistics
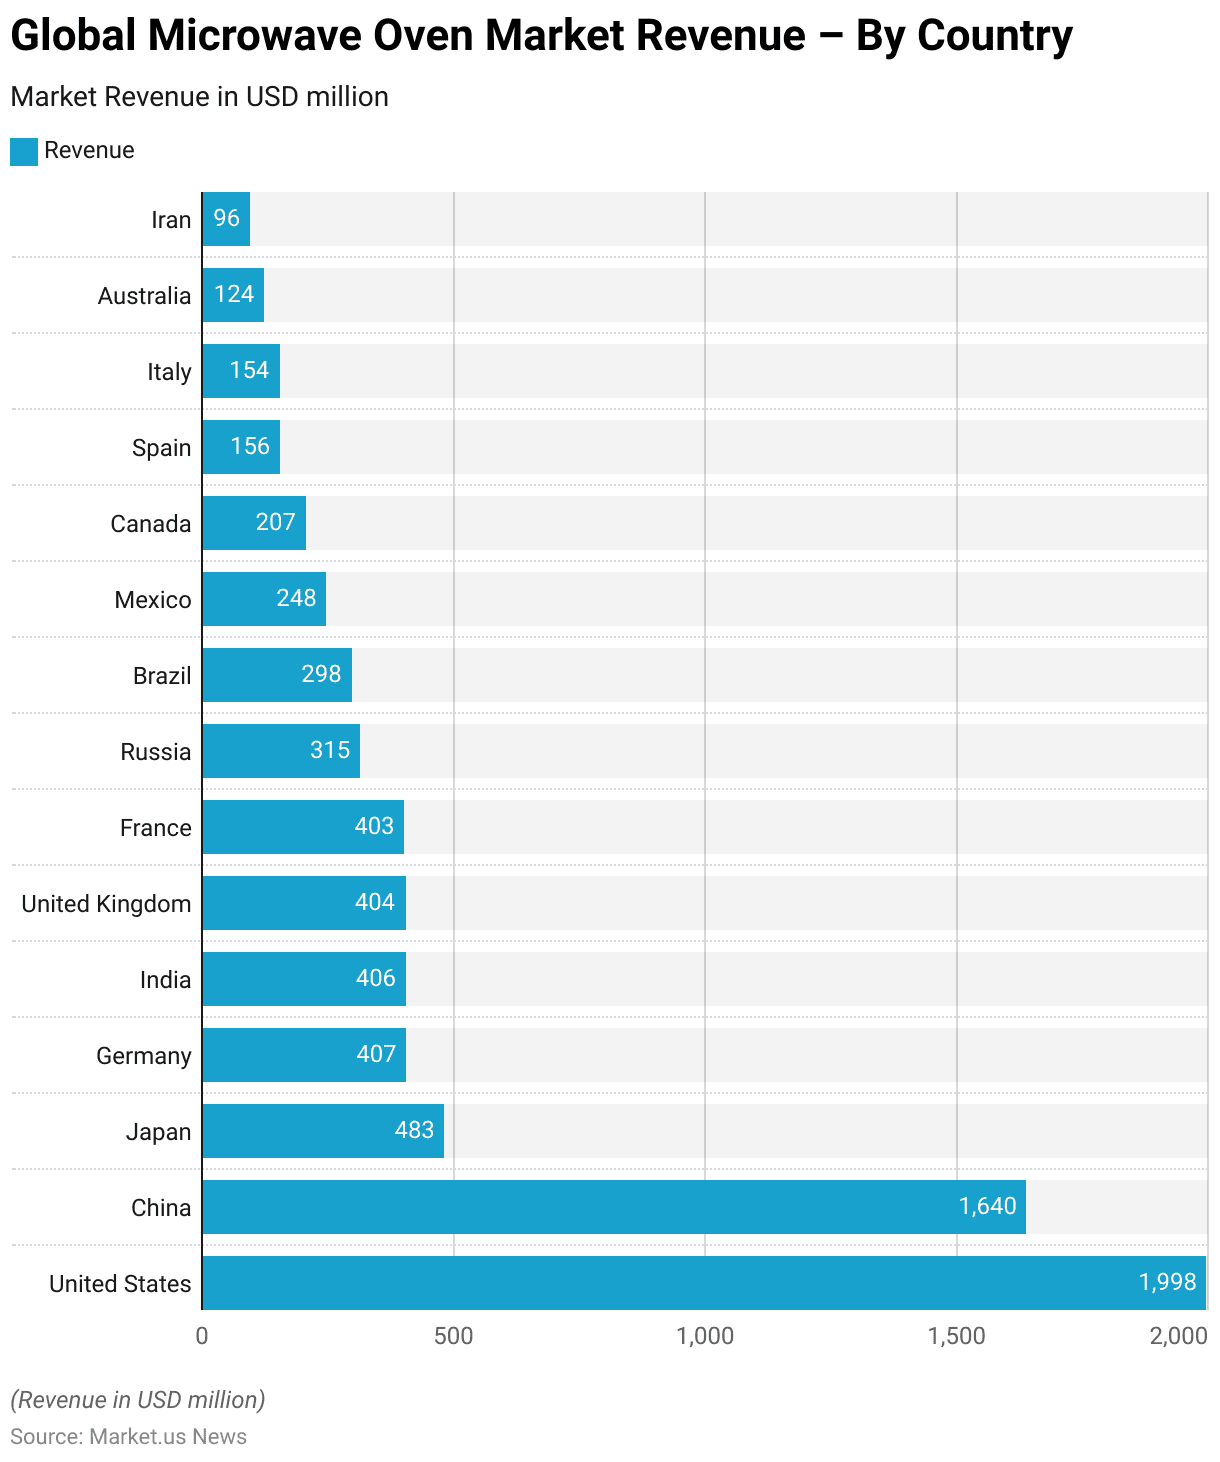
- In 2024, the global microwave oven market revenue by country highlights significant contributions from leading nations.
- The United States leads the market with a revenue of USD 1,998 million, followed by China at USD 1,640 million.
- Japan ranks third, generating USD 483 million, while Germany and India closely follow with USD 407 million and USD 406 million, respectively.
- The United Kingdom contributes USD 404 million, slightly ahead of France at USD 403 million.
- Russia’s revenue stands at USD 315 million, with Brazil generating USD 298 million and Mexico contributing USD 248 million.
- Canada accounts for USD 207 million, while Spain and Italy report revenues of USD 156 million and USD 154 million, respectively.
- Australia follows with USD 124 million, and Iran concludes the list with USD 96 million.
- This distribution underscores the dominant presence of developed nations like the United States and China. At the same time, emerging economies like India and Brazil also play a substantial role in driving the global microwave oven market.
(Source: Statista)
Export and Import Statistics of Microwave Oven
Microwave Oven Exports – By Country Statistics
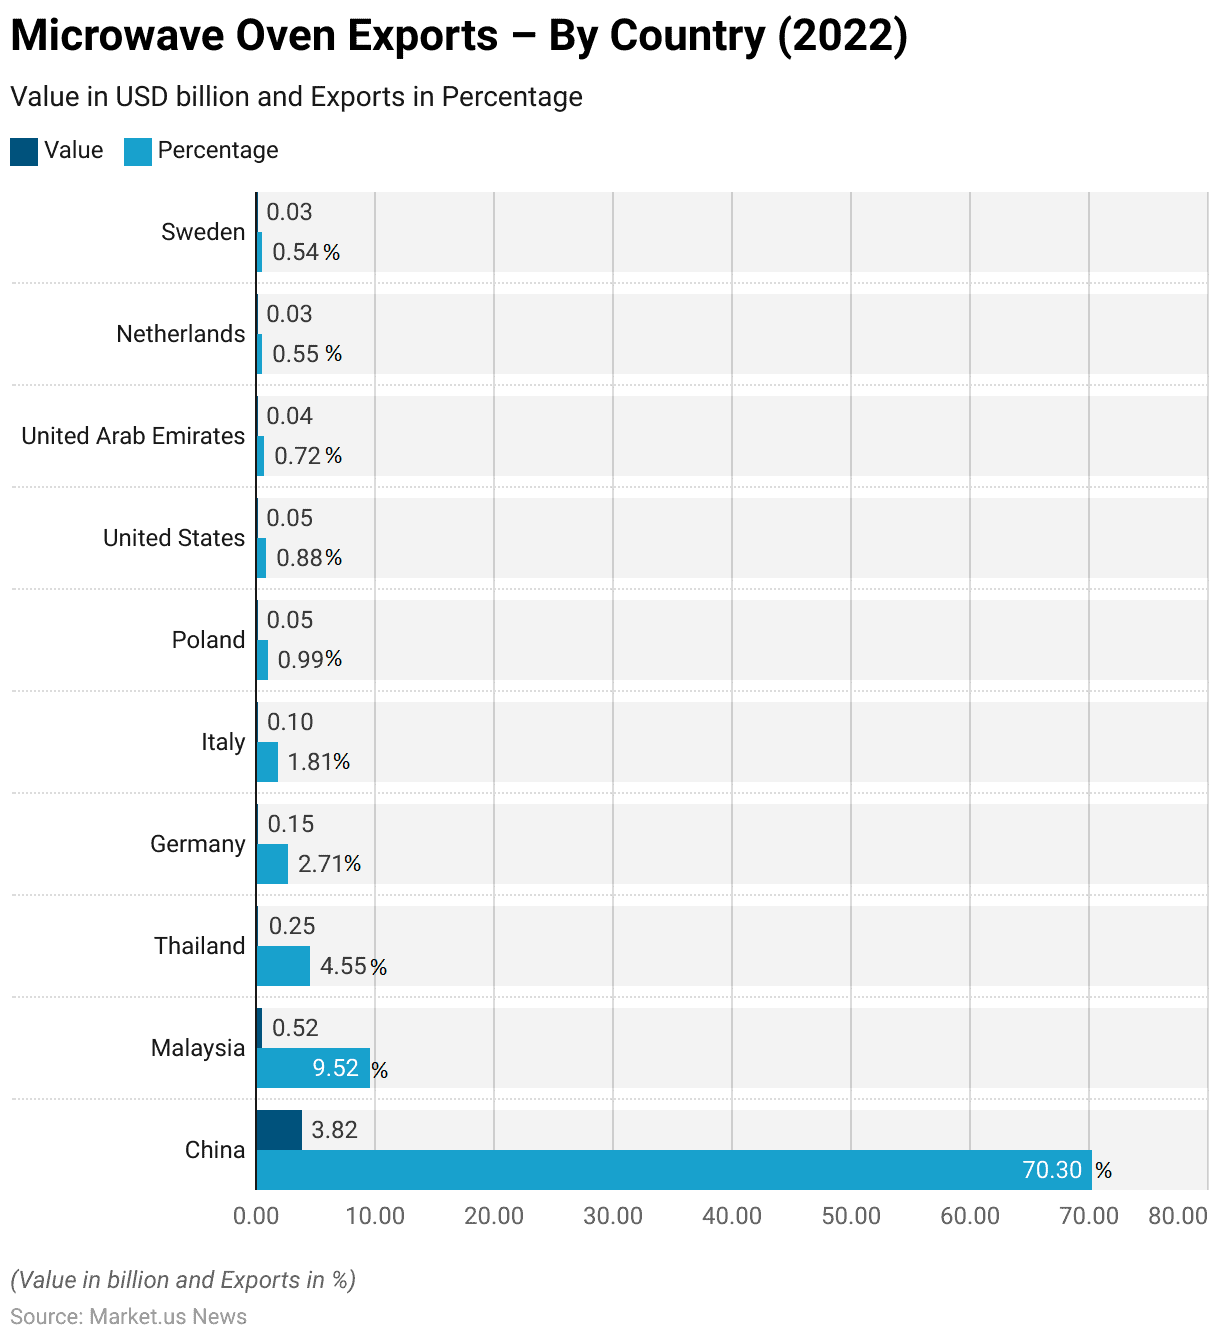
- In 2022, global microwave oven exports were led overwhelmingly by China, which accounted for an export value of USD 3.82 billion, representing 70.30% of the total market.
- Malaysia followed with an export value of USD 0.518 billion, contributing 9.52%, while Thailand held the third position with USD 0.247 billion, making up 4.55% of exports.
- Germany exported USD 0.147 billion, accounting for 2.71%, and Italy recorded an export value of USD 0.0983 billion, representing 1.81%.
- Poland contributed USD 0.0535 billion to global exports, capturing 0.99%, while the United States reported exports worth USD 0.0477 billion, equivalent to 0.88%.
- The United Arab Emirates followed with USD 0.0393 billion (0.72%), and the Netherlands exported USD 0.03 billion, contributing 0.55%.
- Sweden completed the list with USD 0.0292 billion in exports, representing 0.54% of the global market.
- These figures highlight China’s dominance in the global microwave oven export market, with other countries such as Malaysia, Thailand, and Germany making notable contributions, albeit on a much smaller scale.
(Source: OEC World)
Microwave Oven Imports – By Country Statistics
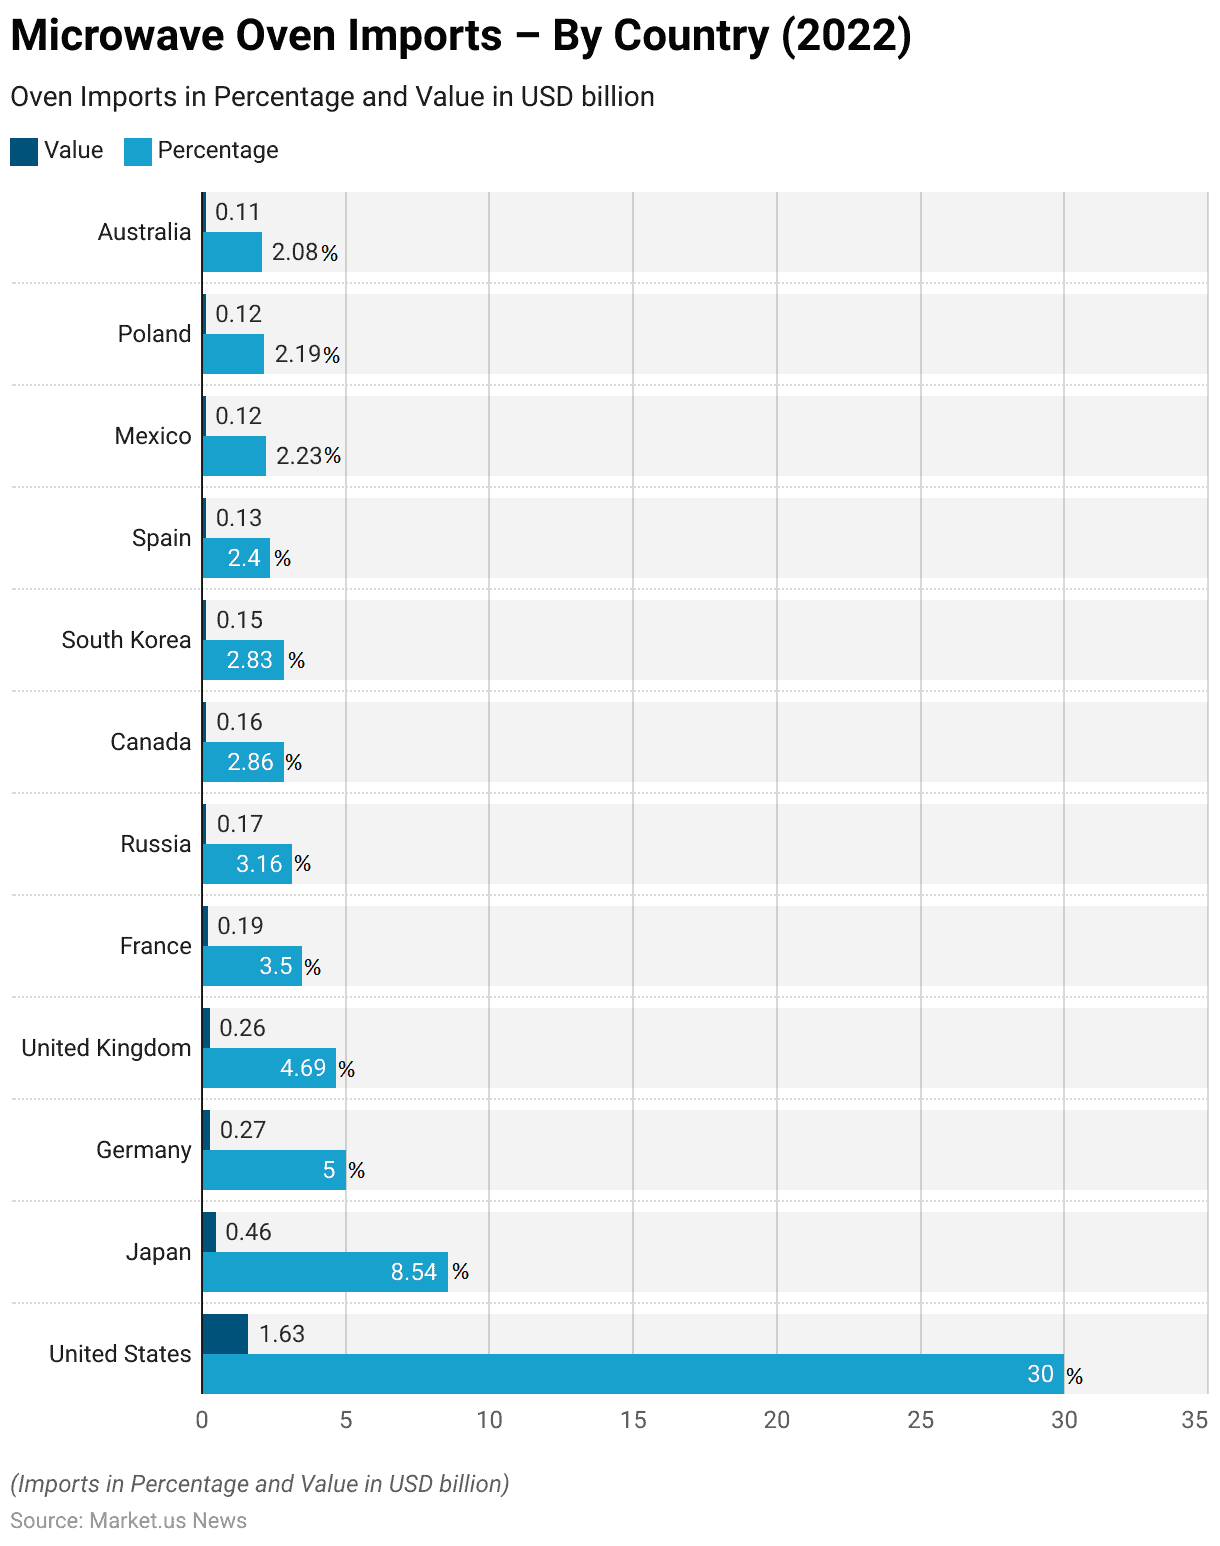
- In 2022, the global microwave oven imports market was dominated by the United States, which recorded an import value of USD 1.63 billion, accounting for 30% of the total imports.
- Japan ranked second with an import value of USD 0.464 billion, contributing 8.54% of the market.
- Germany followed with imports worth USD 0.272 billion, representing 5%.
- The United Kingdom held a share of 4.69% with an import value of USD 0.255 billion, while France contributed USD 0.190 billion, equating to 3.50%.
- Russia imported microwave ovens worth USD 0.172 billion, capturing 3.16% of the market.
- Canada and South Korea closely followed, with import values of USD 0.156 billion (2.86%) and USD 0.154 billion (2.83%), respectively.
- Spain accounted for USD 0.131 billion in imports, representing 2.40%, while Mexico contributed USD 0.121 billion (2.23%).
- Poland and Australia reported import values of USD 0.119 billion (2.19%) and USD 0.113 billion (2.08%), respectively.
- These figures underscore the significant demand for microwave ovens in developed markets like the United States, Japan, and Germany while highlighting steady contributions from emerging markets like Russia, Mexico, and Poland.
(Source: OEC World)
Owners of Microwaves in Different Countries Worldwide
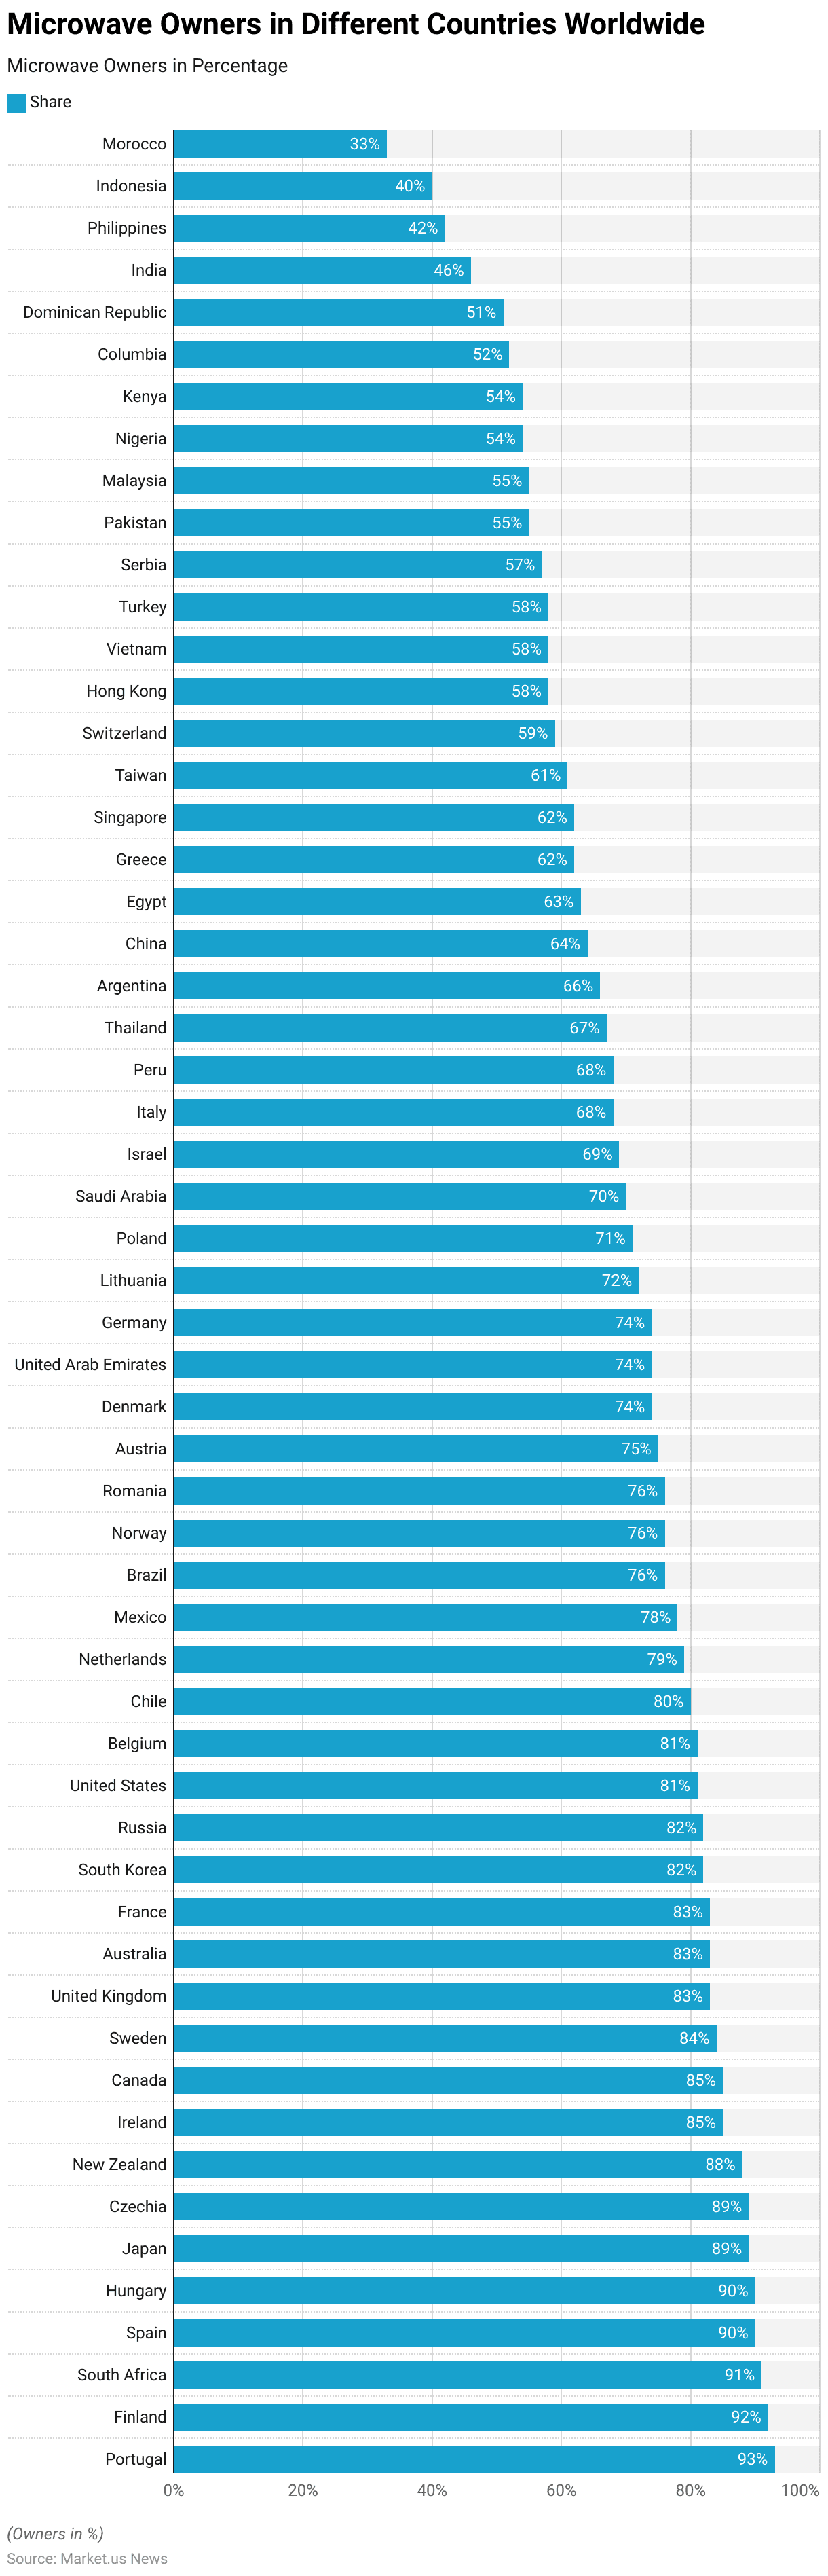
- As of February 2024, the share of microwave owners varied significantly across 56 countries and territories worldwide.
- Portugal leads with 93% of respondents owning a microwave, followed closely by Finland at 92% and South Africa at 91%.
- Spain and Hungary each reported ownership at 90%.
- Japan and Czechia both registered 89%, while New Zealand followed closely at 88%.
- Ireland and Canada each reported an ownership share of 85%, with Sweden at 84%.
- The United Kingdom, Australia, and France each saw 83%, while South Korea and Russia each stood at 82%.
- The United States and Belgium both had 81%, and Chile recorded 80%.
- The Netherlands reported 79%, Mexico 78%, and Brazil, Norway, and Romania each at 76%.
- Austria recorded 75%, while Denmark, the UAE, and Germany each reported 74%.
- Lithuania stood at 72%, Poland at 71%, and Saudi Arabia at 70%. Israel recorded 69%, Italy and Peru each 68%, and Thailand 67%.
- Argentina followed at 66%, China at 64%, and Egypt at 63%. Greece and Singapore each reported 62%, with Taiwan at 61%.
- Switzerland registered 59%, while Hong Kong, Vietnam, and Turkey each reported 58%.
- Serbia recorded 57%, Pakistan and Malaysia each at 55%, and Nigeria and Kenya each at 54%.
- Columbia reported 52%, the Dominican Republic 51%, India 46%, the Philippines 42%, Indonesia 40%, and Morocco 33%.
- This data highlights the penetration of microwave ovens globally, with high ownership in developed nations and lower shares in developing economies.
(Source: Statista)
Price Statistics of Microwave Oven
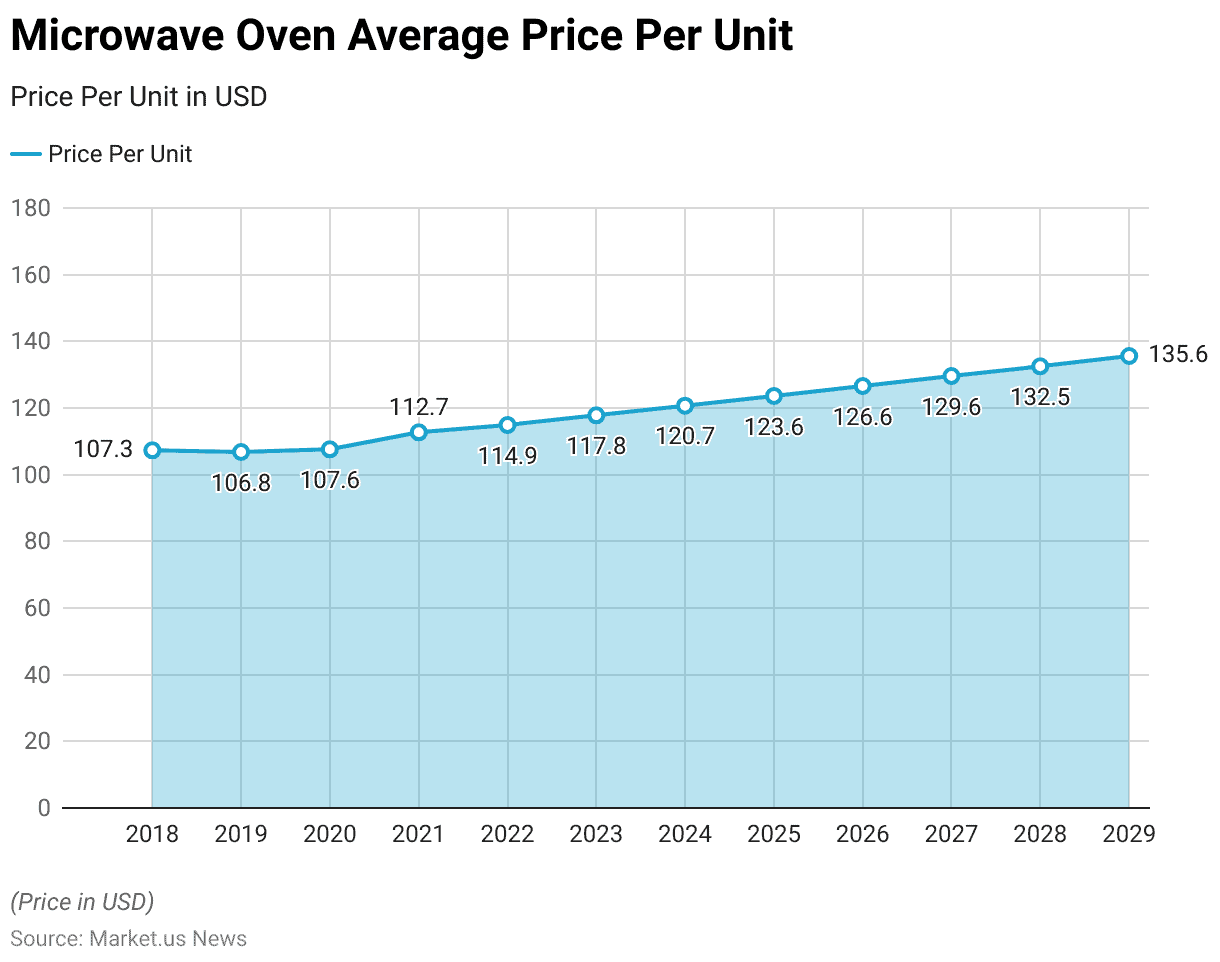
- Between 2018 and 2029, the average price per unit of microwave ovens has shown a steady increase, reflecting rising costs and potential advancements in technology and features.
- In 2018, the average price was USD 107.3, which slightly decreased to USD 106.8 in 2019.
- By 2020, the price had recovered to USD 107.6.
- A significant increase was observed in 2021, with the price reaching USD 112.7, followed by USD 114.9 in 2022.
- The upward trend continued, with the average price rising to USD 117.8 in 2023 and is expected to reach USD 120.7 in 2024.
- Further growth is projected, with the price estimated at USD 123.6 in 2025, USD 126.6 in 2026, and USD 129.6 in 2027.
- By 2028, the average price is forecasted to reach USD 132.5, culminating in USD 135.6 in 2029.
- This consistent price growth highlights the impact of inflation, increased demand, and enhancements in product quality and technology.
(Source: Statista)
Microwave Oven Sales Trends Statistics
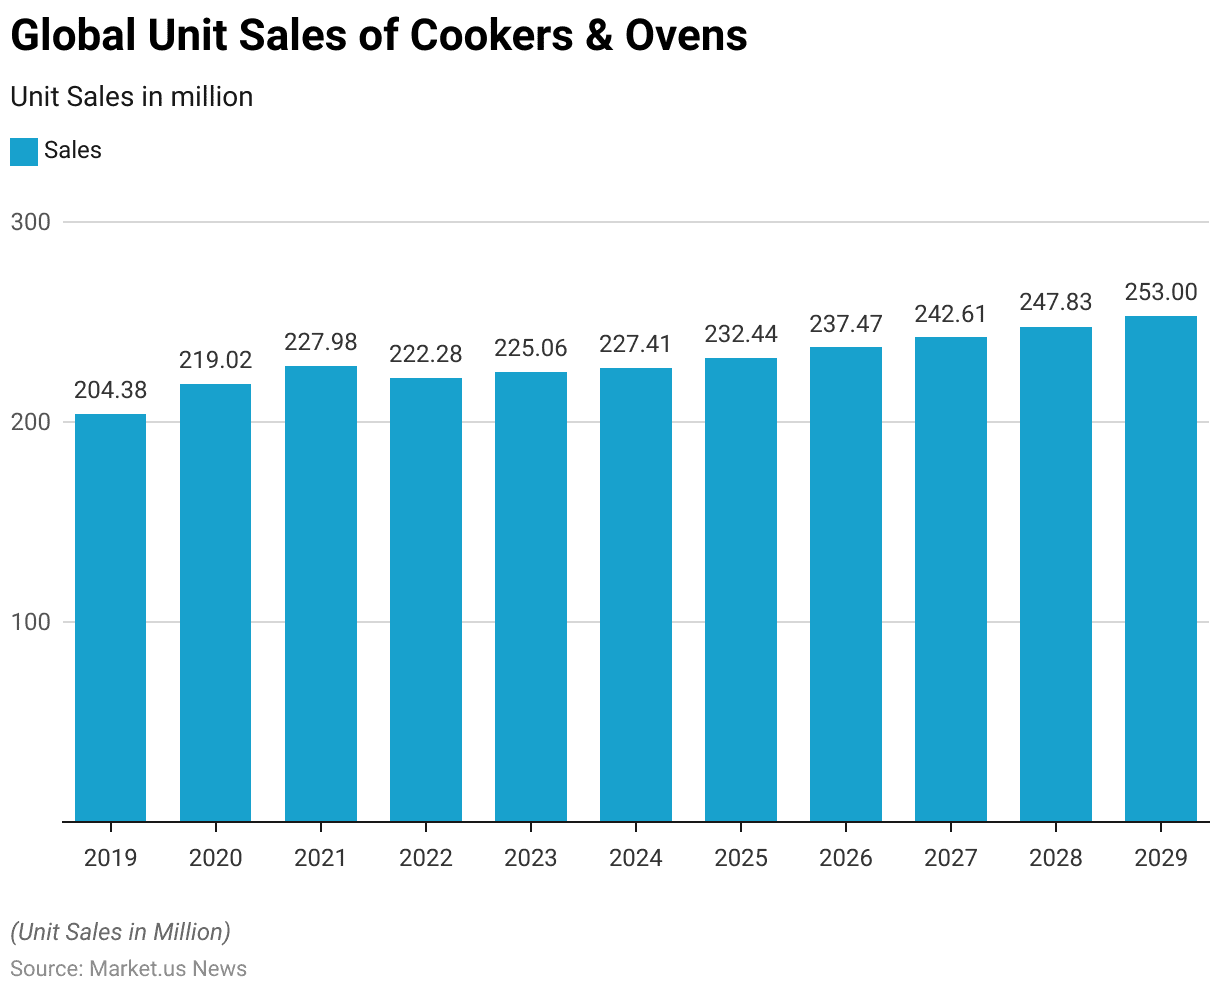
- The global unit sales of cookers and ovens have shown a consistent upward trend from 2019 to 2029, with fluctuations observed in certain years.
- In 2019, unit sales were recorded at 204.38 million, increasing to 219.02 million in 2020.
- By 2021, sales reached 227.98 million, marking significant growth. However, a slight dip occurred in 2022, with sales decreasing to 222.28 million.
- The market rebounded in 2023, achieving sales of 225.06 million units.
- Future projections indicate steady growth, with unit sales expected to rise to 227.41 million in 2024 and 232.44 million in 2025.
- The upward trajectory continues, with sales forecasted to reach 237.47 million in 2026, 242.61 million in 2027, and 247.83 million in 2028.
- By 2029, unit sales are projected to peak at 253 million units.
- This data highlights the increasing demand for cookers and ovens worldwide, driven by technological advancements, growing household needs, and rising disposable incomes.
(Source: Statista)
Household Ownership of Microwave Ovens in Different Countries/Regions Statistics
European Union
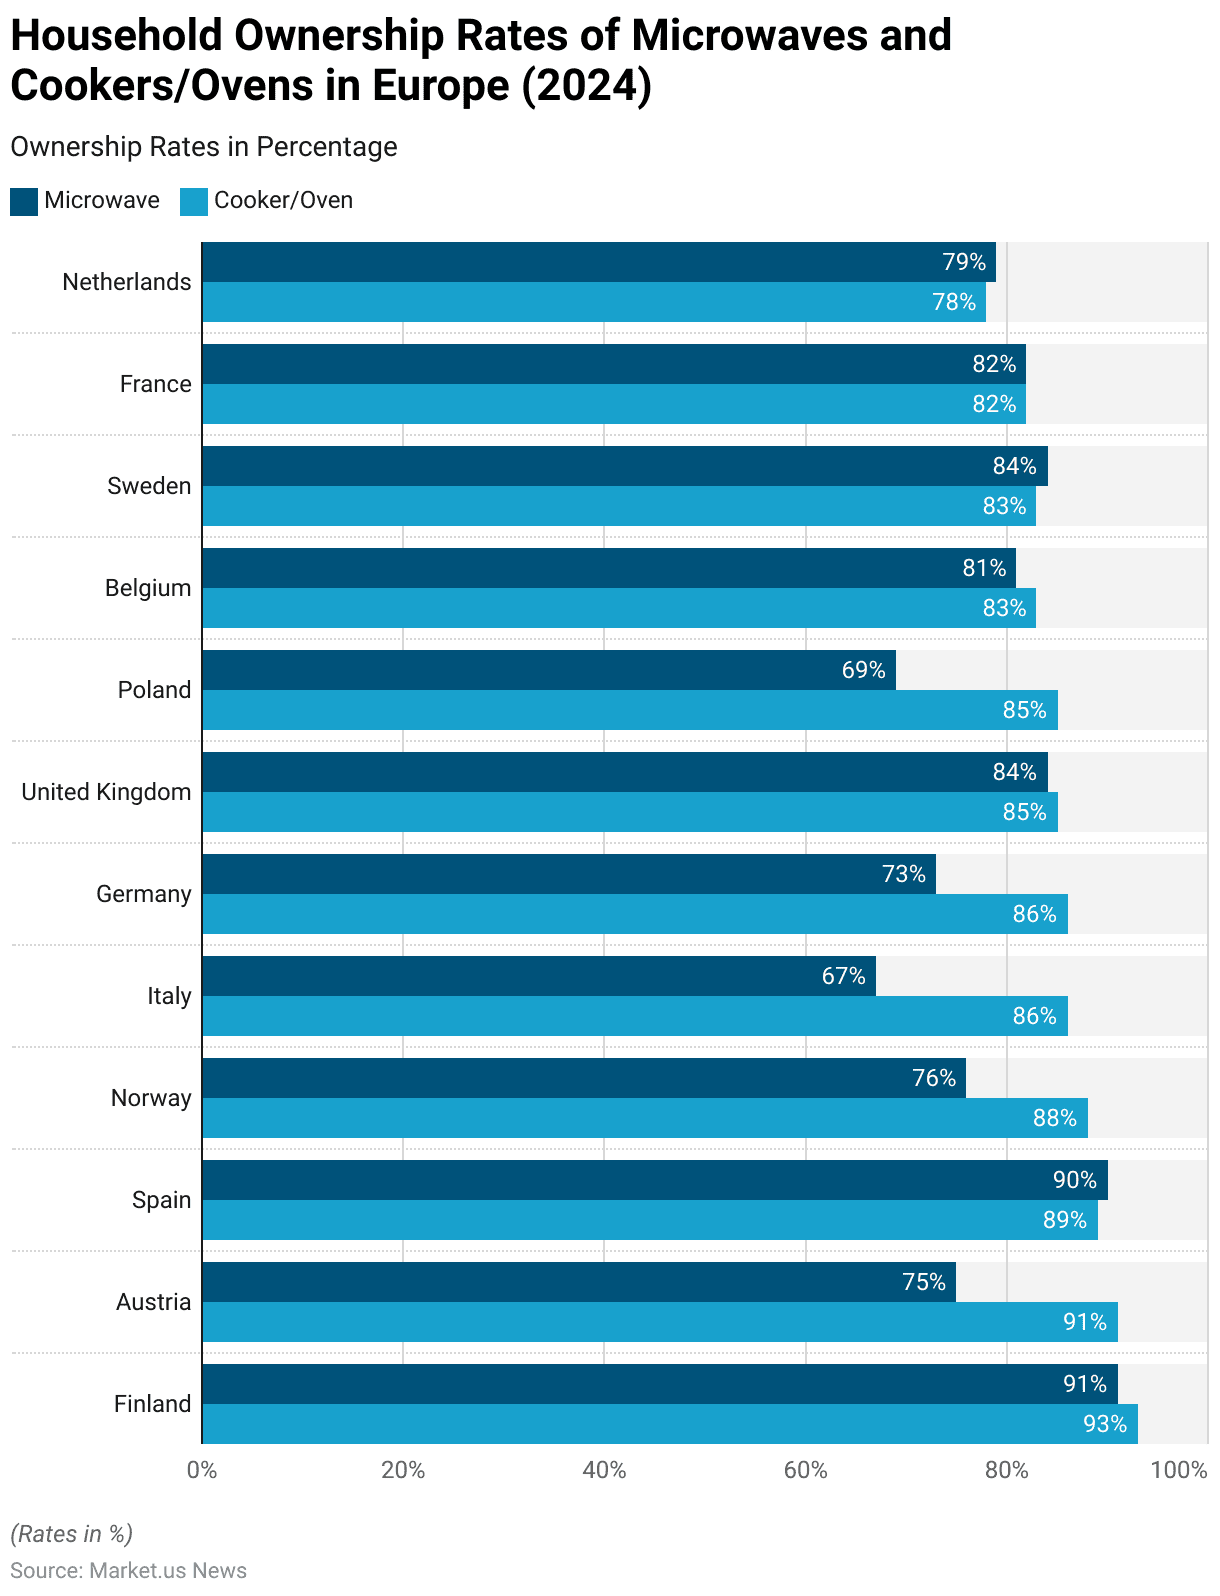
- In 2024, household ownership rates of microwaves and cookers/ovens in select European countries displayed notable variations.
- Finland reported the highest ownership, with 91% of households owning a microwave and 93% owning a cooker/oven. In Austria, microwave ownership stood at 75%, while cookers/ovens were present in 91% of households.
- Spain followed closely, with 90% microwave ownership and 89% for cookers/ovens. In Norway, microwaves were found in 76% of households, with cookers/ovens reaching 88% ownership.
- In Italy, microwave ownership lagged at 67%, while cookers/ovens were significantly higher at 86%. Similarly, Germany saw 73% microwave ownership compared to 86% for cookers/ovens.
- In the United Kingdom, 84% of households owned microwaves, with cookers/ovens at 85%. Poland reported 69% microwave ownership and 85% cooker/oven ownership.
- Belgium saw microwave ownership at 81% and cookers/ovens at 83%, while Sweden reported identical cooker/oven ownership at 83% but slightly higher microwave ownership at 84%. In France, both appliances were equally distributed at 82%.
- Lastly, the Netherlands recorded 79% microwave ownership and 78% for cookers/ovens, showing closer parity between the two appliances.
- This data highlights regional trends, with Nordic and Western European countries showing higher ownership rates overall, while Southern and Eastern Europe reported relatively lower microwave ownership.
(Source: Statista)
Germany
- The share of households owning microwave ovens in Germany declined steadily between 2008 and 2017.
- In 2008 and 2010, 80% of respondents reported owning a microwave, marking a stable ownership rate during this period.
- However, by 2013, the ownership rate fell to 76%, signaling the start of a downward trend.
- The decline continued in 2015, with ownership dropping further to 70%.
- By 2017, the share of households with microwave ovens had decreased to 65%, representing a significant decline over the decade.
- This data indicates a gradual reduction in microwave ownership in Germany, which may reflect changing consumer preferences, increased competition from other kitchen appliances, or shifts in cooking habits.
(Source: Statista)
United Kingdom
- The percentage of households with microwave ovens in the United Kingdom (UK) steadily increased from 1994 to 2018, reflecting a significant growth in adoption.
- In 1994-95, 67% of households owned a microwave, rising to 70% in 1995-96 and 75% in 1996-97.
- By 1997-98, ownership grew to 77%, reaching 80% in 1998-99 and maintaining this level through 1999-2000.
- The upward trend continued into the 2000s, with 84% in 2000-01, 86% in 2001-02, and 87% in 2002–03.
- By 2003-04, the ownership rate increased to 89%, and by 2004-05, it crossed the 90% mark.
- From 2005-06 through 2007, ownership stabilized at 91%. In 2008, the figure rose to 92%, and by 2009, it reached 93%.
- The following years, 2010-2015, saw ownership rates fluctuate slightly between 92% and 93%.
- Specifically, ownership stood at 92% in 2010, 2011, 2013, 2014, and 2015, while 93% was recorded in 2009, 2012, 2016, 2017, and 2018.
- By 2018, 93% of UK households owned microwave ovens, demonstrating near-saturation in the market. This consistent growth underscores the appliance’s essential role in modern kitchens over two decades.
(Source: Statista)
Ireland
- The share of households owning microwave ovens in the Republic of Ireland experienced steady growth from 2003 to 2017, with minor fluctuations observed in certain years.
- In 2003, microwave ownership stood at 84%, increasing to 88% in both 2005 and 2007, indicating a period of consistent adoption.
- By 2009, the ownership rate grew to 91%, followed by a slight rise to 92% in 2011, marking the peak during this period.
- However, a minor decline occurred in 2013 and 2015, with ownership rates falling slightly to 90%.
- By 2017, microwave ownership rebounded to 92%, reflecting a return to previous peak levels.
- This data highlights the strong adoption of microwave ovens in Irish households, with ownership rates stabilizing above 90% in recent years, indicating near saturation in the market.
(Source: Statista)
France
- The share of households owning microwave ovens in France exhibited slight fluctuations between 2008 and 2017.
- In 2008, microwave ownership reached its peak at 92%, reflecting widespread adoption.
- By 2010, the ownership rate dropped slightly to 91%, where it remained consistent through 2015, 2016, and 2017.
- A small decline was observed in 2013, when ownership dipped to 89%, before recovering to 91% in the subsequent years.
- This data indicates that microwave ownership in France has stabilized at around 91%, with minor variations over the decade, suggesting steady demand and near saturation in the French household market.
(Source: Statista)
Consumer Preferences and Trends
Microwave Oven Brand Preferences – By Age Group Statistics
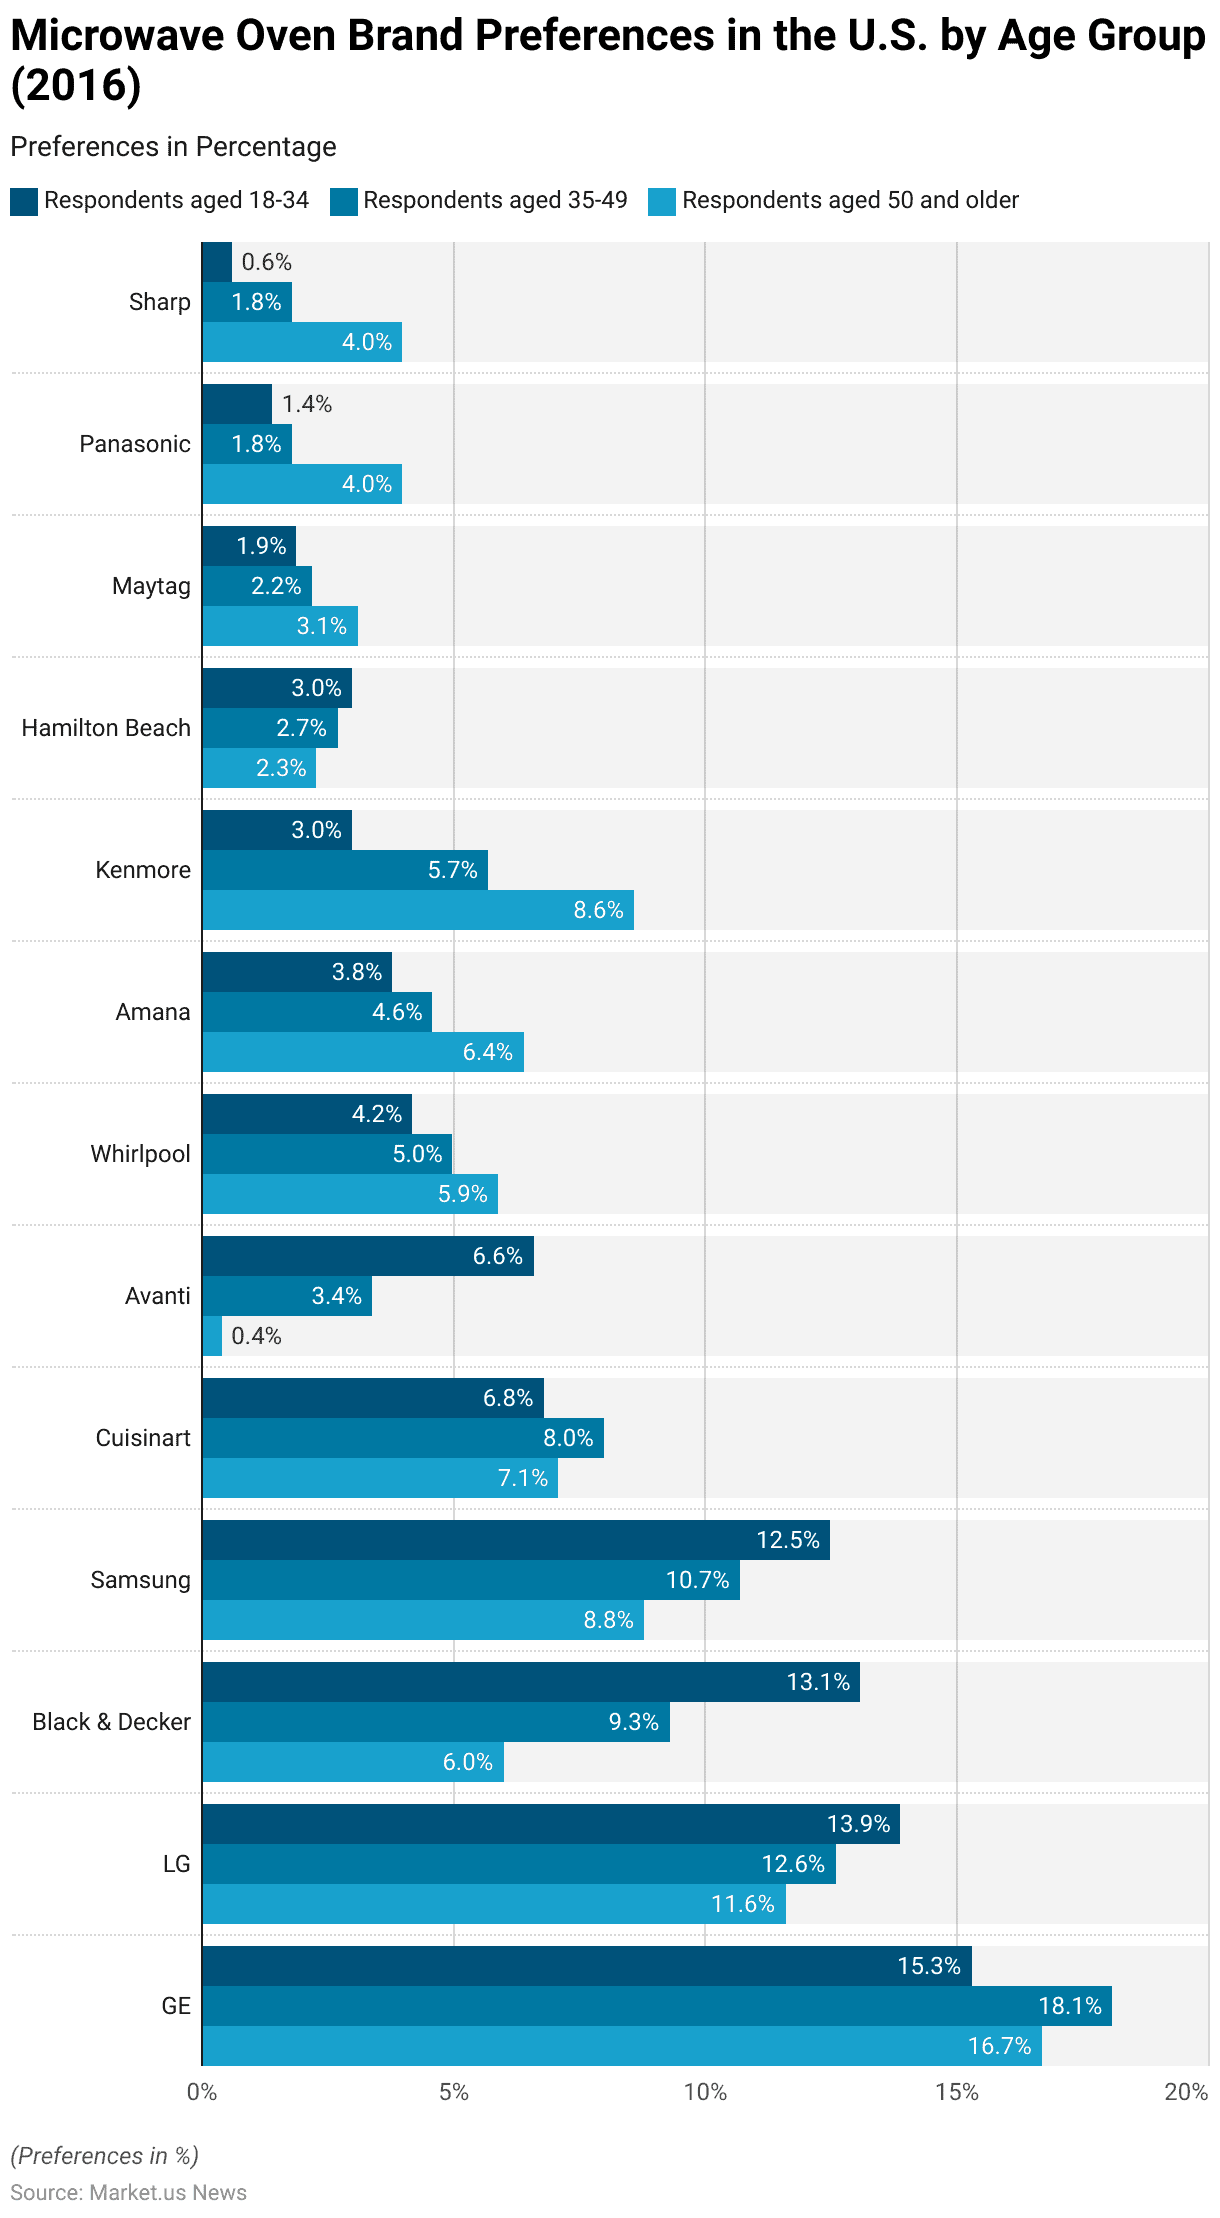
- In the United States, brand preferences for microwave ovens in 2016 varied by age group, reflecting distinct patterns.
- Among respondents aged 18-34, GE was the most preferred brand with 15.3%, followed closely by LG at 13.9% and Black & Decker at 13.1%.
- Samsung secured 12.5%, while Cuisinart and Avanti accounted for 6.8% and 6.6%, respectively.
- Whirlpool, Amana, and Kenmore held smaller shares at 4.2%, 3.8%, and 3%, while Hamilton Beach, Maytag, Panasonic, and Sharp each garnered under 3%.
- In the 35-49 age group, GE remained dominant with 18.1%, followed by LG at 12.6% and Black & Decker at 9.3%. Samsung was chosen by 10.7%, while Cuisinart increased by 8%.
- Whirlpool, Amana, and Kenmore gained traction with shares of 5%, 4.6%, and 5.7%, respectively.
- Hamilton Beach (2.7%) and Maytag (2.2%) maintained smaller preferences, while Panasonic and Sharp each captured 1.8%. Avanti declined significantly to 3.4%.
- For respondents aged 50 and older, GE continued to lead at 16.7%, with LG at 11.6% and Black & Decker falling to 6%.
- Samsung declined further to 8.8%. Notably, Kenmore rose to 8.6%, and Amana followed with 6.4%.
- Whirlpool held steady at 5.9%, while Cuisinart accounted for 7.1%. Panasonic and Sharp showed stronger preferences at 4%, while Maytag stood at 3.1%. Avanti dropped to a mere 0.4%.
- These insights reveal age-based brand loyalties, with GE, LG, and Samsung showing strong appeal among younger demographics, while Kenmore and Amana found more favor among older respondents.
(Source: Statista)
Popcorn Brand Preferences By Microwaves – By Age
- Between October 2017 and February 2018, brand preferences for microwave popcorn in the United States showed significant variation across age groups.
- Among respondents aged 18-34, Orville Redenbacher’s was the most preferred brand, with a commanding 55.1% share. Pop Secret followed with 23.2%, while Act II held a preference rate of 19.6%.
- Pop Weaver (7.6%), Jolly Time (7.5%), and Cousin Willy’s (6.7%) captured smaller market shares, with Other brands accounting for only 0.8%.
- For respondents aged 35-49, Orville Redenbacher remained the leader, albeit with a reduced share of 39.7%. Pop Secret retained 21.7%, while Act II accounted for 17.7%.
- Preferences for Pop Weaver and Jolly Time were lower at 5.2% and 6.8%, respectively, with Cousin Willy’s matching Jolly Time at 6.8%. Other brands gained slightly more traction in this age group, reaching 2.2%.
- Among respondents 50 years and older, Orville Redenbacher’s continued its dominance at 34.7%, followed by Pop Secret at 16.4% and Act II at 13.5%.
- Jolly Time held steady with 6.4%, while Cousin Willy’s dropped to 3.5%. Preferences for Pop Weaver declined to 2.8%, and Other brands remained at 2.2%.
- Moreover, the data highlights that Orville Redenbacher consistently leads across all age groups, with higher popularity among younger consumers, while competing brands like Pop Secret and Act II maintain moderate shares.
(Source: Statista)
Microwave Equipment Ownership in Households – By Age
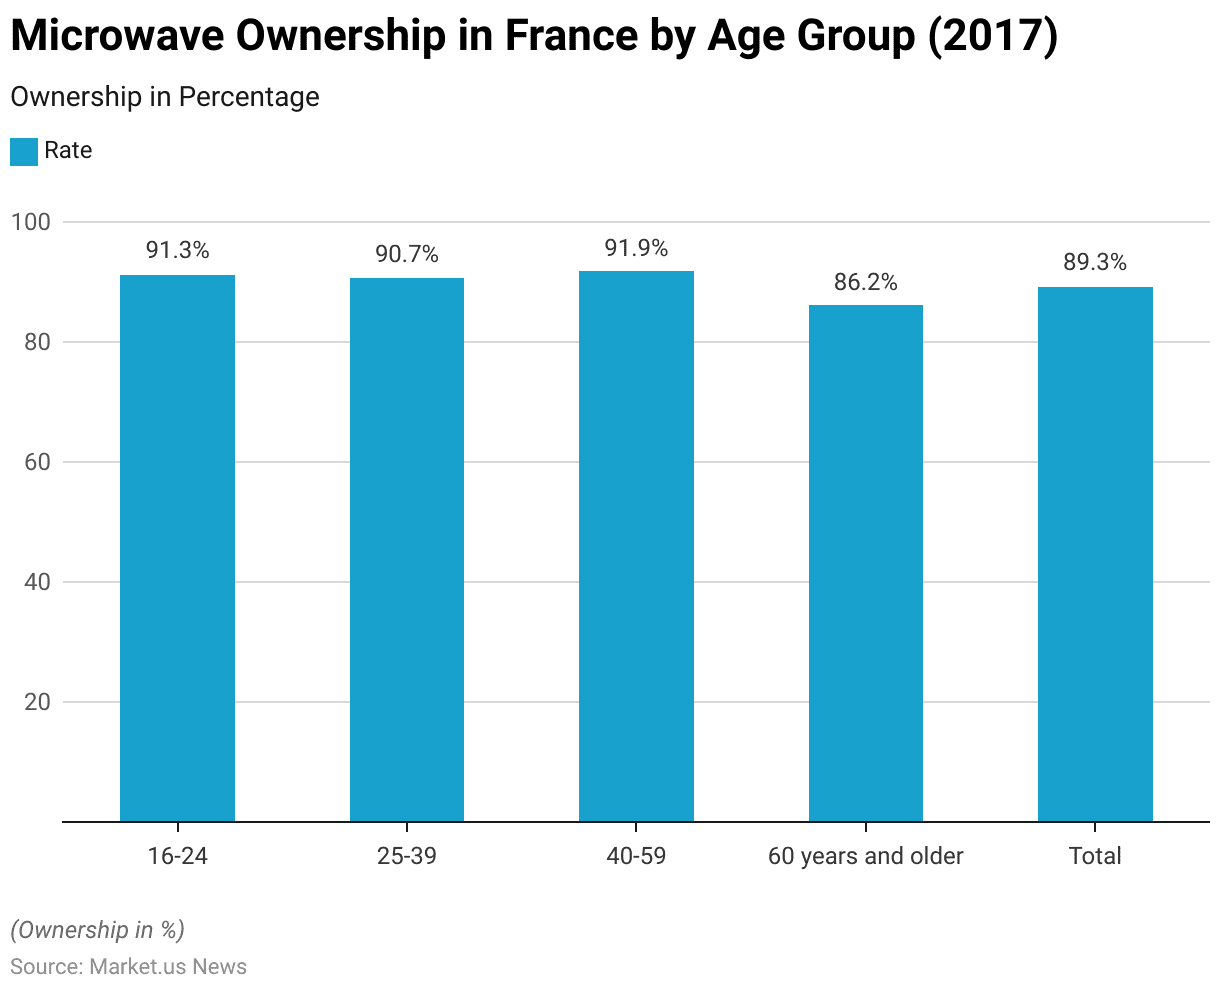
- In 2017, the share of households equipped with microwaves in France varied across age groups of the household reference person.
- Among those aged 16-24, the microwave ownership rate stood at 91.3%, while households in the 25–39 age group had a slightly lower rate at 90.7%.
- The highest ownership was recorded in the 40-59 age group, where 91.9% of households were equipped with a microwave.
- In contrast, ownership among those aged 60 years and older was lower at 86.2%, reflecting a gradual decline in microwave adoption among older households.
- Overall, the total household equipment rate across all age groups in France was 89.3%.
- This data highlights a strong penetration of microwave ovens in French households, particularly among younger and middle-aged groups, while adoption slightly decreases with older age groups.
(Source: Statista)
Households with a Microwave Oven – By Household Composition Statistics
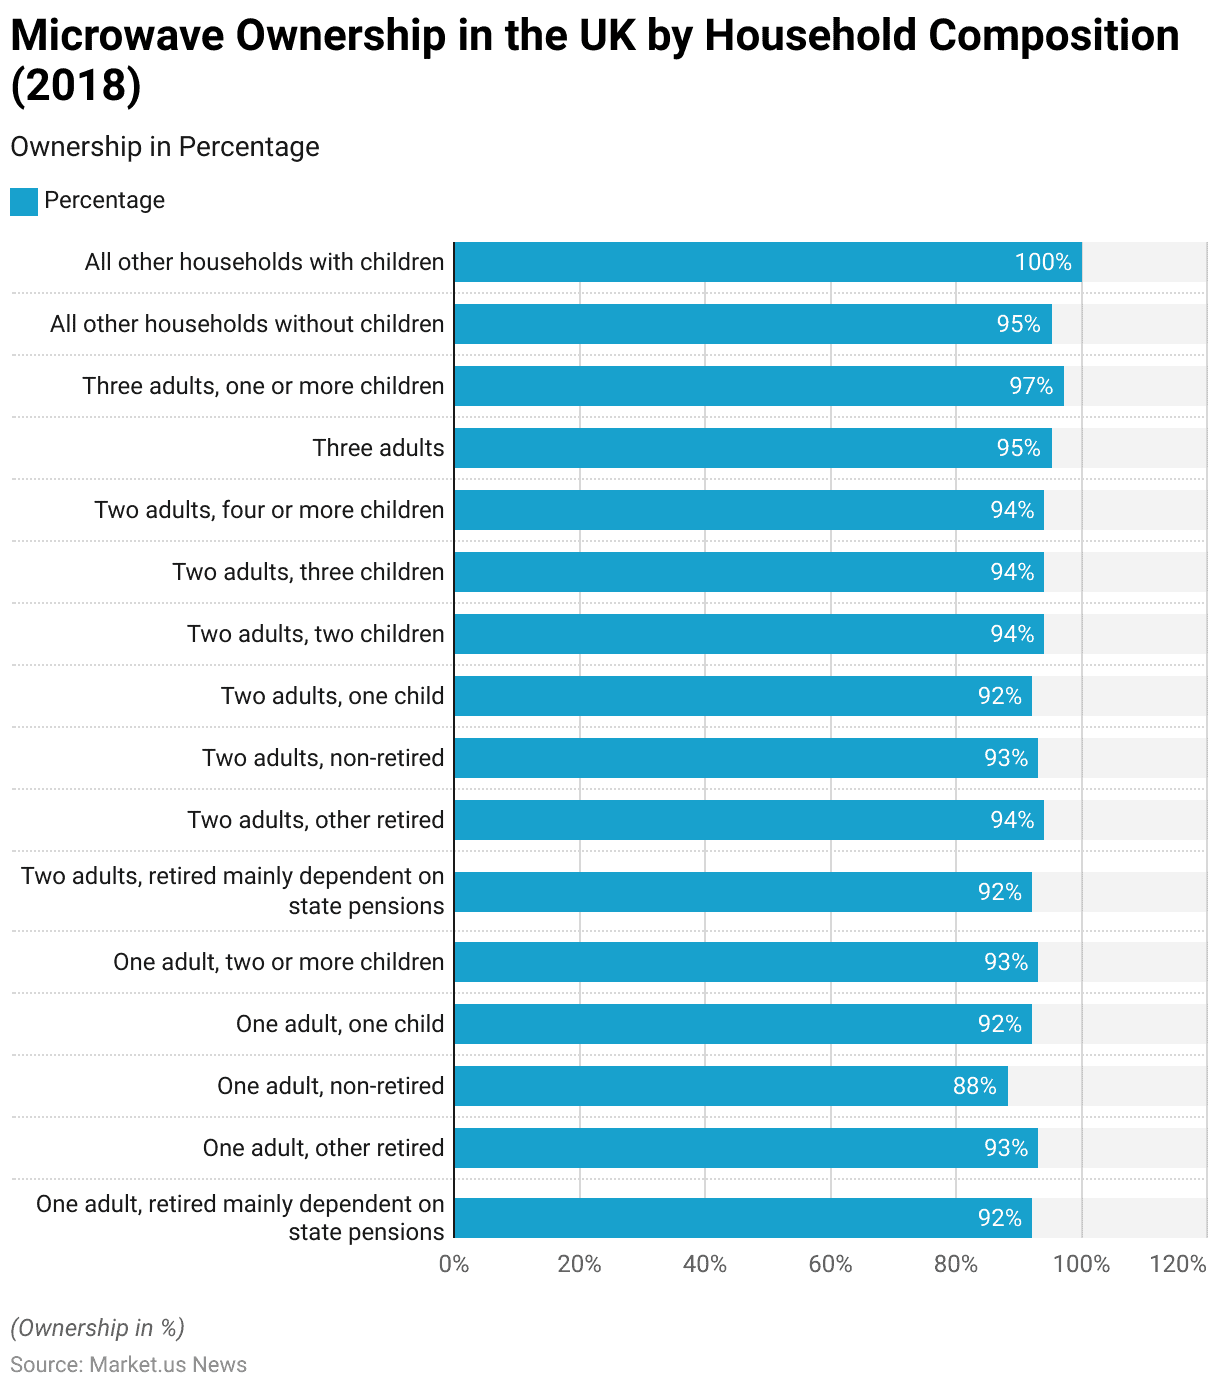
- In 2018, the percentage of households with a microwave oven in the United Kingdom (UK) varied based on household composition.
- Among single-adult households, 92% of those retired and mainly dependent on state pensions had a microwave, while 93% of other retired adults owned one.
- For non-retired single adults, the ownership rate was lower at 88%.
- Single-adult households with one child reported 92%, and those with two or more children reached 93%.
- For two-adult households, 92% of those retired and dependent on state pensions owned a microwave, while 94% of other retired couples reported ownership.
- Non-retired two-adult households had a 93% ownership rate.
- Among two-adult households with children, ownership rates were 92% for one child and 94% for families with two, three, or four or more children.
- Three-adult households had even higher microwave penetration, with 95% owning one, while three-adult households with one or more children reported an ownership rate of 97%.
- For “all other households,” microwave ownership stood at 95% for those without children and 100% for those with children, highlighting full penetration in such households.
- This data underscores the widespread adoption of microwave ovens in UK households, with higher ownership rates seen among multi-adult and child-inclusive households.
(Source: Statista)
Expenditure on Microwave Oven Statistics
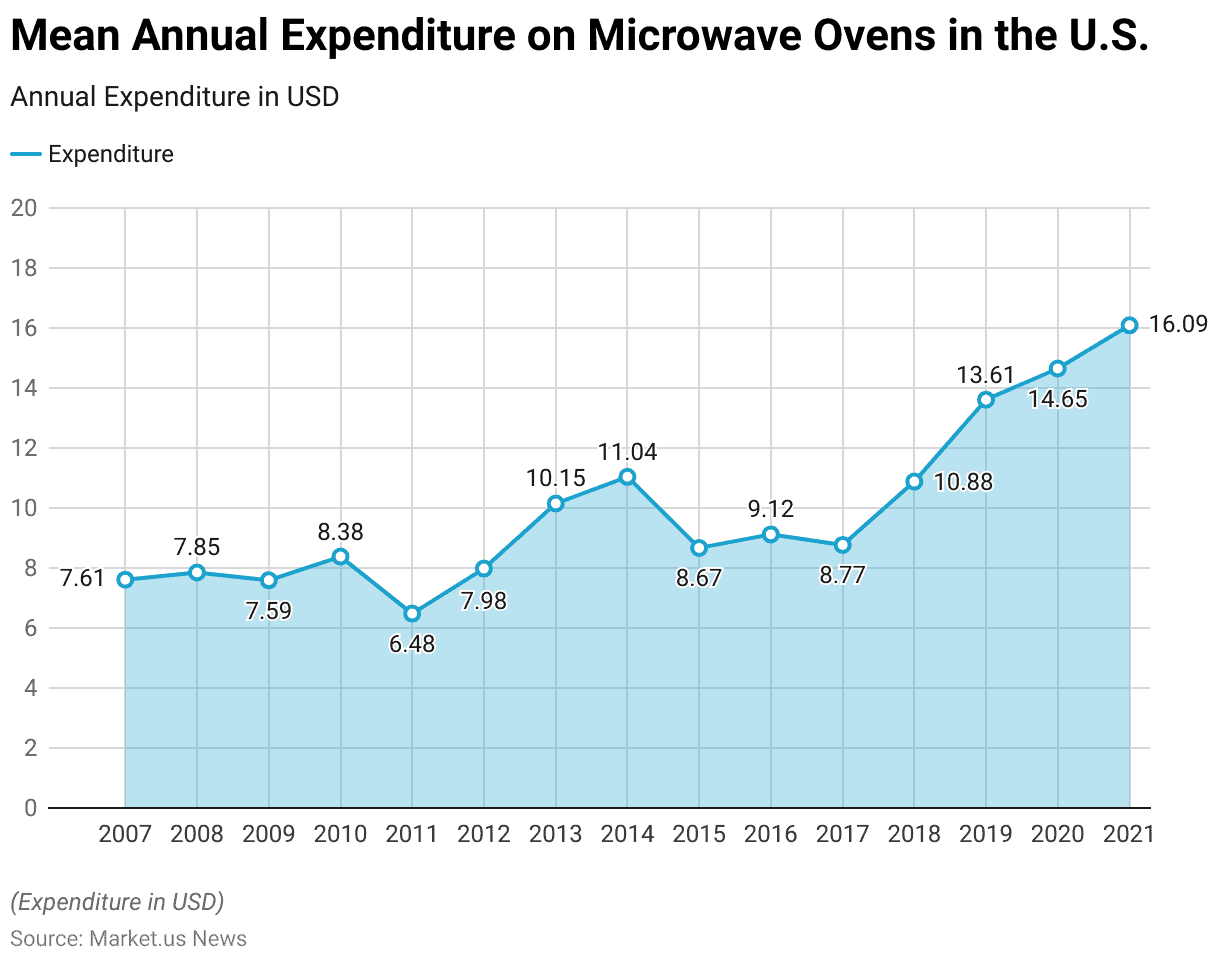
- Between 2007 and 2021, the mean annual expenditure on microwave ovens per consumer unit in the United States showed significant fluctuations, reflecting changing consumer spending habits.
- In 2007, the average expenditure was USD 7.61, rising slightly to USD 7.85 in 2008.
- However, a minor decline occurred in 2009, with spending dropping to USD 7.59.
- By 2010, spending increased to USD 8.38, but this upward trend reversed in 2011, reaching its lowest point at USD 6.48.
- The market rebounded in subsequent years, with expenditures increasing to USD 7.98 in 2012 and USD 10.15 in 2013.
- In 2014, spending peaked at USD 11.04 before declining to USD 8.67 in 2015.
- Moderate increases followed in 2016 and 2017, with expenditures at USD 9.12 and USD 8.77, respectively.
- By 2018, the figure rose again to USD 10.88, signaling renewed consumer interest.
- A notable surge occurred in 2019 when expenditures jumped to USD 13.61.
- This growth continued into 2020, reaching USD 14.65, and further peaked in 2021 at USD 16.09.
- Further, this sharp increase in recent years may reflect factors such as higher demand for home appliances during the COVID-19 pandemic and growing consumer investments in durable household goods.
(Source: Statista)
Regulations for Microwave Ovens
- Microwave ovens are subject to a variety of regulations and safety standards across different regions, ensuring their safe use and energy efficiency.
- Moreover, In the European Union, microwave ovens are regulated under the Low Voltage Directive (LVD), which mandates strict safety standards, including radiation leakage limits and safe design requirements.
- These ovens must pass rigorous testing and certification to display the CE mark, signifying compliance with EU regulations.
- In Japan, microwave ovens are not banned or heavily restricted but are subject to stringent health and safety regulations. They must undergo strict safety tests to verify that they operate within allowable radiation limits, ensuring they do not pose a risk to users or the environment.
- In Russia, while there is no outright ban on microwave ovens, they must comply with specific safety standards and display appropriate labeling indicating compliance.
- The Russian government also provides guidelines for proper usage to ensure safety, such as not using metal in microwaves and ensuring the appliance is well-maintained.
- Furthermore, the EU has implemented eco-design and energy labeling requirements, which include microwave ovens, aiming to reduce energy consumption and promote environmental sustainability.
- These regulations are part of a broader initiative to make appliances more energy-efficient, reflecting ongoing technological progress and the need for sustainability in appliance usage.
- Further, key developments in microwave oven regulations include updates to energy efficiency and safety standards, reflecting advancements in technology and an increased focus on consumer health and environmental impact. These changes are crucial for manufacturers and consumers alike, guiding the production and use of microwave ovens in a safer and more energy-efficient manner.
(Source: Kitchen Pearls, Machine Answered – All about Machines, Energy)
Recent Developments
Acquisitions and Mergers:
- Whirlpool Acquires Maytag Microwave Division (2023): In March 2023, Whirlpool Corporation announced the acquisition of Maytag’s microwave oven division in a deal valued at $200 million. This move aims to expand Whirlpool’s product portfolio, especially in the mid-range microwave segment, and enhance its competitive edge in North America and Europe.
- Samsung Acquires Smart Kitchen Startup (2023): In early 2023, Samsung Electronics acquired Smarter, a UK-based smart kitchen startup, for $120 million. The acquisition will help Samsung integrate AI-powered microwave ovens into its smart home ecosystem, making it easier for consumers to control cooking and heating processes remotely.
Product Launches:
- Panasonic Launches Smart Inverter Microwave (2023): In April 2023, Panasonic introduced a new 1.2-cubic foot smart inverter microwave designed to provide more precise and even cooking results. The product features Amazon Alexa integration, allowing users to control the microwave with voice commands. The microwave is priced at $349 and is expected to capture a growing market of tech-savvy, convenience-oriented consumers.
- LG’s New Microwave with Smart ThinQ Technology (2024): In January 2024, LG Electronics launched its new 30-inch smart microwave featuring Smart ThinQ Technology, allowing users to monitor and control the device remotely via a smartphone app. The microwave is equipped with 1,100 watts of power and includes 20 pre-set cooking programs, catering to various cooking needs. It is priced at $399, targeting urban consumers looking for innovative kitchen appliances.
Funding and Investments:
- Tovala Raises $30 Million for Smart Microwave Development (2023): Tovala, a startup known for its smart oven and microwave systems, raised $30 million in Series B funding in 2023. This investment will help the company enhance its product line, including the launch of a new version of its microwave oven with AI-powered recipe recommendations.
- Sharp Corporation Receives $50 Million for R&D (2023): Sharp Corporation secured $50 million in funding from Japanese investment firm SoftBank in 2023 to boost its microwave oven R&D efforts. The company aims to develop new technologies like advanced inverter cooking and energy-efficient models to cater to eco-conscious consumers.
Regulatory Developments:
- Energy Efficiency Standards in the U.S. (2024): The U.S. Department of Energy announced updated energy efficiency standards for microwave ovens, which will take effect in 2024. These new regulations are expected to save consumers an estimated $1.6 billion in energy costs over the next decade by mandating more energy-efficient models. As a result, microwave manufacturers are focused on producing models with lower power consumption and enhanced performance.
Conclusion
Microwave Oven Statistics – The global microwave oven market has shown steady growth, driven by increasing demand for convenience, technological advancements, and evolving consumer lifestyles.
Developed markets like the UK, France, and Ireland exhibit high ownership rates exceeding 90%, while emerging markets present growth opportunities.
Key trends include the adoption of smart technologies, energy-efficient models, and multifunctional features.
Although some regions, like Germany, have experienced a decline, the market remains resilient due to its affordability and utility.
Future growth will be fueled by urbanization, rising disposable incomes, and innovations in smart appliances, making microwaves a staple in modern kitchens worldwide.
FAQs
The global microwave oven market is valued at USD 10.8 billion (2022) and is projected to grow steadily to reach approximately USD 15.7 billion by 2032.
Countries like the United Kingdom (93%), France (91%), and Ireland (92%) have some of the highest household ownership rates for microwaves.
Key trends include smart microwave technology, energy-efficient models, multifunctional features (e.g., grilling and baking), and rising demand for quick and convenient cooking solutions.
The decline may be due to changing consumer habits, preference for healthier cooking alternatives, or reduced reliance on processed and microwavable meals.
Urbanization, increasing disposable incomes, smaller household sizes, and demand for time-saving appliances are the primary drivers of market growth.
Discuss your needs with our analyst
Please share your requirements with more details so our analyst can check if they can solve your problem(s)