
Introduction
Laptop Statistics: Laptops are essential tools in today’s computing landscape, combining portability with robust functionality.
Key components include the processor, memory (RAM), and storage options like SSDs or HDDs. Which are crucial for performance and data storage.
Displays vary in size and resolution, often featuring touch capabilities for enhanced interaction. Battery life supports mobility, while ports facilitate connectivity with peripherals and external displays.
Laptops are categorized into ultraportables for maximum mobility, gaming laptops for high-performance needs, and business laptops prioritizing durability and security.
Current trends highlight advancements in performance, security features, and sustainability. Reflecting ongoing innovations in design and functionality for diverse user requirements.
Editor’s Choice
- The global laptop market revenue reached USD 170.0 billion in 2023.
- By 2032, the market is expected to reach USD 247.7 billion. With traditional laptops generating USD 166.0 billion and 2-in-1 laptops USD 81.7 billion.
- The distribution of market shares in the global laptop market by screen size reveals distinct consumer preferences. Laptops with screen sizes up to 10.9 inches hold an 18% market share.
- The global laptop market is dominated by several key manufacturers, each holding a significant share of the market. Apple leads with a 17% market share.
- The laptop market revenue across various countries highlights the significant contributions from several key markets. China leads with a revenue of USD 23.25 million.
- Among individuals below 30 years, 29% prefer Lenovo, 38.10% opt for HCL, 11.40% choose Dell, 17.60% select HP, and 3.80% go for other brands.
- In India, stringent import restrictions have been imposed to boost local manufacturing. Requiring firms to obtain government permission before importing laptops. However, basic customs duties remain at zero due to commitments under the Information Technology Agreement of 1997.

Global Laptop Market Overview
Global Laptop Market Size Statistics
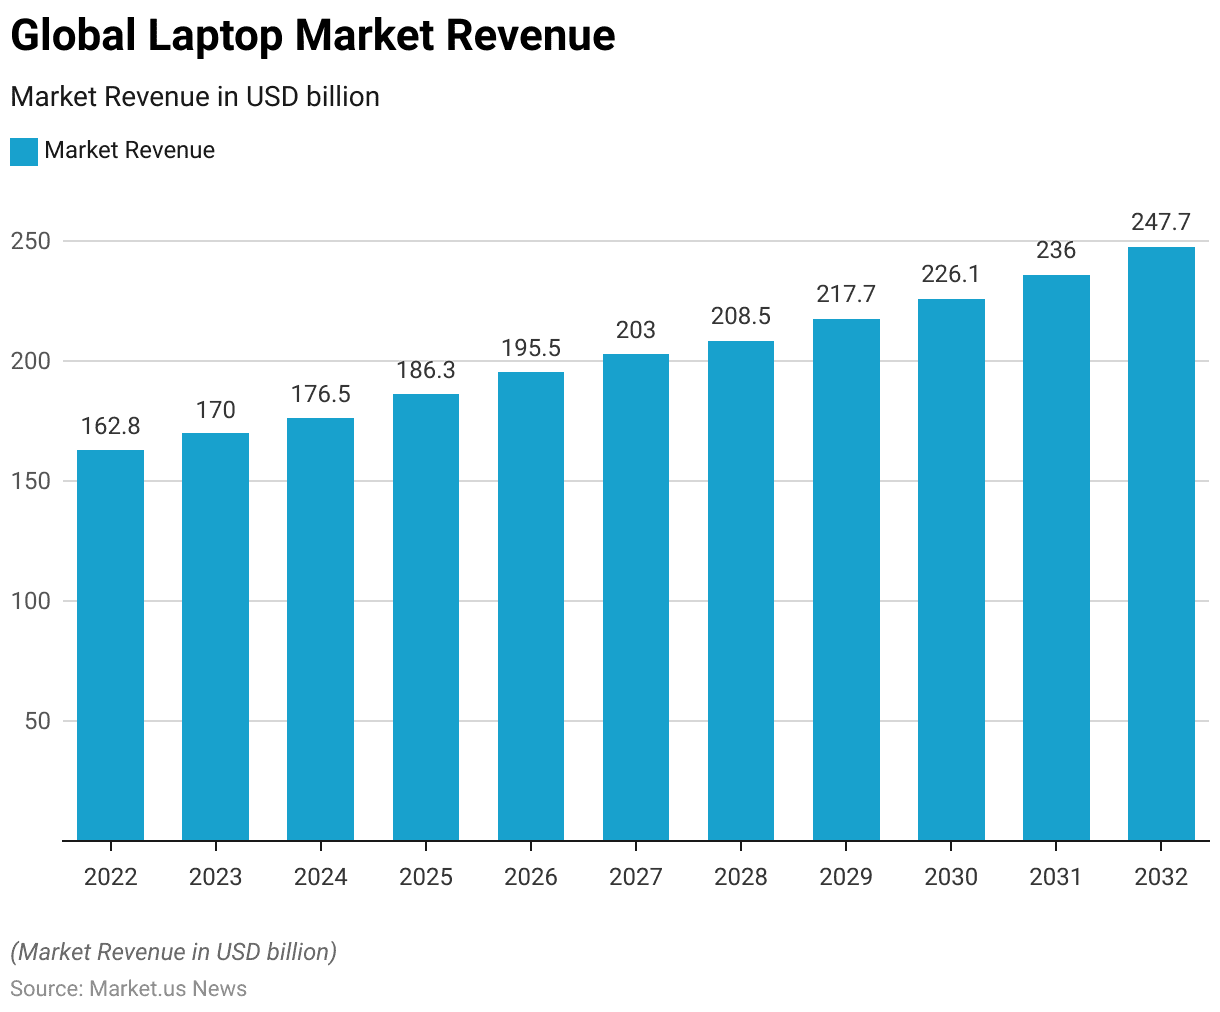
- The global laptop market has exhibited a steady growth trajectory over the past decade at a CAGR of 4.4%, with revenue figures reflecting this upward trend.
- In 2022, the market generated USD 162.8 billion, which increased to USD 170.0 billion in 2023.
- This growth continued in 2024, reaching USD 176.5 billion.
- By 2025, the market revenue is projected to climb to USD 186.3 billion. Further rising to USD 195.5 billion in 2026.
- The upward trend persists, with revenues anticipated to hit USD 203.0 billion in 2027 and USD 208.5 billion in 2028.
- The market is expected to achieve USD 217.7 billion by 2029 and USD 226.1 billion by 2030.
- Looking ahead, the forecast for 2031 suggests a revenue of USD 236.0 billion. Culminating in an estimated USD 247.7 billion by 2032.
- This consistent growth underscores the robust demand and expanding market for laptops globally.
(Source: market.us)
Global Laptop Market Size – By Type Statistics
2022-2024
- The global laptop market, segmented by type, has demonstrated significant growth in both traditional and 2-in-1 laptop categories.
- In 2022, the total market revenue was USD 162.8 billion. Traditional laptops contribute USD 109.1 billion and 2-in-1 laptops account for USD 53.7 billion.
- By 2023, the market expanded to USD 170.0 billion. With traditional laptops generating USD 113.9 billion and 2-in-1 laptops reaching USD 56.1 billion.
- This trend continued in 2024, with total revenue at USD 176.5 billion. Comprising USD 118.3 billion from traditional laptops and USD 58.2 billion from 2-in-1 models.
2025-2028
- The growth persisted into 2025, with the market totaling USD 186.3 billion, of which USD 124.8 billion was from traditional laptops and USD 61.5 billion from 2-in-1 laptops.
- By 2026, total revenue rose to USD 195.5 billion. With traditional laptops contributing USD 131.0 billion and 2-in-1 laptops USD 64.5 billion.
- The year 2027 saw the market reach USD 203.0 billion. With USD 136.0 billion from traditional laptops and USD 67.0 billion from 2-in-1 models.
- In 2028, the market revenue was USD 208.5 billion. With traditional laptops generating USD 139.7 billion and 2-in-1 laptops USD 68.8 billion.
2029-2032
- By 2029, the market grew to USD 217.7 billion. With traditional laptops contributing USD 145.9 billion and 2-in-1 models USD 71.8 billion.
- The year 2030 saw further growth, with total revenue at USD 226.1 billion. Including USD 151.5 billion from traditional laptops and USD 74.6 billion from 2-in-1 laptops.
- Projections for 2031 indicate a total market revenue of USD 236.0 billion. With traditional laptops contributing USD 158.1 billion and 2-in-1 laptops USD 77.9 billion.
- By 2032, the market is expected to reach USD 247.7 billion. With traditional laptops generating USD 166.0 billion and 2-in-1 laptops USD 81.7 billion.
- This consistent growth highlights the robust demand for both traditional and 2-in-1 laptops in the global market.
(Source: market.us)

Global Laptop Market Share – By Screen Size Statistics
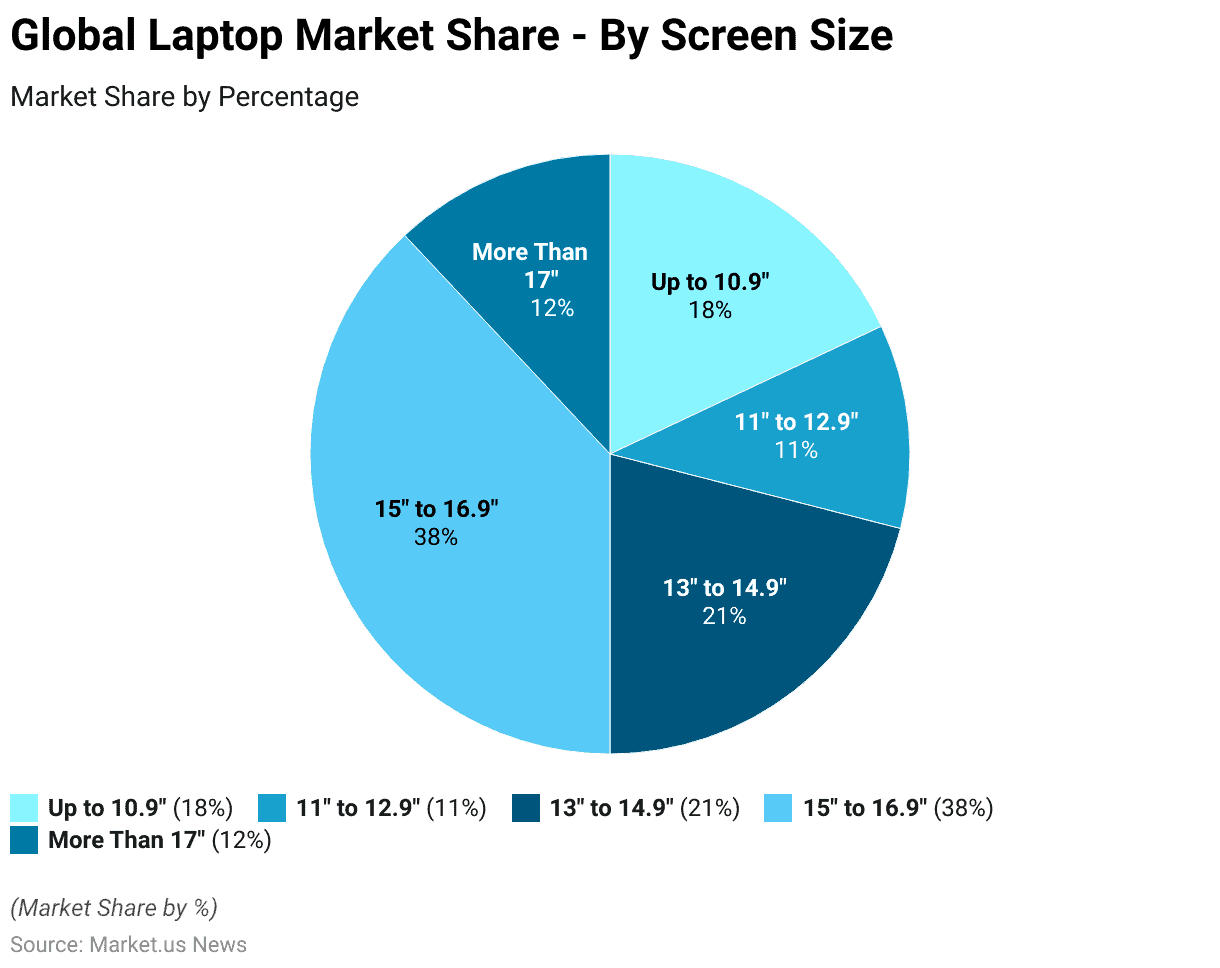
- The distribution of market shares in the global laptop market by screen size reveals distinct consumer preferences.
- Laptops with screen sizes up to 10.9 inches hold an 18% market share. While those in the 11 to 12.9-inch range account for 11% of the market.
- The 13 to 14.9-inch category captures a 21% share, indicating significant demand for moderately sized laptops.
- The largest segment belongs to laptops with screen sizes between 15 and 16.9 inches. Which dominates the market with a 38% share.
- Laptops with screens larger than 17 inches constitute the remaining 12% of the market.
- This distribution underscores the popularity of mid-to-large screen sizes among consumers.
(Source: market.us)
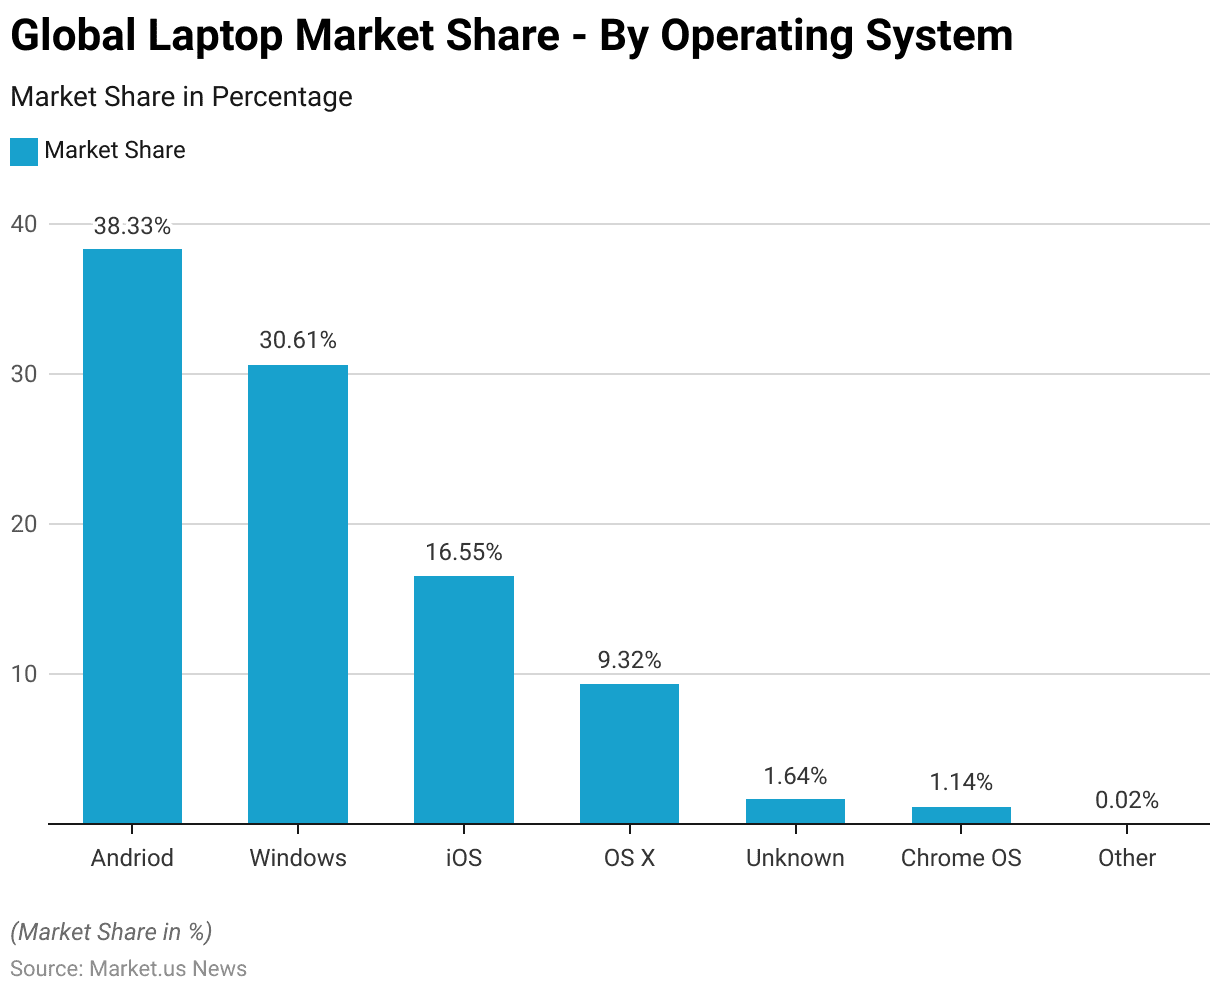
Global Laptop Market Share – By Operating System Statistics
- As of November 2023, the market shares for operating systems show a diverse landscape.
- Android leads with a commanding 38.33% share, followed by Windows, which holds 30.61% of the market.
- iOS accounts for 16.55%, while OS X comprises 9.32% of the market share.
- Operating systems classified as “Unknown” represent 1.64%, and Chrome OS has a 1.14% share.
- Other operating systems collectively make up a negligible 0.02% of the market.
- This distribution indicates the dominance of Android and Windows, with notable usage of iOS and OS X among consumers.
(Source: Statista)
Competitive Landscape of the Global Laptop Market Statistics
- In 2023, the global laptop market was characterized by significant shares held by several key companies.
- Lenovo dominated the third quarter with a 24% market share, while HP’s models, such as Envy, Elitebook, Pavilion, Omen, and Pavilion gaming, collectively held 22.5% of the market for the year.
- Dell Technologies saw a notable increase from 17.4% in Q3 to an expected 26.7% by the year-end. Apple maintained a solid presence with a 13.3% market share.
- Toshiba, MSI, Microsoft, and Samsung combined accounted for 13.9% of the market share in 2023. With Acer following at 5.9%, ASUS at 2.9%, and other companies collectively at 7.7%.
- These figures illustrate the competitive landscape of the global laptop market in 2023.
(Source: Statista)
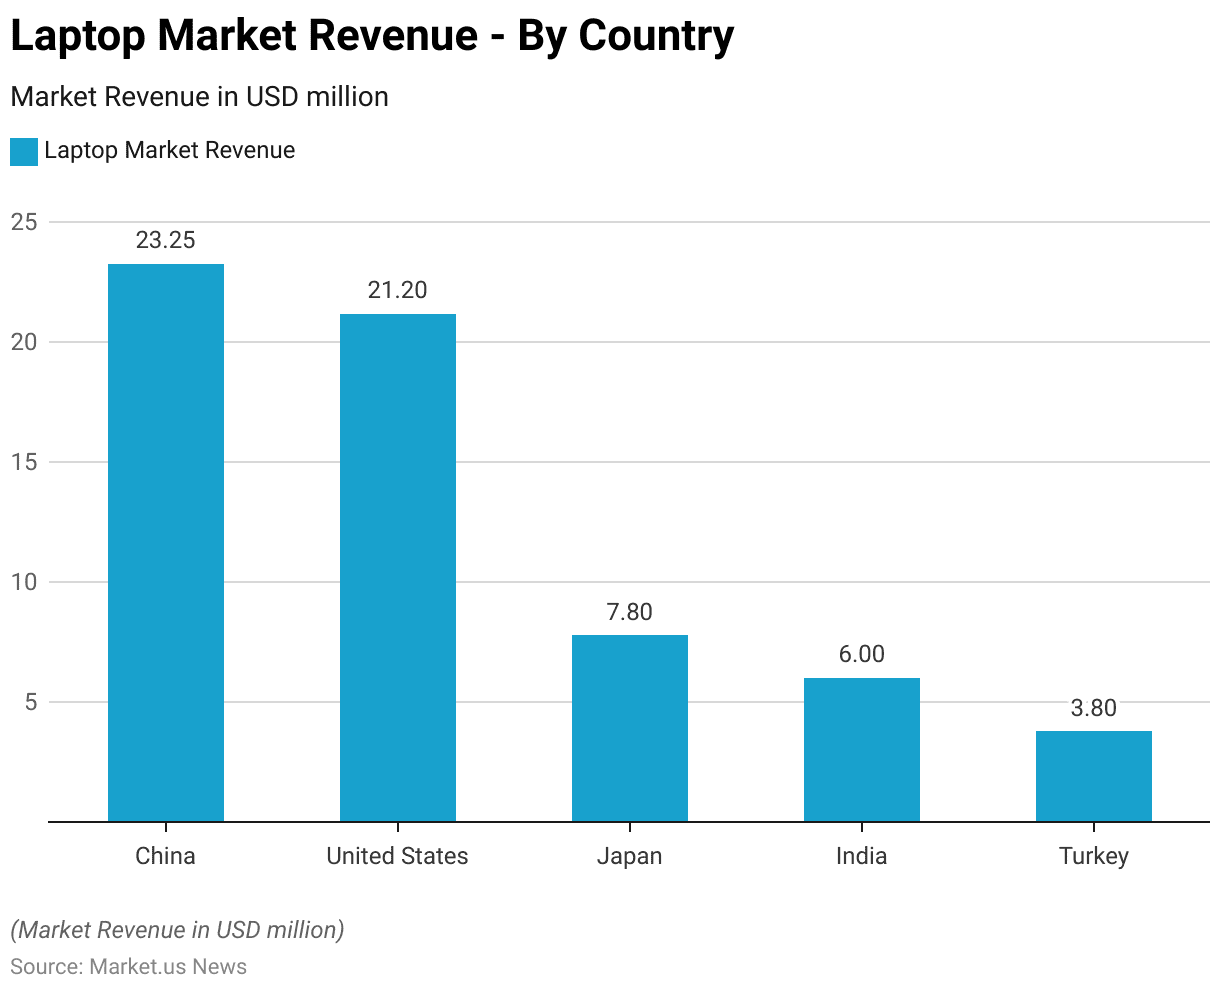
Regional Analysis of Global Laptop Market Statistics
- The laptop market revenue across various countries highlights the significant contributions from several key markets.
- China leads with a revenue of USD 23.25 million, followed closely by the United States, which generates USD 21.2 million.
- Japan ranks third with a market revenue of USD 7.8 million.
- India also shows substantial market activity with a revenue of USD 6 million.
- Meanwhile, Turkey’s laptop market revenue stands at USD 3.8 million.
- This data reflects the varying levels of market penetration and consumer demand for laptops in these countries.
(Source: Statista)
Revenue Generation Through Laptop Statistics
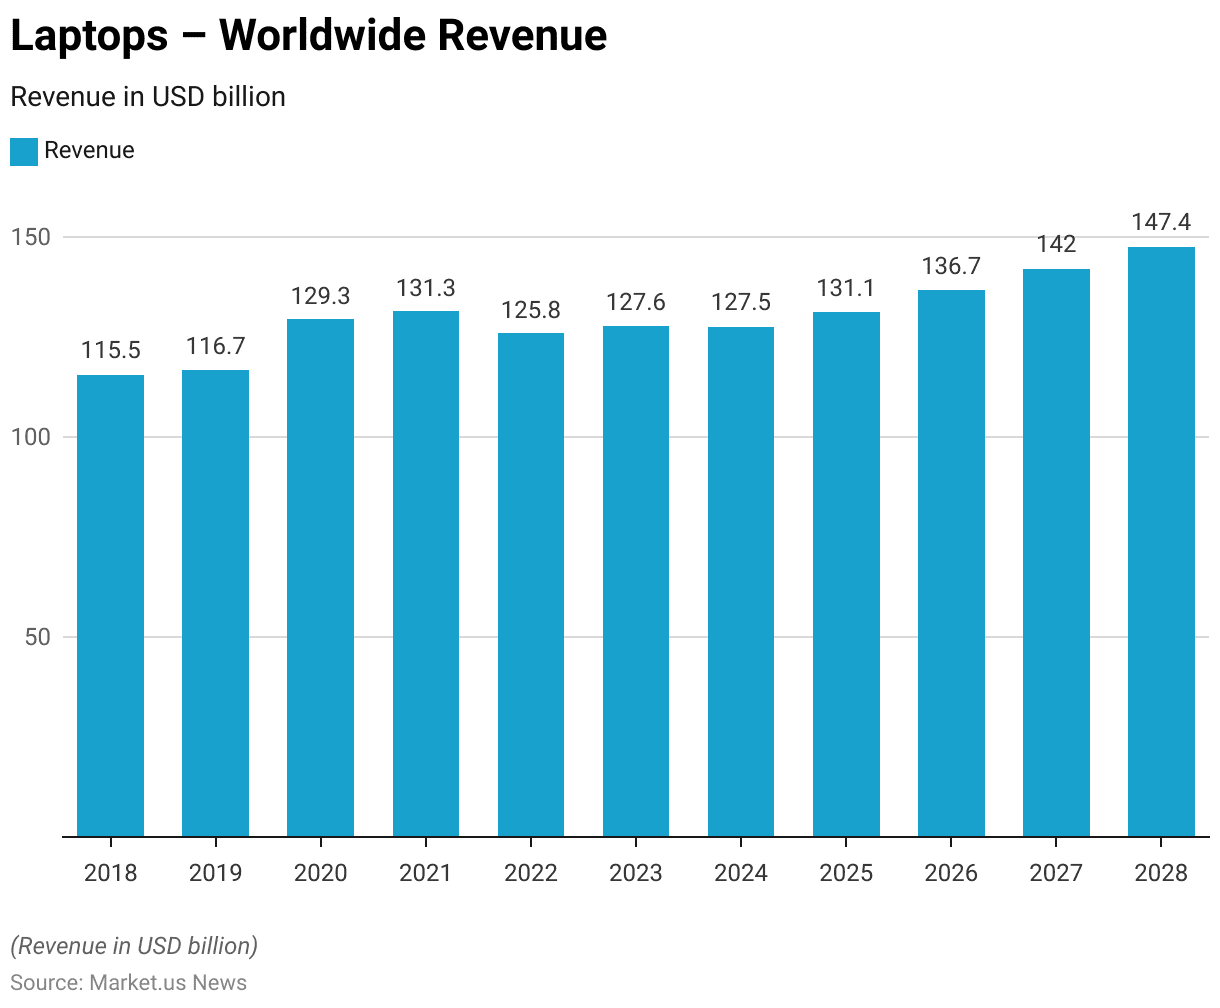
Laptop – Worldwide Revenue Statistics
- The worldwide revenue for laptops has experienced fluctuating growth over the past decade.
- In 2018, the global laptop market generated USD 115.5 billion, which slightly increased to USD 116.7 billion in 2019.
- A significant rise occurred in 2020, with revenue reaching USD 129.3 billion. Followed by a modest increase to USD 131.3 billion in 2021.
- However, 2022 saw a decline to USD 125.8 billion.
- The market rebounded slightly in 2023 with a revenue of USD 127.6 billion. Though it remained relatively stable at USD 127.5 billion in 2024.
- Projections indicate growth resuming in subsequent years. With revenue expected to reach USD 131.1 billion in 2025, USD 136.7 billion in 2026, USD 142 billion in 2027, and USD 147.4 billion by 2028.
- This trend reflects both the market’s resilience and its potential for continued expansion.
(Source: Statista)
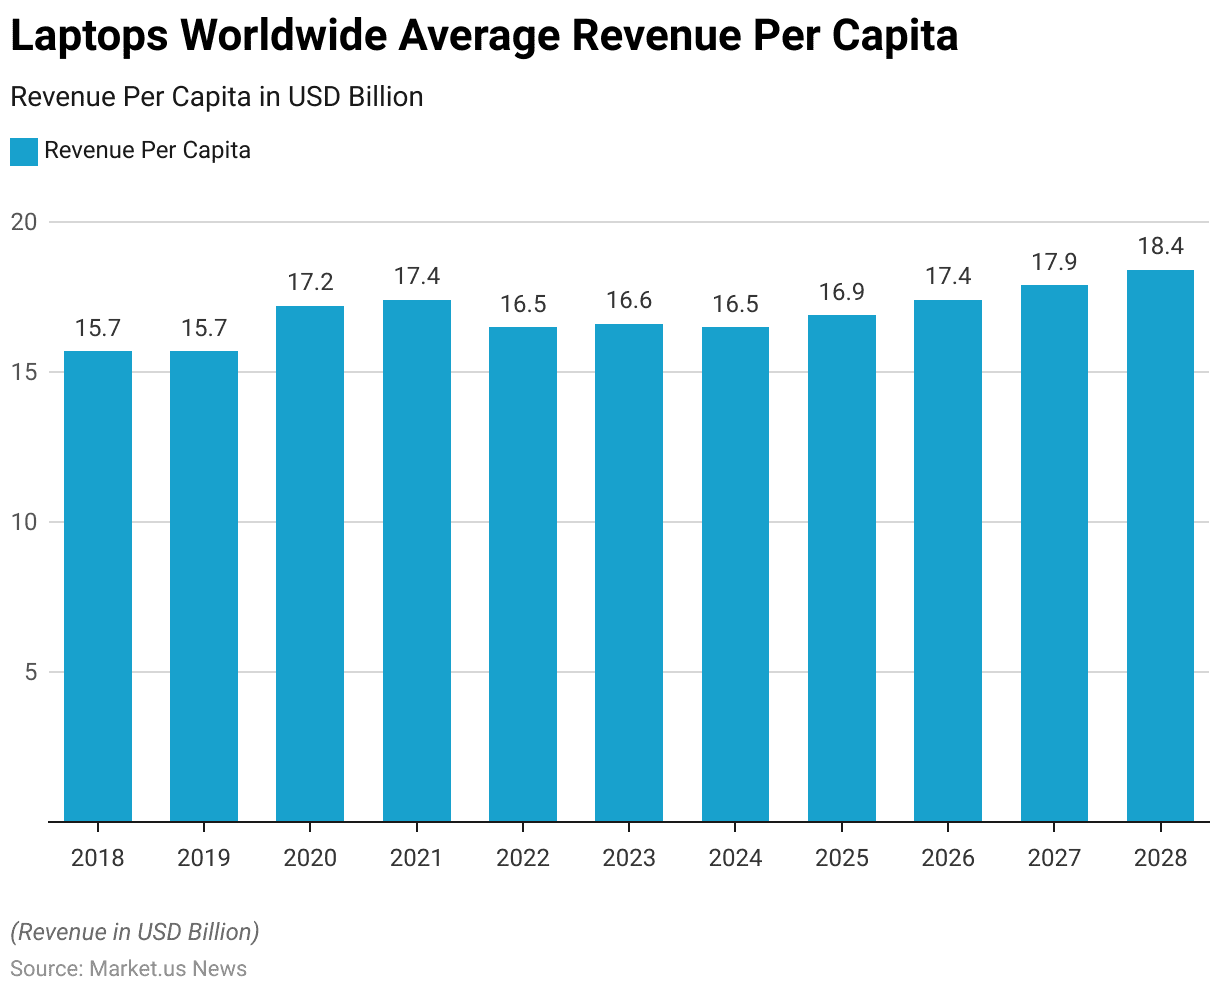
Average Revenue Per Capita
- The average revenue per capita for laptops worldwide has shown a dynamic trend over the years.
- In 2018 and 2019, the average revenue per capita remained steady at USD 15.7.
- There was a noticeable increase in 2020, with the figure rising to USD 17.2 and a slight further increase to USD 17.4 in 2021.
- However, 2022 saw a decrease to USD 16.5, followed by a marginal increase to USD 16.6 in 2023.
- The average revenue per capita is projected to stabilize at USD 16.5 in 2024 before rising again to USD 16.9 in 2025.
- Continued growth is expected, with the average revenue per capita reaching USD 17.4 in 2026, USD 17.9 in 2027, and USD 18.4 in 2028.
- This progression highlights the fluctuating yet overall upward trend in global consumer spending on laptops.
(Source: Statista)
Laptop Production and Manufacturing Statistics
Global Production Volume and Volume Growth
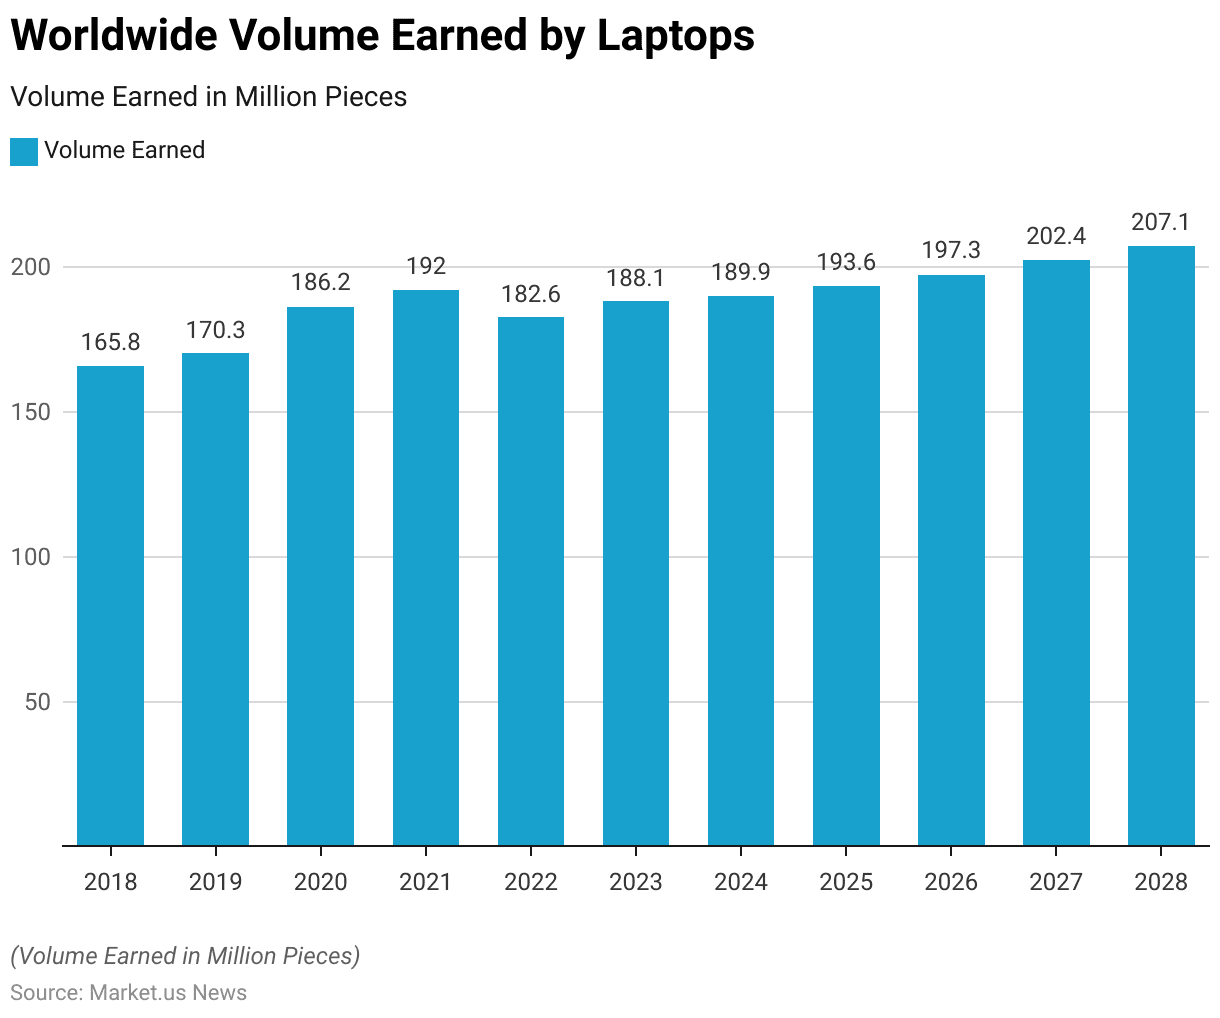
- The worldwide volume of laptops sold has exhibited a notable growth pattern over recent years.
- In 2018, the volume stood at 165.8 million pieces, which increased to 170.3 million pieces in 2019.
- A significant rise occurred in 2020, with the volume reaching 186.2 million pieces. Followed by a further increase to 192 million pieces in 2021.
- However, 2022 saw a decline to 182.6 million pieces.
- The market rebounded in 2023, with sales volume rising to 188.1 million pieces, and it is projected to reach 189.9 million pieces in 2024.
- Continued growth is anticipated, with the volume expected to climb to 193.6 million pieces in 2025, 197.3 million pieces in 2026, 202.4 million pieces in 2027, and 207.1 million pieces by 2028.
- This trend underscores the expanding demand for laptops on a global scale.
(Source: Statista)
Top Laptop Manufacturers Worldwide Statistics
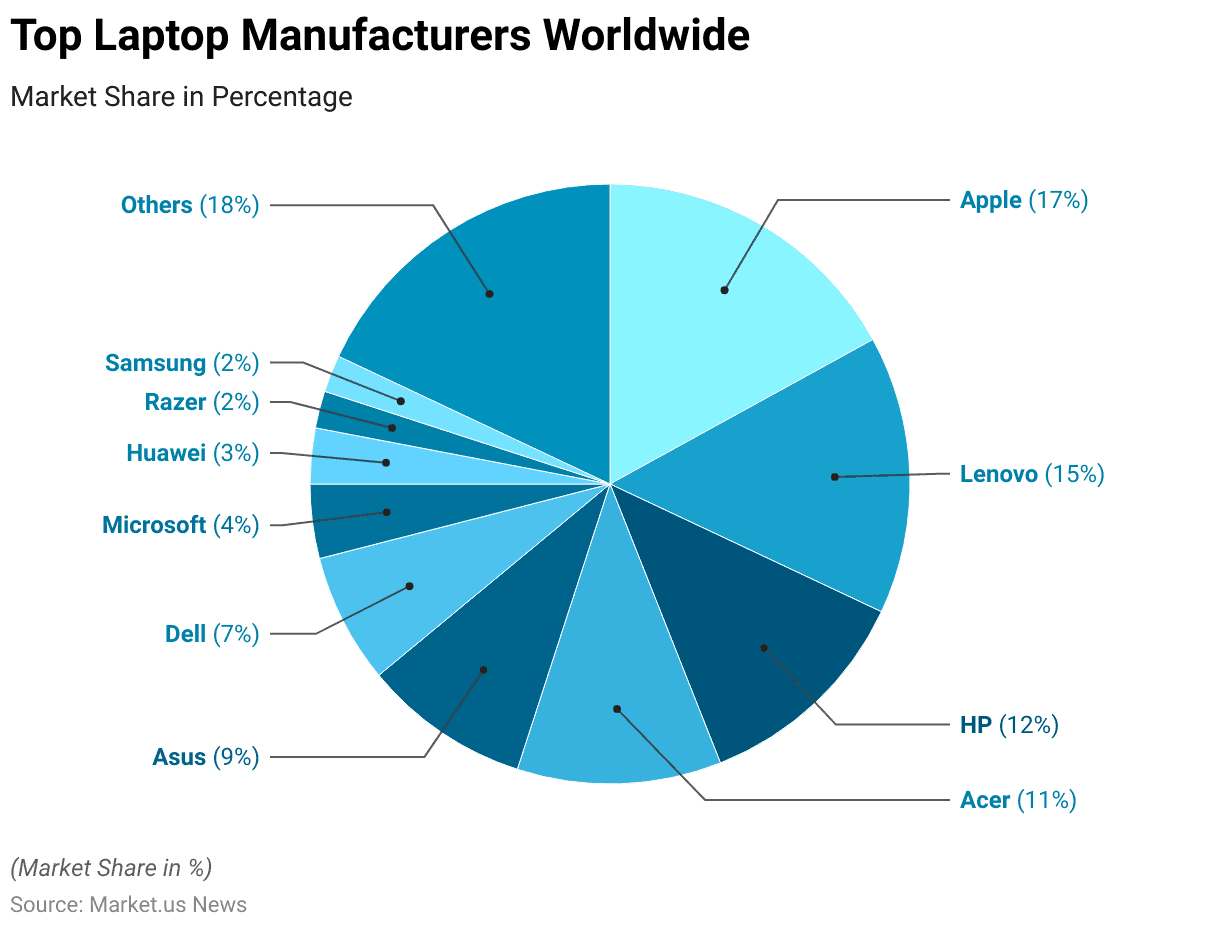
- The global laptop market is dominated by several key manufacturers, each holding a significant share of the market.
- Apple leads with a 17% market share, followed by Lenovo at 15% and HP at 12%.
- Acer and Asus hold 11% and 9% of the market share, respectively.
- Dell accounts for 7% of the market, while Microsoft captures 4%.
- Huawei holds a 3% share, and both Razer and Samsung each account for 2% of the market.
- Other manufacturers collectively make up the remaining 18% of the market.
- This distribution reflects the competitive landscape of the laptop industry, with a mix of established leaders and emerging brands.
(Source: Statista)
Laptop Price Statistics
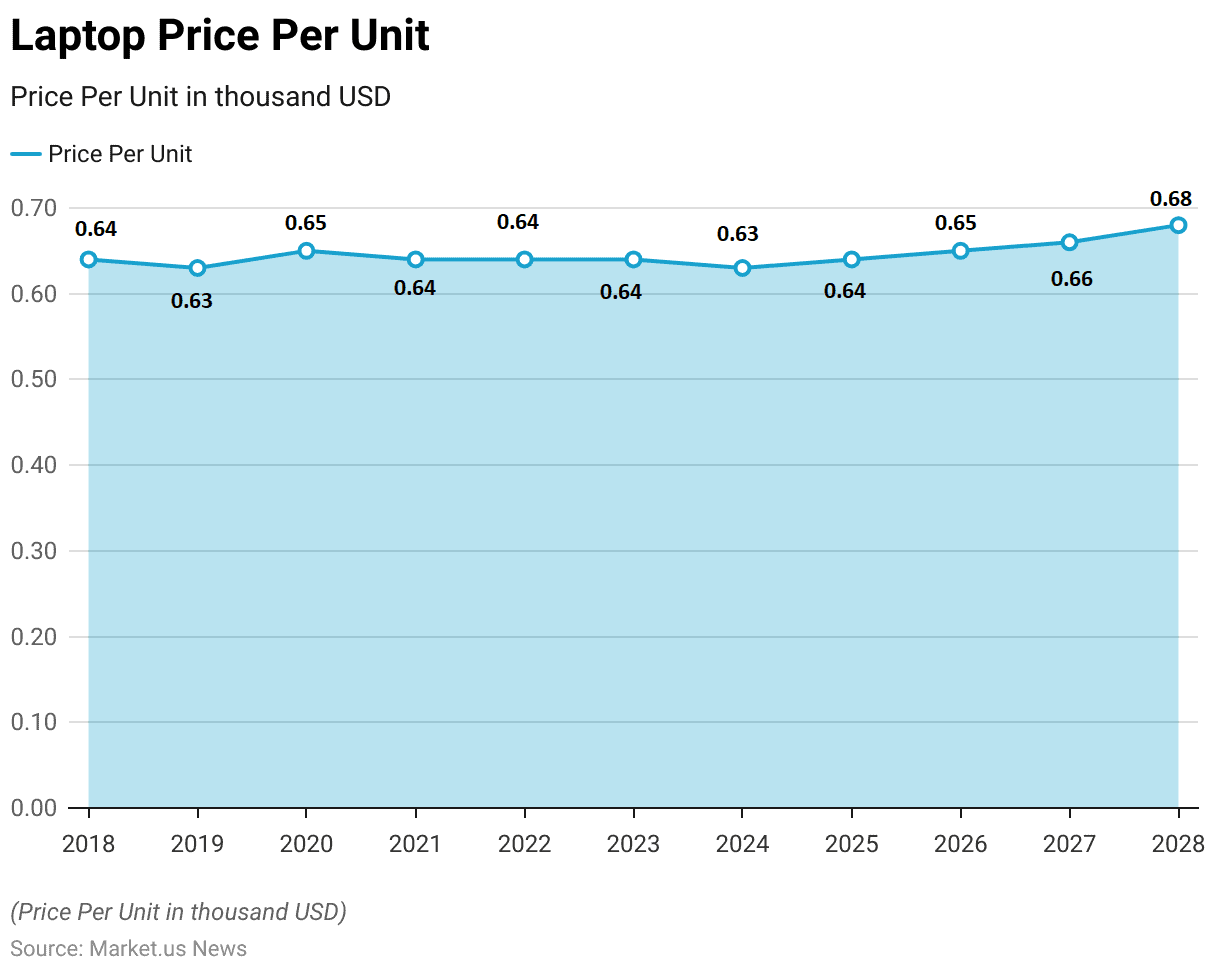
- The average price per unit for laptops has shown relative stability with slight fluctuations over the past decade.
- In 2018, the price per unit was USD 0.64 thousand, which decreased marginally to USD 0.63 thousand in 2019.
- The price increased to USD 0.65 thousand in 2020 before returning to USD 0.64 thousand in 2021 and remaining stable through 2023.
- A minor decrease to USD 0.63 thousand is projected for 2024.
- However, the price is expected to rise again to USD 0.64 thousand in 2025 and continue to increase to USD 0.65 thousand in 2026.
- Further incremental increases are anticipated, with the price reaching USD 0.66 thousand in 2027 and USD 0.68 thousand by 2028.
- This trend suggests a gradual increase in the average price per unit of laptops over time.
(Source: Statista)
Laptop Import Statistics
Imported Laptop Bought – By Country Statistics
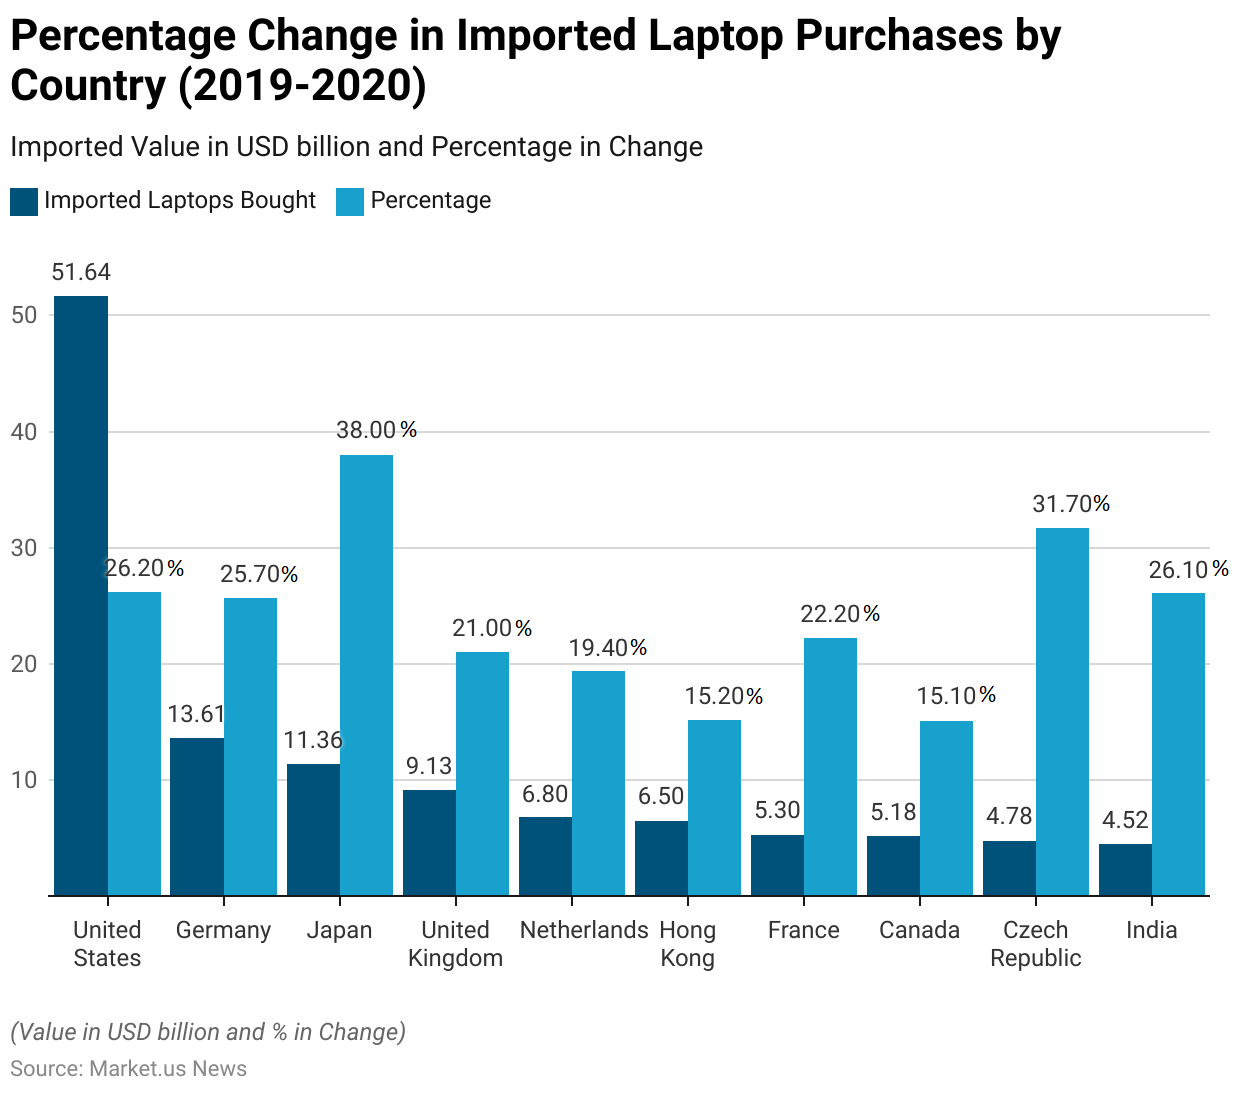
- The period from 2019 to 2020 saw significant changes in imported laptop purchases across various countries.
- The United States led with imports valued at USD 51.64 billion, marking a 26.20% increase from 2019.
- Germany followed with imports worth USD 13.61 billion, reflecting a 25.70% rise.
- Japan experienced the highest percentage increase at 38.00%, with imports totaling USD 11.36 billion.
- The United Kingdom imported USD 9.13 billion worth of laptops, a 21.00% increase. While the Netherlands saw a 19.40% rise to USD 6.80 billion.
- Hong Kong’s imports grew by 15.20% to USD 6.50 billion.
- France imported laptops worth USD 5.30 billion, a 22.20% increase and Canada saw a 15.10% rise to USD 5.18 billion.
- The Czech Republic’s imports increased by 31.70% to USD 4.78 billion, and India recorded a 26.10% increase with imports totaling USD 4.52 billion.
- This data underscores the significant growth in laptop imports across these countries during this period.
(Source: Imported Consumer Products)
Richest Global Markets for Imported Laptop Statistics
- In 2020, the demand for imported laptops in some of the world’s richest markets exhibited substantial growth. The United States led with imports valued at USD 51.6 billion, reflecting a 26.20% increase from 2019.
- Singapore imported laptops worth USD 2.1 billion, marking a 17.20% rise. While Hong Kong saw a 15.20% increase, with imports totaling USD 6.5 billion.
- Switzerland’s laptop imports amounted to USD 1.5 billion, an 8.10% increase.
- Norway experienced a modest rise of 2.30%, with imports valued at USD 837.5 million.
- Ireland recorded a significant 36.30% increase, importing laptops worth USD 630.3 million.
- Luxembourg and Macao also saw notable growth, with increases of 32.10% (USD 94 million) and 29.50% (USD 113 million), respectively.
- Qatar imported USD 165.6 million worth of laptops, an 11.50% rise, while Brunei Darussalam experienced an exceptional 302.00% increase, with imports reaching USD 59.6 million.
- This data underscores the robust demand for laptops across these affluent markets during the year.
(Source: Imported Consumer Products)
Laptop Export Statistics
Top Exporters of Computer Devices – By Value
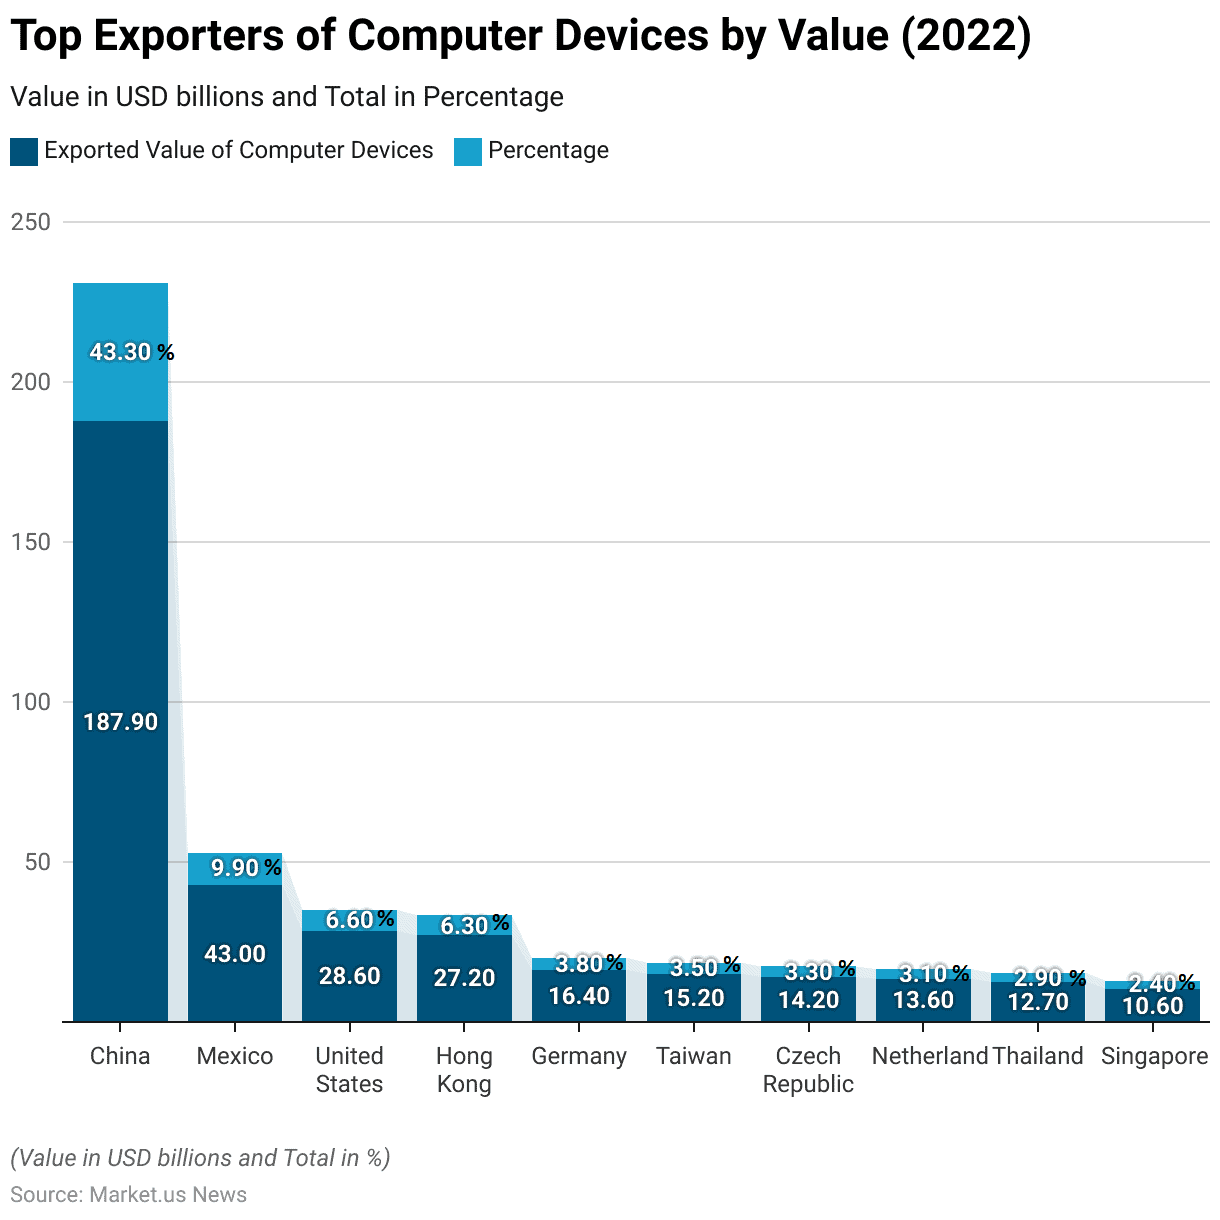
- In 2022, China emerged as the leading exporter of computer devices. With an exported value of USD 187.9 billion, accounting for 43.30% of the total global exports.
- Mexico followed, exporting computer devices worth USD 43. 0 billion, which represented 9.90% of the total.
- The United States exported devices valued at USD 28.6 billion, contributing 6.60% to the global export market.
- Hong Kong’s exports stood at USD 27.2 billion, making up 6.30% of the total, while Germany exported USD 16.4 billion worth of computer devices, accounting for 3.80%.
- Taiwan and the Czech Republic contributed 3.50% and 3.30%, respectively, with exports valued at USD 15.2 billion and USD 14.2 billion.
- The Netherlands exported USD 13.6 billion worth of computer devices, representing 3.10% of the total, followed by Thailand with USD 12.7 billion (2.90%) and Singapore with USD 10.6 billion (2.40%).
- This data highlights the significant contributions of these countries to the global computer device export market.
(Source: World’s Top Exports)
Countries Generating Largest Trade Surpluses from Computer Devices
- In 2022, Mainland China led the world in net export surplus of computer devices with a surplus of USD 153.3 billion, although this represented a 6.00% decrease from 2021.
- Mexico followed with a net export surplus of USD 31.2 billion, marking a substantial 39.00% increase.
- Taiwan’s surplus stood at USD 9.6 billion, reflecting a 42.60% rise.
- Thailand experienced a slight decline of 8.90%, with a surplus of USD 9.2 billion.
- Vietnam saw a remarkable increase of 152.70%, achieving a surplus of USD 6.8 billion.
- Malaysia’s net export surplus was USD 4.1 billion, up by 58.10%.
- The Czech Republic had a surplus of USD 3.8 billion, a modest decrease of 2.20%.
- Hong Kong’s surplus decreased significantly by 28.60% to USD 3.3 billion.
- Poland and Hungary both experienced notable increases, with surpluses of USD 2.6 billion (49.20% increase) and USD 2.1 billion (95.60% increase), respectively.
- This data underscores the varying performance and growth trajectories of the top countries by net export surplus in the computer device sector.
(Source: World’s Top Exports)

Laptop Shipments Statistics
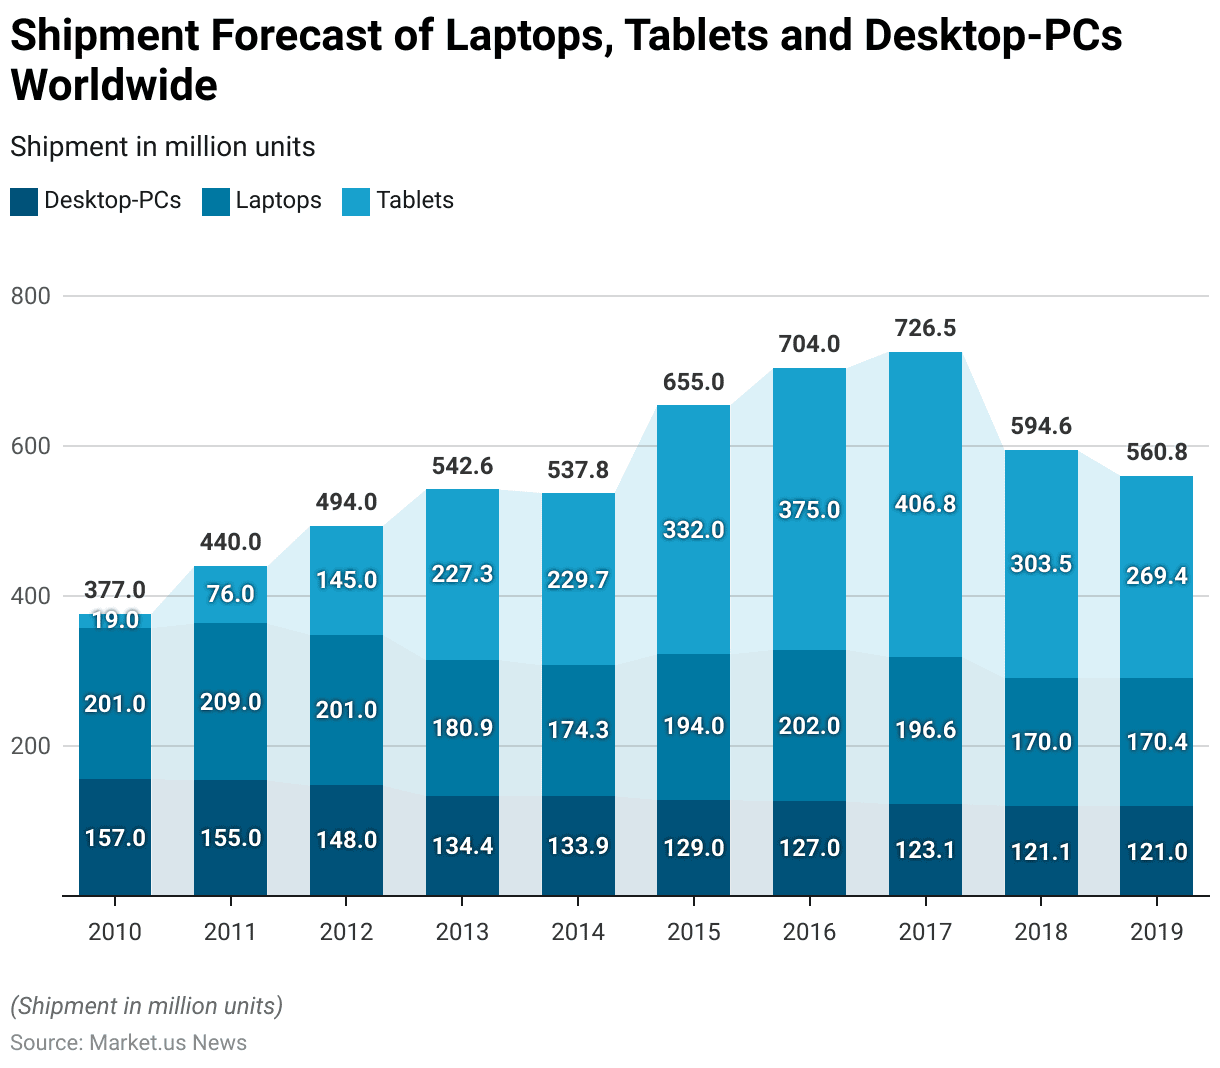
- The shipment forecast of desktops, laptops, and tablets worldwide has shown significant changes over the years.
- In 2010, desktop-PC shipments were at 157 million units, laptops at 201 million units, and tablets at 19 million units.
- By 2011, desktop-PC shipments slightly decreased to 155 million units, while laptop shipments increased to 209 million units, and tablet shipments saw a significant rise to 76 million units.
- The trend continued in 2012, with desktops at 148 million units, laptops maintaining 201 million units, and tablets surging to 145 million units.
- In 2013, desktop-PC shipments declined further to 134.4 million units, laptops to 180.9 million units, and tablets jumped to 227.3 million units.
- The following year, 2014, saw desktops at 133.85 million units, laptops at 174.28 million units, and tablets at 229.7 million units. In 2015, desktop shipments decreased to 129 million units, laptops increased to 194 million units, and tablets soared to 332 million units.
- This upward trend for tablets continued in 2016, with shipments reaching 375 million units, while desktops were at 127 million units and laptops at 202 million units.
- By 2017, desktop-PC shipments fell to 123.11 million units, laptops to 196.6 million units, and tablets reached 406.8 million units.
- However, 2018 saw a decline in tablet shipments to 303.5 million units, with desktops at 121.1 million units and laptops also decreasing to 170 million units.
- This trend persisted into 2019, with desktop-PC shipments at 121 million units, laptops slightly increasing to 170.4 million units, and tablets further declining to 269.4 million units.
- This data reflects the dynamic nature of the market and the varying consumer preferences for these devices over the years.
(Source: Statista)
Laptop Uses Statistics
Primary Use Cases for Laptop
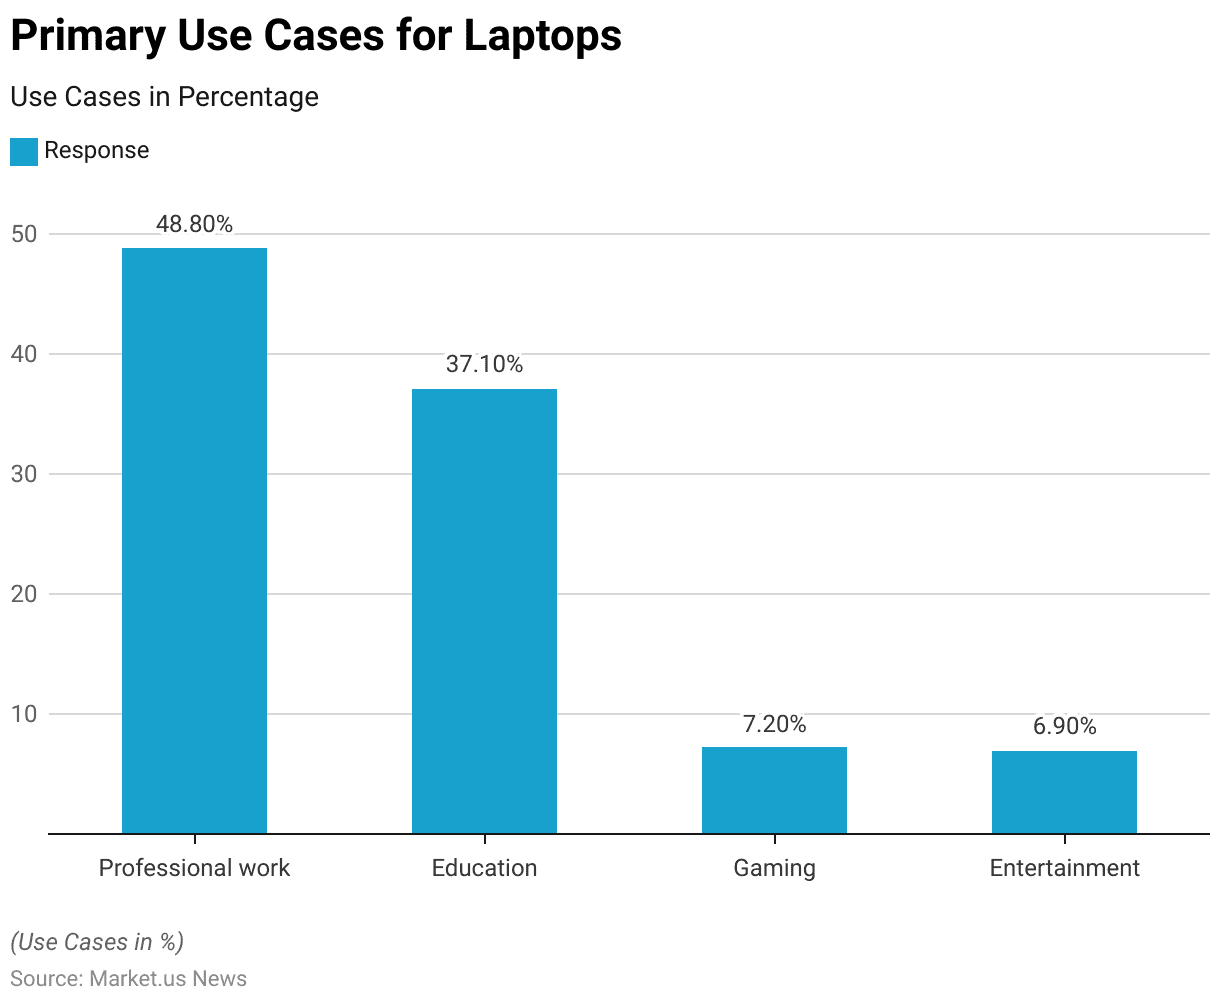
- The primary use cases for laptops highlight their versatility and importance across different sectors.
- The largest share, 48.80%, is dedicated to professional work, indicating that nearly half of all laptop usage is for business and professional purposes.
- Education follows as a significant use case, accounting for 37.10% of laptop usage, reflecting their essential role in academic settings.
- Gaming constitutes 7.20% of laptop use, demonstrating a niche but substantial market for gaming laptops.
- Lastly, entertainment purposes account for 6.90% of laptop usage, underscoring their role in providing media and recreational activities.
- This distribution showcases the diverse applications of laptops in modern society.
(Source: My Dukaan)
Top Activities on Laptops
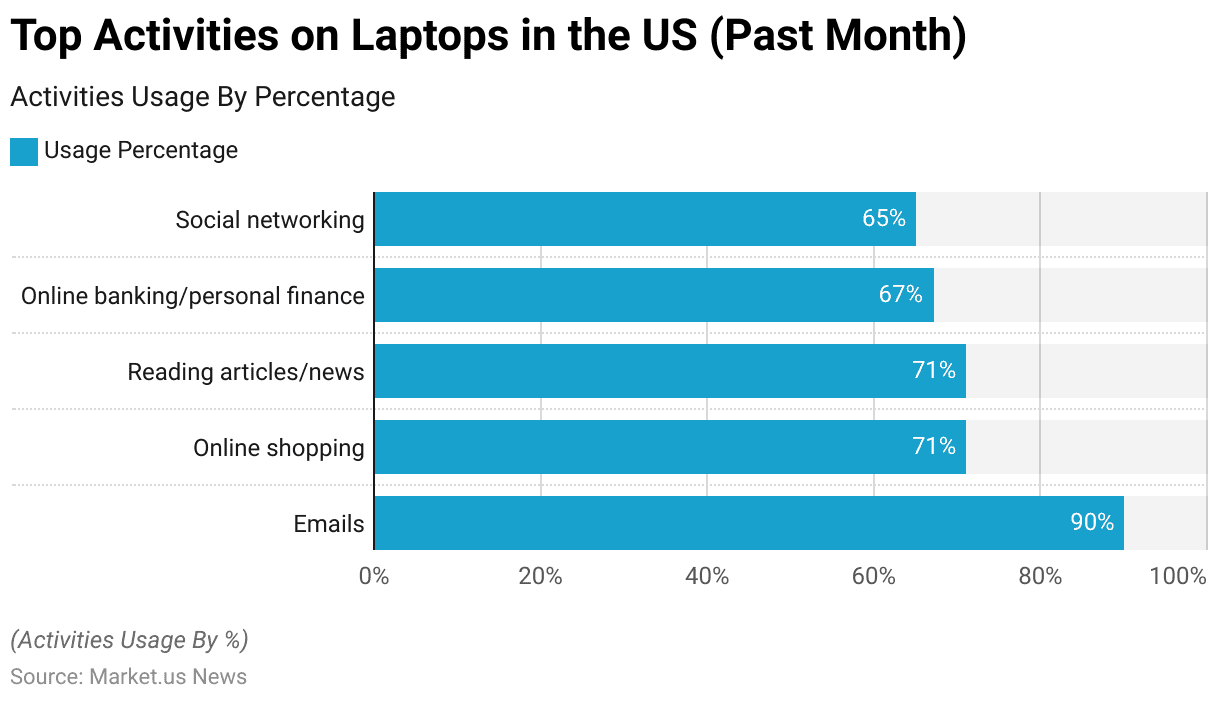
- In the past month, laptops in the US have been primarily used for a variety of activities, reflecting their integral role in daily life.
- Checking and sending emails is the most common activity, with 90% of users engaging in this task.
- Online shopping and reading articles or news are both highly popular, each with a usage rate of 71%.
- Online banking and managing personal finances are closely followed, with 67% of users utilizing their laptops for these purposes.
- Social networking is also a significant activity, with 65% of users engaging in it.
- This data highlights the diverse and essential functions that laptops serve for users in the US.
(Source: Kantar)
Consumer Preferences and Trends in Laptop Brands
Laptop Brand Preferences – By Age Group
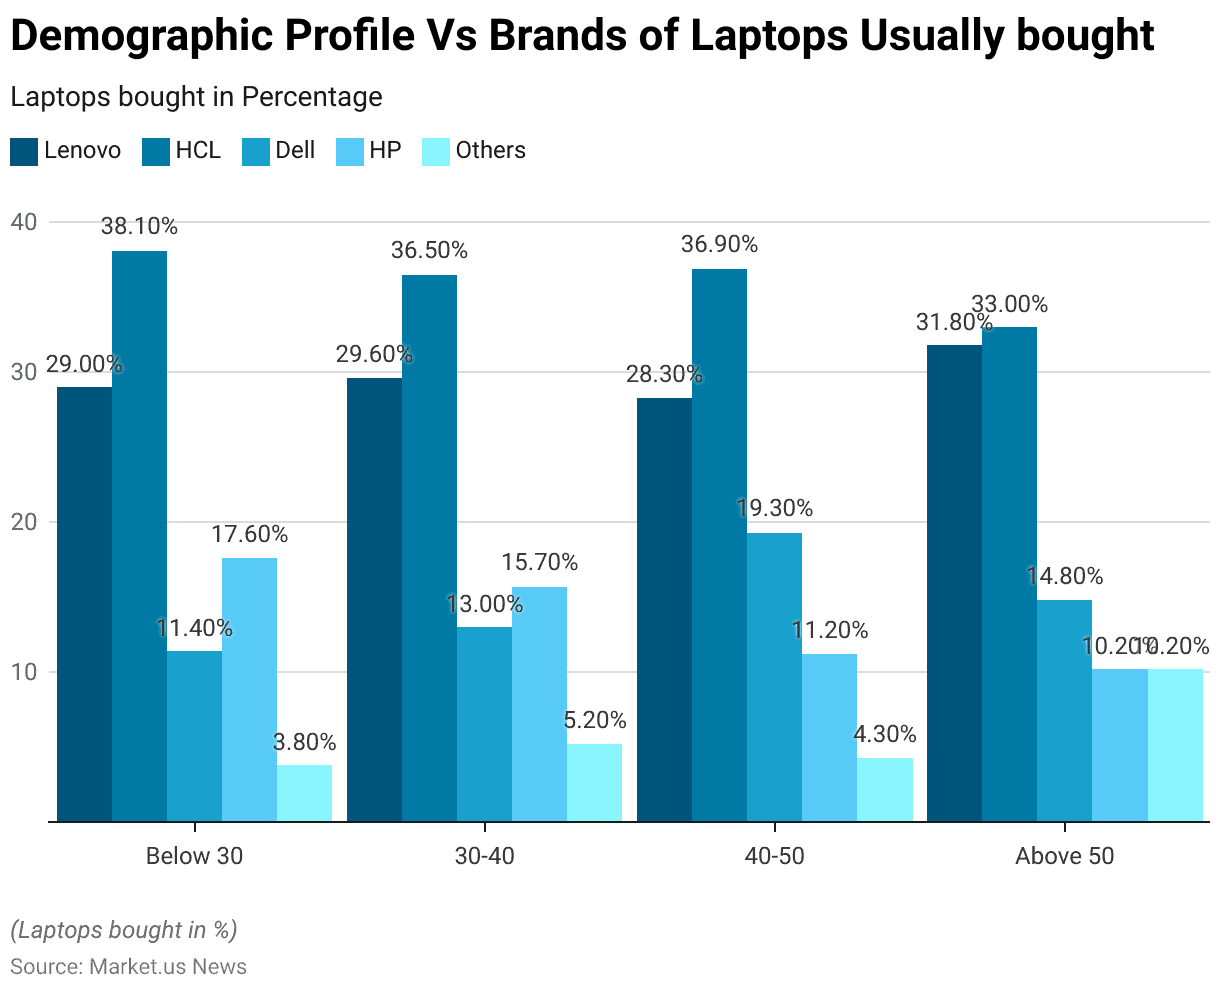
- The demographic profile of laptop buyers reveals distinct brand preferences across various age groups.
- Among individuals below 30 years, 29% prefer Lenovo, 38.10% opt for HCL, 11.40% choose Dell, 17.60% select HP, and 3.80% go for other brands.
- For the 30-40 age group, 29.60% favor Lenovo, 36.50% prefer HCL, 13% opt for Dell, 15.70% select HP, and 5.20% choose other brands.
- In the 40-50 age group, 28.30% prefer Lenovo, 36.90% choose HCL, 19.30% favor Dell, 11.20% select HP, and 4.30% opt for other brands.
- Among those above 50 years, 31.80% favor Lenovo, 33% opt for HCL, 14.80% choose Dell, 10.20% select HP, and 10.20% prefer other brands.
- This data illustrates how brand preferences vary significantly with age, with HCL being notably popular across all age groups and Lenovo showing a strong preference among older consumers.
(Source: International Journal of Pure and Applied Mathematics)
Laptop Brand Preferences – By Occupation
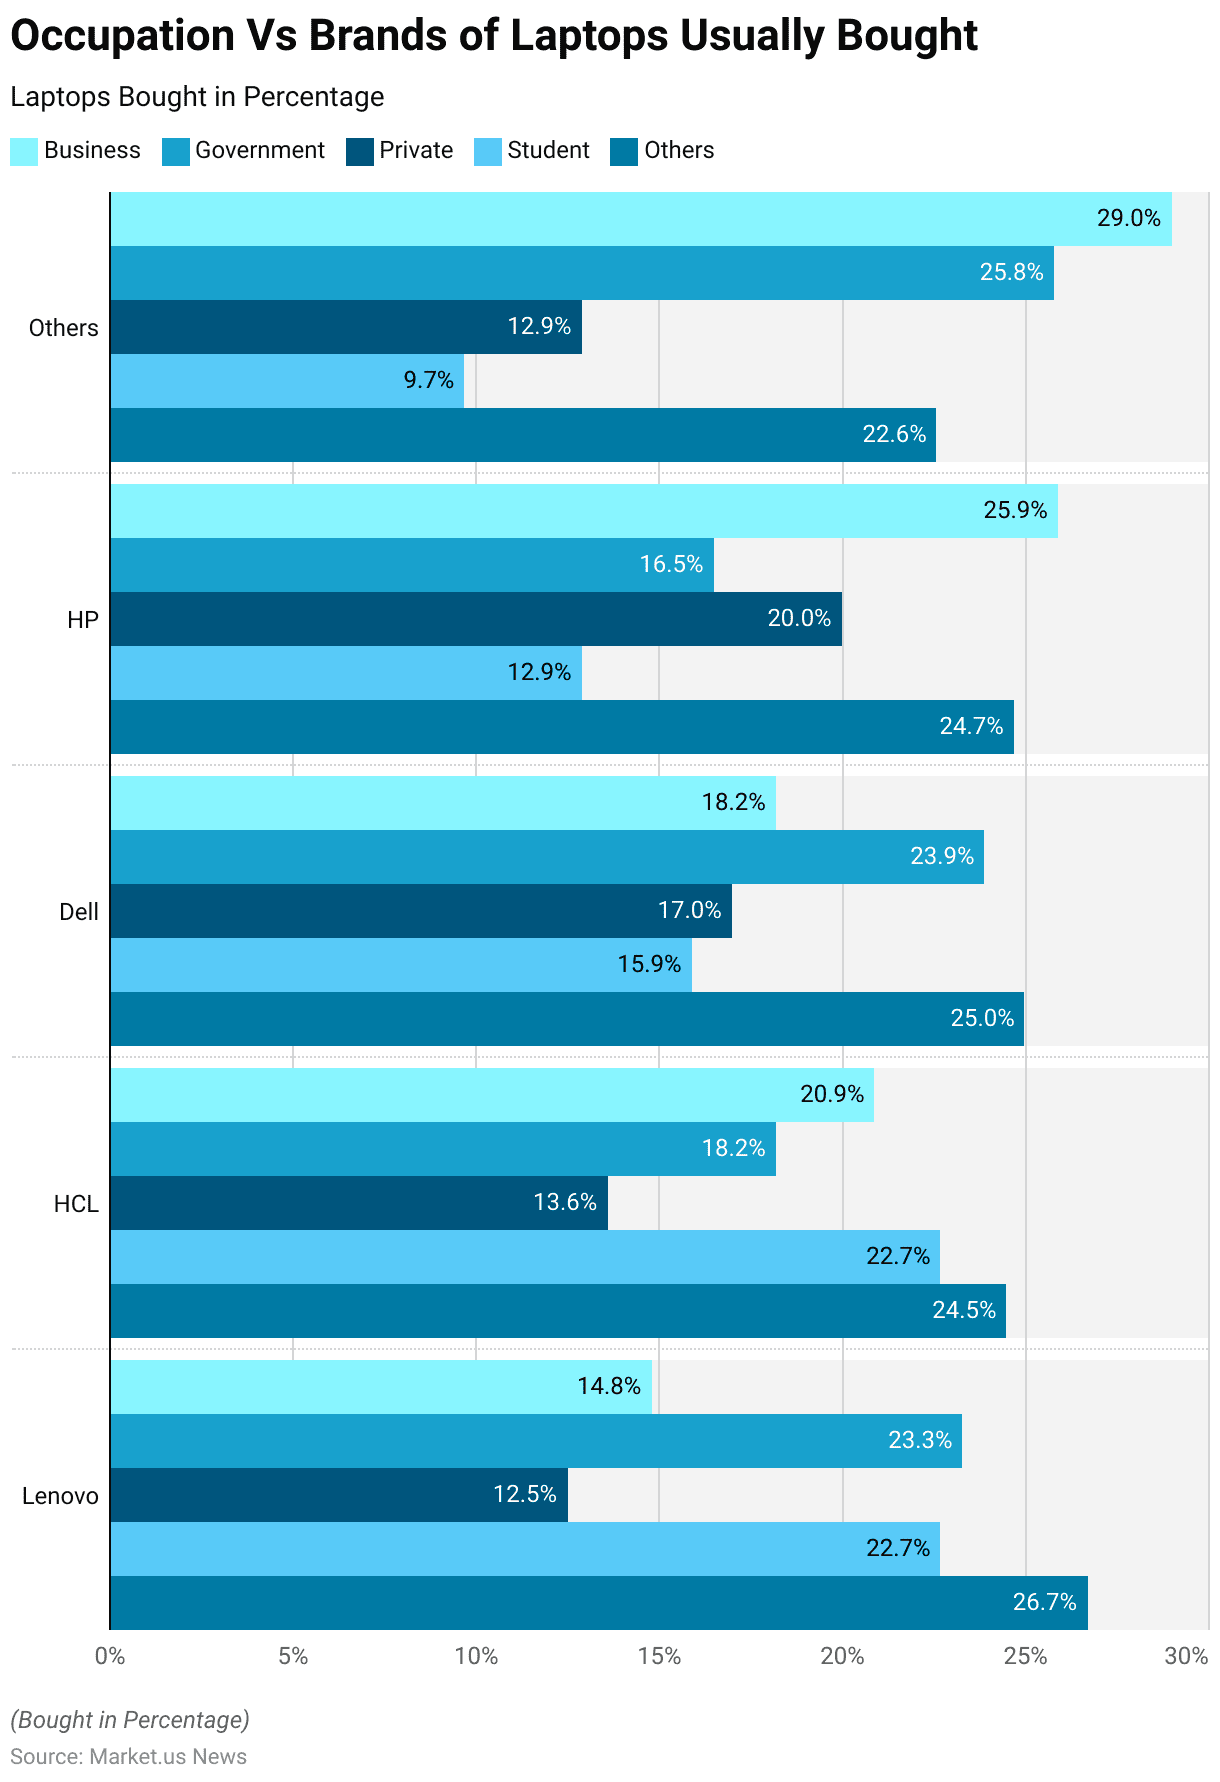
- The preference for laptop brands varies notably across different occupational groups.
- Among business professionals, HP is the most preferred brand, with 25.90% opting for it, followed by Dell at 18.20%, HCL at 20.90%, Lenovo at 14.80%, and other brands at 29%.
- In the government sector, Dell leads with 23.90%, closely followed by Lenovo at 23.30%, HCL at 18.20%, HP at 16.50%, and other brands at 25.80%.
- For private sector employees, HP again takes the lead with 20%, followed by Dell at 17%, Lenovo at 12.50%, HCL at 13.60%, and other brands at 12.90%.
- Students show a strong preference for Lenovo and HCL, each with 22.70%, while Dell is chosen by 15.90%, HP by 12.90%, and other brands by 9.70%.
- Among other occupations, Lenovo is favored by 26.70%, followed by HCL at 24.50%, Dell at 25%, HP at 24.70%, and other brands at 22.60%.
- This data highlights the varied brand preferences across different occupational segments, with Lenovo and HCL being particularly popular among students and other diverse occupational groups.
(Source: International Journal of Pure and Applied Mathematics)
Key Attributes Considered by Users While Buying a Laptop
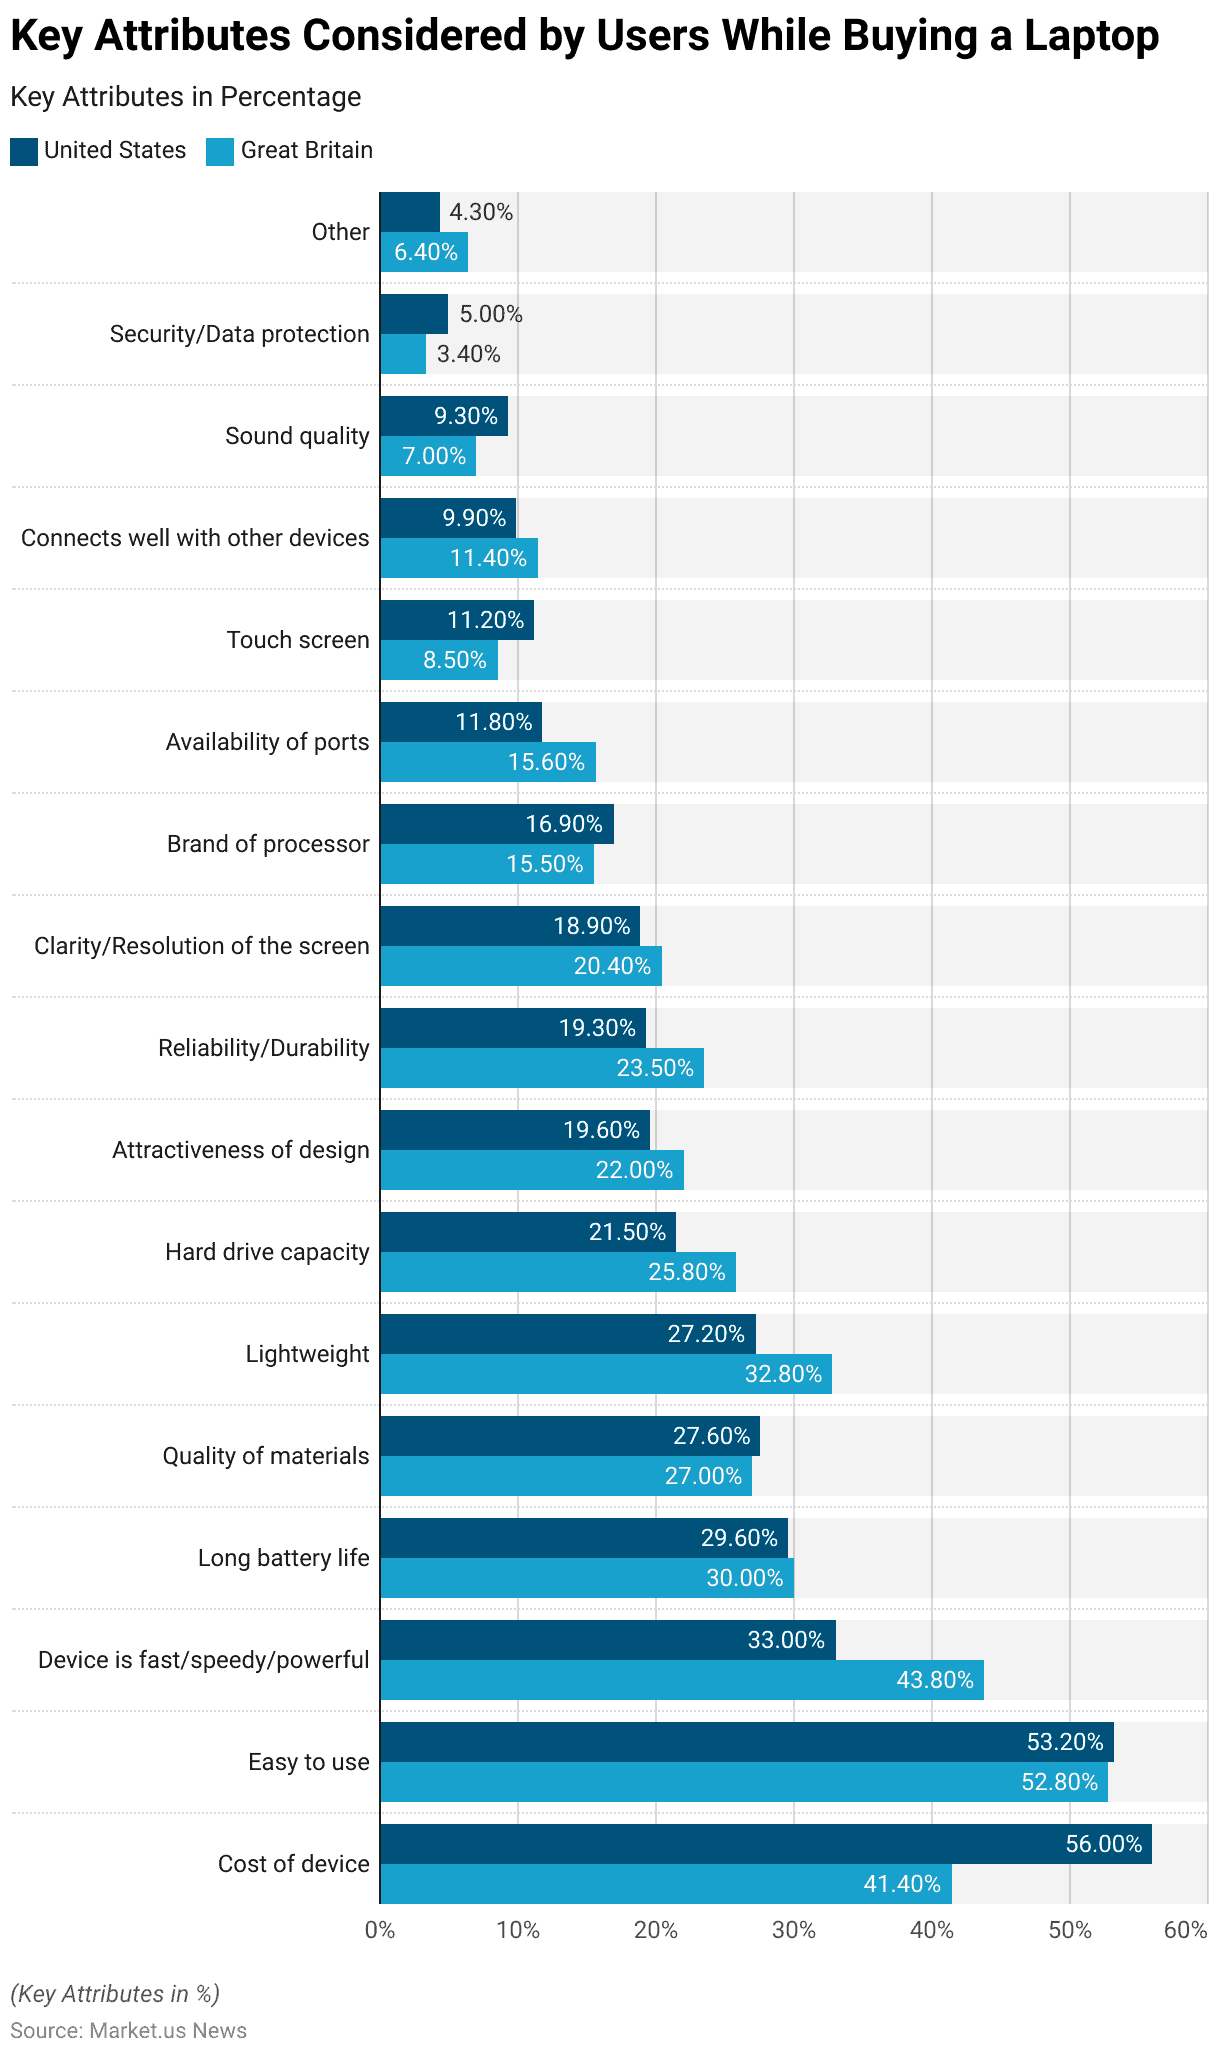
- When purchasing a laptop, users in the United States and Great Britain prioritize different key attributes.
- In the United States, the cost of the device is the most important factor, considered by 56% of users, followed by ease of use at 53.20%.
- The device’s speed and power are significant at 33%, while long battery life is important at 29.60%. Quality of materials (27.60%), lightweight design (27.20%), and hard drive capacity (21.50%) are also crucial considerations.
- The attractiveness of design (19.60%), reliability and durability (19.30%), and screen clarity and resolution (18.90%) are valued by many users.
- Other factors include the brand of processor (16.90%), availability of ports (11.80%), touchscreen capability (11.20%), connectivity with other devices (9.90%), sound quality (9.30%), and security/data protection (5%). Additionally, 4.30% of users consider other attributes.
More Attributes
- In Great Britain, ease of use is a top priority for 52.80% of users, closely followed by the cost of the device at 41.40%.
- The speed and power of the device are important to 43.80%, and long battery life is important for 30% of users.
- Lightweight design (32.80%), hard drive capacity (25.80%), and reliability and durability (23.50%) are key attributes for many British users.
- The attractiveness of design (22%), screen clarity and resolution (20.40%), and quality of materials (27%) are also significant.
- Other considerations include the brand of processor (15.50%), availability of ports (15.60%), connectivity with other devices (11.40%), touch screen capability (8.50%), sound quality (7%), and security/data protection (3.40%).
- Additionally, 6.40% of users consider other attributes. This data highlights the similarities and differences in laptop purchasing priorities between users in the United States and Great Britain.
(Source: Kantar)
Impact of COVID-19
- In March 2020, the coronavirus (COVID-19) outbreak significantly impacted laptop sales growth in Russia, with notable differences observed among various brands in both monetary and real terms.
- Asus experienced a 23% growth in monetary terms and a 24% growth in real terms, indicating a strong performance during this period.
- Lenovo saw a 17% increase in monetary terms and an even higher growth of 22% in real terms.
- HP achieved a 21% growth in real terms, although specific monetary growth data is not provided.
- Acer reported an 18% growth in monetary terms, with no corresponding real terms data available.
- This data highlights the varying degrees of sales growth experienced by different laptop brands in the Russian market during the early stages of the pandemic.
(Source: Statista)
Barriers and Challenges
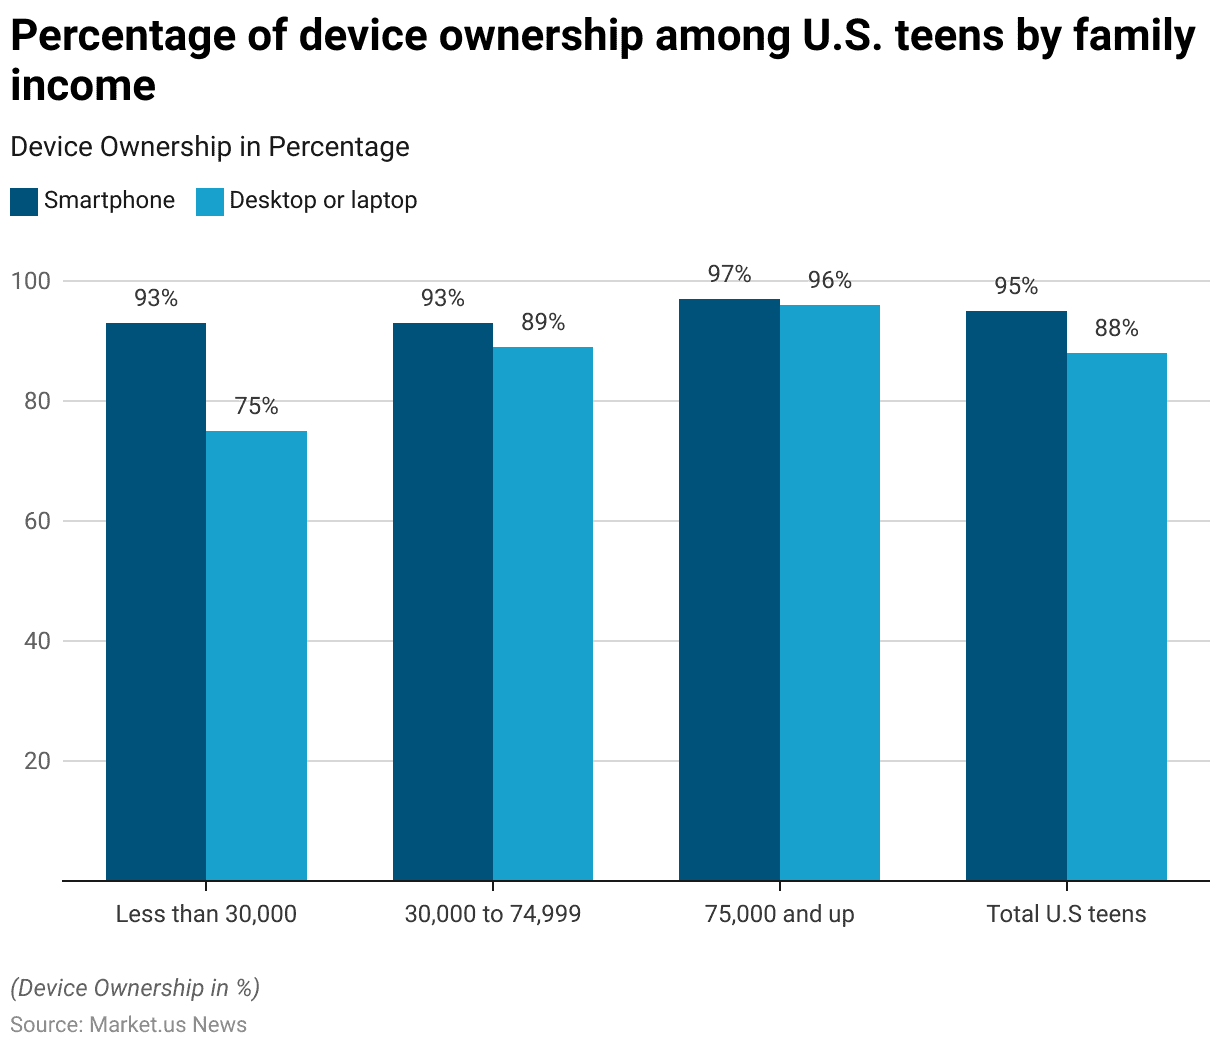
- Income significantly impacts laptop ownership among U.S. teens, revealing disparities across different income groups.
- Among teens from families with an income of less than USD 30,000, 93% own a smartphone, but only 75% own a desktop or laptop.
- In the income bracket of USD 30,000 to USD 74,999, smartphone ownership remains steady at 93%, while desktop or laptop ownership increases to 89%.
- For teens from families earning USD 75,000 and above, 97% own a smartphone, and 96% have a desktop or laptop.
- On average, 95% of all U.S. teens own a smartphone, while 88% own a desktop or laptop.
- This data underscores the influence of family income on the accessibility of laptops for teens in the United States.
(Source: Statista)
Key Investment Trends
- Investment in laptop development in 2024 has seen significant contributions from major technology companies, focusing on innovations such as AI integration and sustainable design.
- Companies like Apple, Dell, and Microsoft are leading the charge with substantial funding towards enhancing AI capabilities in their laptop offerings.
- For instance, Microsoft is leveraging its investments in AI to integrate features like Office 365 Copilot, enhancing productivity tools with advanced AI functionalities.
- Meanwhile, Framework has raised $44 million to develop eco-friendly laptops that are customizable and repairable by users, reflecting a growing trend towards sustainable technology.
- Additionally, advancements in system-on-chip (SoC) technology, driven by companies like Intel and Broadcom, are further propelling laptop performance by integrating more powerful and energy-efficient components.
- These investments underscore the industry’s commitment to innovation and sustainability, shaping the future of laptop technology.
(Source: Investopedia, Pitchbook)
Regulations for Laptops
- Laptop regulations vary significantly across countries, reflecting diverse security, economic, and legal concerns.
- In India, stringent import restrictions have been imposed to boost local manufacturing, requiring firms to obtain government permission before importing laptops. However, basic customs duties remain at zero due to commitments under the Information Technology Agreement of 1997.
- In Bangladesh, travelers must declare laptops upon arrival, with proper documentation such as passports, visas, and commercial invoices to avoid fines or confiscation.
- Peru allows each traveler to bring one laptop duty-free, emphasizing the need for proper declarations to prevent issues at customs.
- Ethiopia mandates that laptops be declared both upon entry and exit, aligning with its broader customs policies aimed at regulating electronic imports and ensuring compliance.
- Similarly, Bulgaria requires laptops to be declared, supporting a regulatory framework that balances import control and compliance.
- These regulations underscore the importance of understanding and adhering to local customs laws to facilitate smooth international travel and trade involving laptops.
(Source: India Briefing, The Techy Life, How to Peru, Hinterland Travel, International Trade Association)
Recent Developments
Acquisitions and Mergers:
- HP acquires HyperX: In early 2023, HP completed its acquisition of HyperX, the gaming division of Kingston Technology, for $425 million. This move aims to enhance HP’s gaming laptop portfolio by integrating HyperX’s high-performance gaming peripherals.
- Lenovo acquires Fujitsu’s PC business: Lenovo acquired a majority stake in Fujitsu’s PC business in late 2023 for $269 million, strengthening its position in the global laptop market and expanding its product offerings in Asia.
New Product Launches:
- Apple MacBook Pro with M3 Chip: Apple launched the MacBook Pro with the new M3 chip in October 2023, featuring significant performance improvements, enhanced graphics capabilities, and extended battery life.
- Dell XPS 13 Plus: Dell introduced the XPS 13 Plus in January 2024, showcasing a redesigned keyboard, edge-to-edge display, and the latest Intel Core processors, aiming to provide a high-performance laptop for professionals.
Funding:
- Framework raises $75 million: Framework, a company focused on creating modular, repairable laptops, secured $75 million in a Series B funding round in 2023 to expand its product line and promote sustainable computing.
- Razer secures $100 million: Gaming laptop manufacturer Razer raised $100 million in funding in early 2024 to develop new gaming hardware and enhance its R&D capabilities.
Technological Advancements:
- OLED Displays: There has been an increased adoption of OLED displays in laptops, providing better color accuracy, contrast, and power efficiency compared to traditional LCDs. Major brands like ASUS and HP have launched new models featuring OLED screens.
- AI-Powered Features: AI integration in laptops is on the rise, with features like adaptive battery management, real-time performance optimization, and AI-enhanced security becoming standard in high-end models.
Market Dynamics:
- Growth in Laptop Sales: The global laptop market saw a 15% year-over-year growth in sales in 2023, driven by increased demand for remote work and online learning solutions.
- Shift to Hybrid Work Models: Companies adopting hybrid work models are driving the demand for high-performance, portable laptops that support both in-office and remote work environments.
Regulatory and Strategic Developments:
- Right to Repair Legislation: The European Union and several US states have introduced “Right to Repair” laws, requiring manufacturers to provide repair manuals and spare parts, promoting the longevity and sustainability of laptops.
- Energy Efficiency Standards: New energy efficiency standards for laptops have been implemented in various regions, pushing manufacturers to develop more energy-efficient devices to meet regulatory requirements.
Research and Development:
- Advancements in Battery Technology: R&D efforts are focusing on developing solid-state batteries for laptops, which promise higher energy density, faster charging times, and improved safety compared to traditional lithium-ion batteries.
- Foldable and Dual-Screen Laptops: Innovations in foldable and dual-screen laptop designs are gaining traction, with companies like Lenovo and Microsoft exploring new form factors to enhance multitasking and productivity.
Conclusion
Laptop Statistics – Laptops are crucial in both personal and professional settings due to their versatility, portability, and strong performance.
The market has evolved with advancements in AI and cloud computing, led by companies like Microsoft, Apple, and Lenovo, which invest heavily in R&D.
When choosing a laptop, consider the use case, performance, portability, and budget. Future innovations, especially in AI, will further enhance user experiences and device efficiency.
The diverse options available cater to gaming, business, education, and general use, ensuring laptops remain a key technology for the foreseeable future.
FAQs
Typically, laptops can last between 3 to 5 years. However, if your laptop is significantly slowing down, no longer supports the latest software, or doesn’t meet your performance needs, it might be time to consider an upgrade.
The GPU (Graphics Processing Unit) is crucial for tasks that require high graphical performance, such as gaming, video editing, and 3D rendering. For general use, an integrated GPU is sufficient, but for gaming or professional graphic work, a dedicated GPU is recommended.
Some components, such as RAM and storage, can often be upgraded in many laptops. However, CPUs and GPUs are usually soldered onto the motherboard in most modern laptops, making them difficult or impossible to upgrade.
Modern laptops are designed to be used while charging. It does not harm the battery.
By connecting a monitor, keyboard, and mouse, you can use your laptop as a desktop. Docking stations can simplify this setup.
Discuss your needs with our analyst
Please share your requirements with more details so our analyst can check if they can solve your problem(s)