

Table of Contents
- Introduction
- Editor’s Choice
- Department Stores Market Statistics
- Sales and Revenue of Leading Department Store Companies
- Number of Department Stores in Various Countries Statistics
- Department Store Visits Statistics
- Department Store Sales in Different Nations
- Department Store Product Sales
- Department Store Discount Statistics
- Popular Department Stores in Various Countries Statistics
- Consumer Attitudes Towards Department Stores Statistics
- Challenges and Concerns
- Regulations for Department Stores
- Recent Developments
- Conclusion
- FAQs
Introduction
Department Stores Statistics: Department stores are large retail establishments that offer a wide variety of products, including clothing, electronics, home goods, and cosmetics, all under one roof.
They are organized into different sections or departments and typically cater to a broad customer base with mid-range to premium pricing.
While many department stores focus on customer service and in-store promotions, they are increasingly adopting e-commerce strategies to stay competitive in the face of growing online shopping trends.
The shift to omnichannel retailing, which blends in-store and online shopping, is a key strategy for adapting to changing consumer behaviors.
Editor’s Choice
- The global department stores market size is projected to reach USD 208.1 billion by 2032.
- In 2023, the global department store sector was led by major chains, with Macy’s topping the list at €21,549 million in revenue.
- As of April 2023, shoppers in South Korea prioritized the variety of brands and shops, with 45.1% citing it as the most important factor when visiting department stores.
- From May 2022 to May 2023, Walmart led global general merchandise and discount stores with 611.29 billion USD in sales, outpacing its competitors.
- In Q4 2023, Costco was the most popular general merchandise department store in the U.S., with 69% of respondents expressing a positive opinion.
- In 2020, consumer attitudes towards department stores in Canada varied, with 68.17% of respondents valuing the wide product variety offered under one roof.
- In 2023, department store operators in China faced significant challenges, with 86.3% of enterprises citing the weakening of consumer spending as the most pressing issue, driven by economic pressures and changing consumption patterns.
Department Stores Market Statistics
Global Department Stores Market Size Statistics
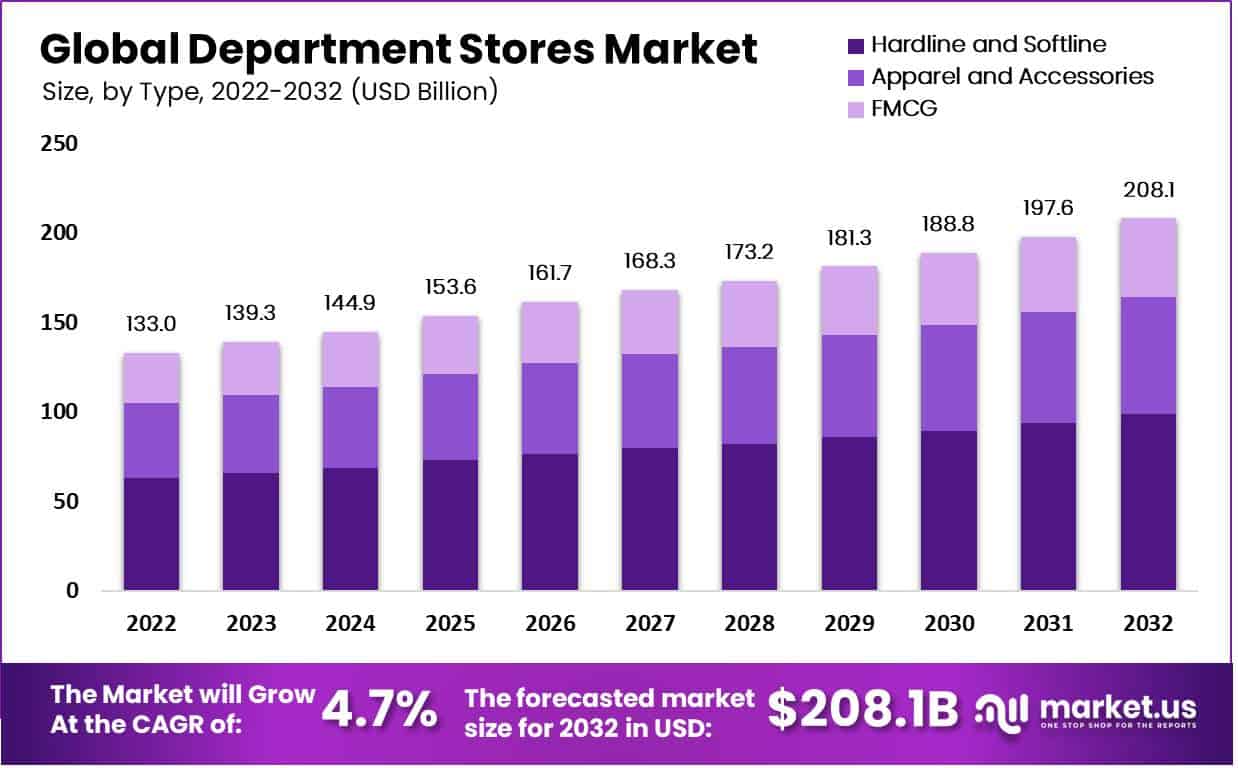
- The global department stores market has demonstrated consistent growth over the past several years at a CAGR of 4.7%, with a market size reaching USD 133.0 billion in 2022.
- This growth trajectory has continued into 2023, expanding to USD 139.3 billion, and is expected to further increase to USD 144.9 billion in 2024.
- Looking ahead, the market is projected to see steady gains, with estimates suggesting it will reach USD 153.6 billion by 2025 and USD 161.7 billion by 2026.
- The growth continues into the following years, with the market forecasted to expand to USD 168.3 billion by 2027 and USD 173.2 billion by 2028.
- By 2029, the market size is expected to reach USD 181.3 billion, and this upward trend will continue, with USD 188.8 billion in 2030.
- The market is anticipated to grow further to USD 197.6 billion by 2031, and by 2032, it is expected to reach USD 208.1 billion.
- This steady growth reflects the ongoing resilience and expansion of the global department stores sector, driven by both the recovery of retail markets post-pandemic and the increasing consumer demand for diverse and accessible shopping experiences.
(Sources: market.us)
Global Department Stores Market Size – By Type Statistics
2022-2025
- The global department stores market is composed of three primary product categories: hardline and softline, apparel and accessories, and FMCG (fast-moving consumer goods).
- In 2022, the total market size was valued at USD 133.0 billion, with the hardline and softline segment leading at USD 63.18 billion, followed by apparel and accessories at USD 41.63 billion, and FMCG at USD 28.20 billion.
- In 2023, the total market size grew to USD 139.3 billion, with hardline and softline increasing to USD 66.17 billion, apparel and accessories to USD 43.60 billion, and FMCG to USD 29.53 billion.
- The market continues its upward trajectory, with projections for 2024 forecasting a total market size of USD 144.9 billion, driven by hardline and softline reaching USD 68.83 billion, apparel and accessories USD 45.35 billion, and FMCG USD 30.72 billion.
- The growth persists through the following years, with the total market size expected to reach USD 153.6 billion by 2025, largely fueled by hardline and softline, which will account for USD 72.96 billion.
2026-2032
- By 2026, the market is projected to grow to USD 161.7 billion, with the same product categories continuing to drive growth, reaching USD 76.81 billion for hardline and Softline, USD 50.61 billion for apparel and accessories, and USD 34.28 billion for FMCG.
- In the subsequent years, the market is expected to grow steadily, with the total reaching USD 168.3 billion by 2027, USD 173.2 billion by 2028, and USD 181.3 billion by 2029.
- By 2030, the market will further expand to USD 188.8 billion, driven by all three segments, with hardline and softline contributing USD 89.68 billion, apparel and accessories USD 59.09 billion, and FMCG USD 40.03 billion.
- The growth continues, with the total market size projected to reach USD 197.6 billion in 2031 and, finally, USD 208.1 billion in 2032.
- This steady expansion is indicative of the increasing consumer demand across these categories, with hardline and softline maintaining their leading share throughout the forecast period.
(Sources: market.us)

Global Department Stores Market Share – By Size Statistics
- In 2022, the global department stores market was divided into two primary segments based on store size: large and small department stores.
- The large department stores dominated the market, accounting for 68% of the total market share.
- These stores, often characterized by their extensive product offerings, larger floor spaces, and wide geographic reach, significantly contributed to the overall growth and development of the department store sector.
- In contrast, small department stores made up 32% of the market share.
- While smaller in size, these stores often cater to specific regional or niche markets, providing a more personalized shopping experience. Despite their smaller footprint, they continue to play a crucial role in the retail landscape, appealing to customers seeking convenience and localized offerings.
(Sources: market.us)
Sales and Revenue of Leading Department Store Companies
Sales of the Leading Department Store Companies Worldwide in 2022/23
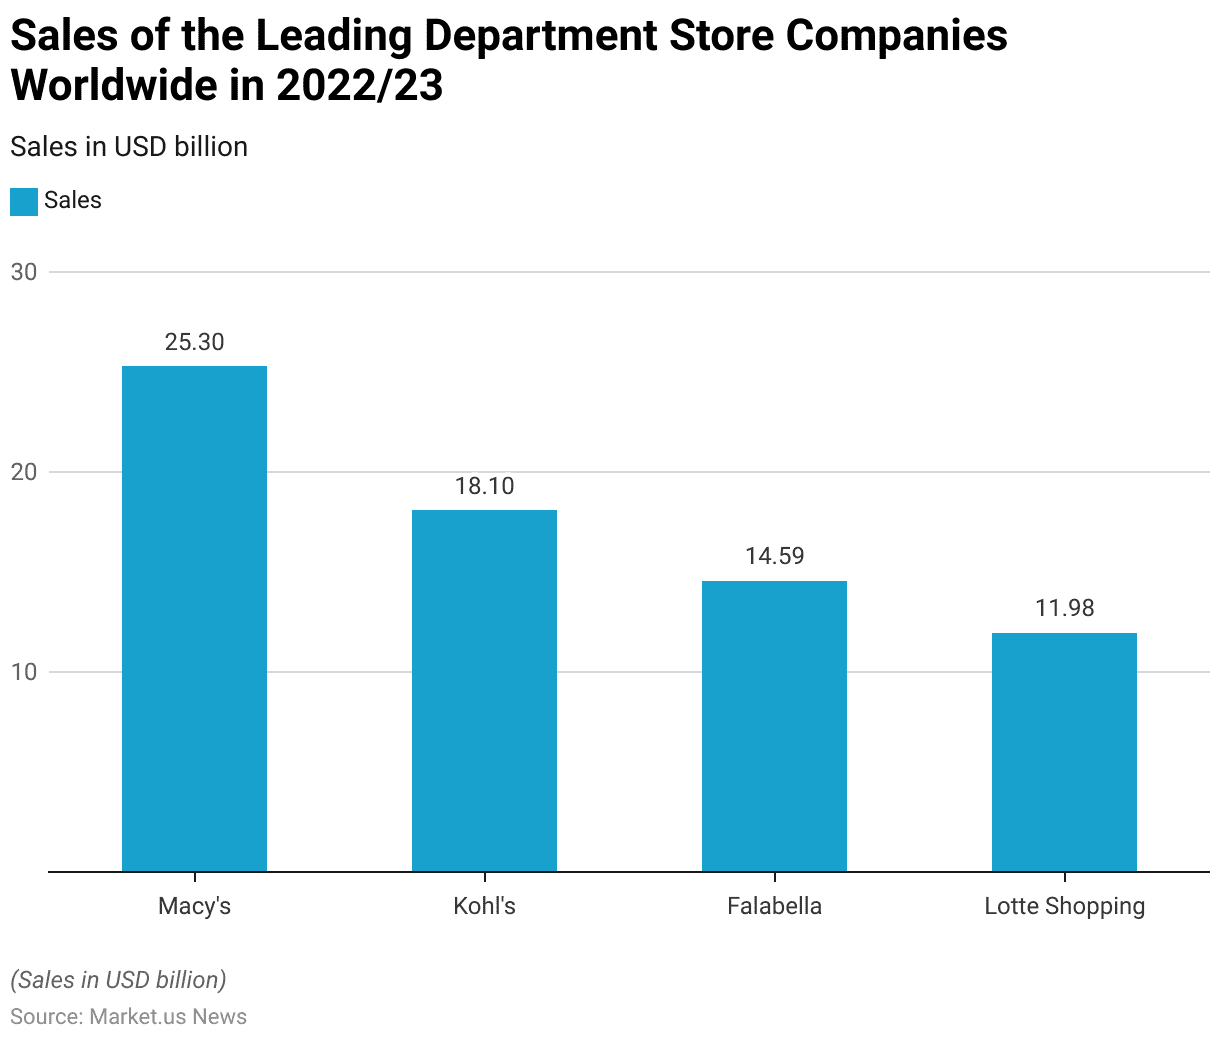
- In 2022/23, several leading department store companies worldwide achieved significant sales figures, contributing to the overall growth of the global department store market.
- Macy’s, one of the most well-known department store chains in the U.S., led the pack with USD 25.3 billion in sales.
- Following closely, Kohl’s, another major U.S. department store, recorded USD 18.1 billion in sales.
- Meanwhile, Falabella, a prominent retail chain based in Latin America, achieved sales of USD 14.59 billion, marking its strong position in the region.
- Lotte Shopping, a major player in South Korea, generated USD 11.98 billion in sales, reflecting its influence in the Asian retail market.
- These companies represent the diversity and scale of the global department store sector, with each contributing significantly to their respective markets through a range of product offerings, customer engagement strategies, and global expansion efforts.
(Source: Statista)
Revenue of the Leading Department Store Chains Worldwide in 2023
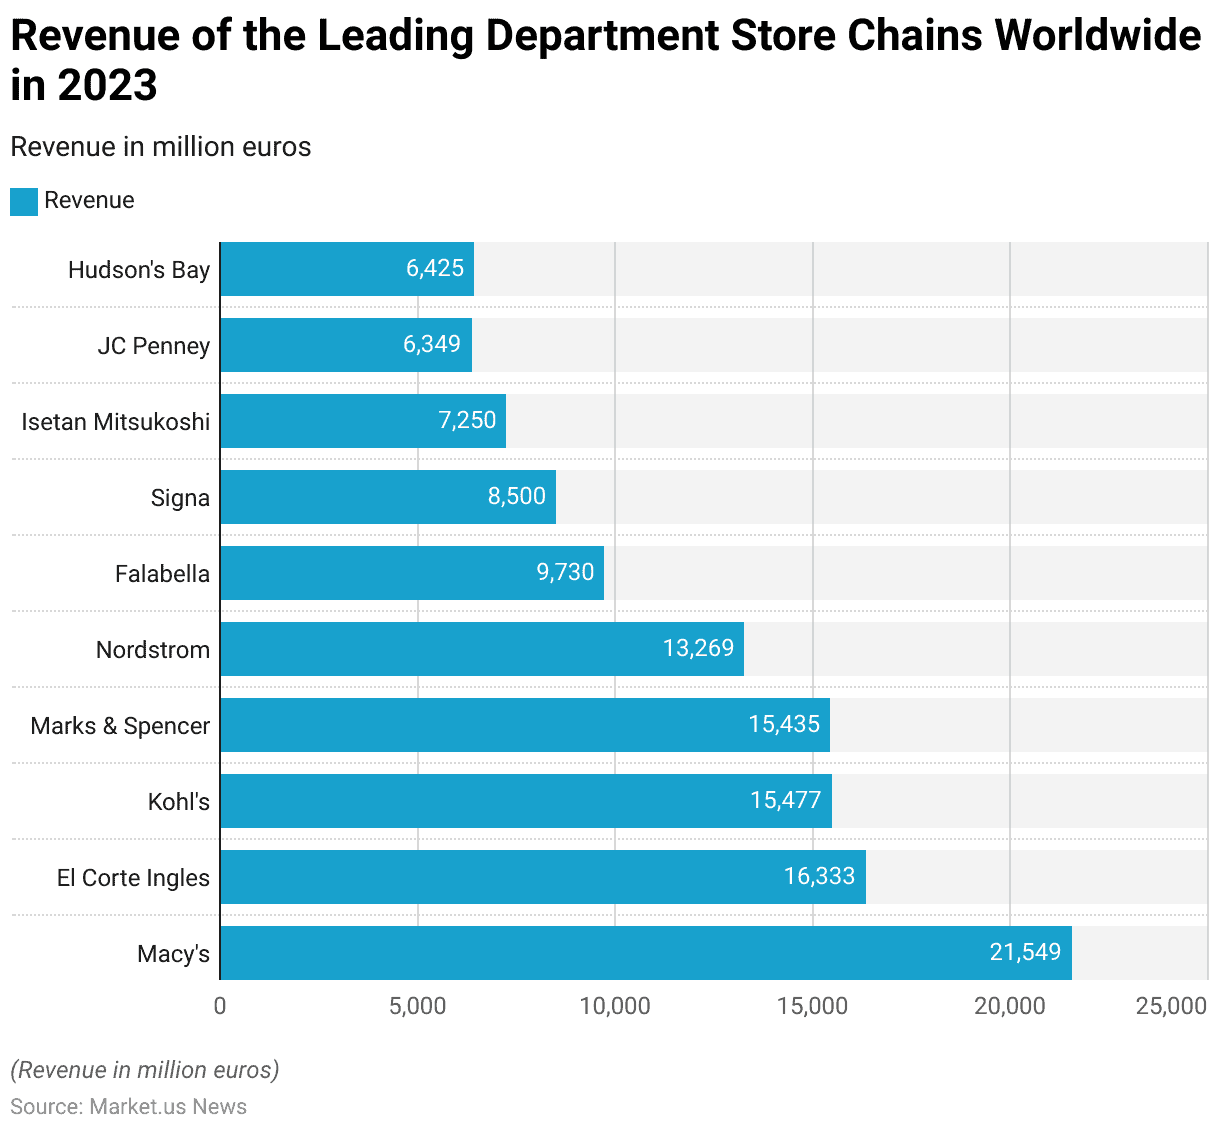
- In 2023, the global department store sector was led by several prominent chains, each generating substantial revenue.
- Macy’s, the well-established U.S.-based department store, topped the list with €21,549 million in revenue.
- Close behind was El Corte Inglés, Spain’s leading department store, which reported €16,333 million in revenue.
- Kohl’s, another major U.S. retailer, generated €15,477 million, while Marks & Spencer, a British retailer, achieved €15,435 million.
- Nordstrom, a key player in the North American market, earned €13,269 million, highlighting its strong presence in the high-end retail segment.
- Other significant players included Falabella from Latin America, which posted €9,730 million, and Signa, an Austrian company, which generated €8,500 million in revenue.
- Isetan Mitsukoshi, a leading department store group in Japan, earned €7,250 million, and JC Penney, a well-known U.S. retailer, recorded €6,349 million.
- Lastly, Hudson’s Bay, another major Canadian retailer, generated €6,425 million in 2023.
- These figures underscore the global reach and competitive nature of the department store industry, with leading companies driving strong revenues through diverse product offerings and a focus on both physical and online retail experiences.
(Source: Statista)
Number of Department Stores in Various Countries Statistics
United States
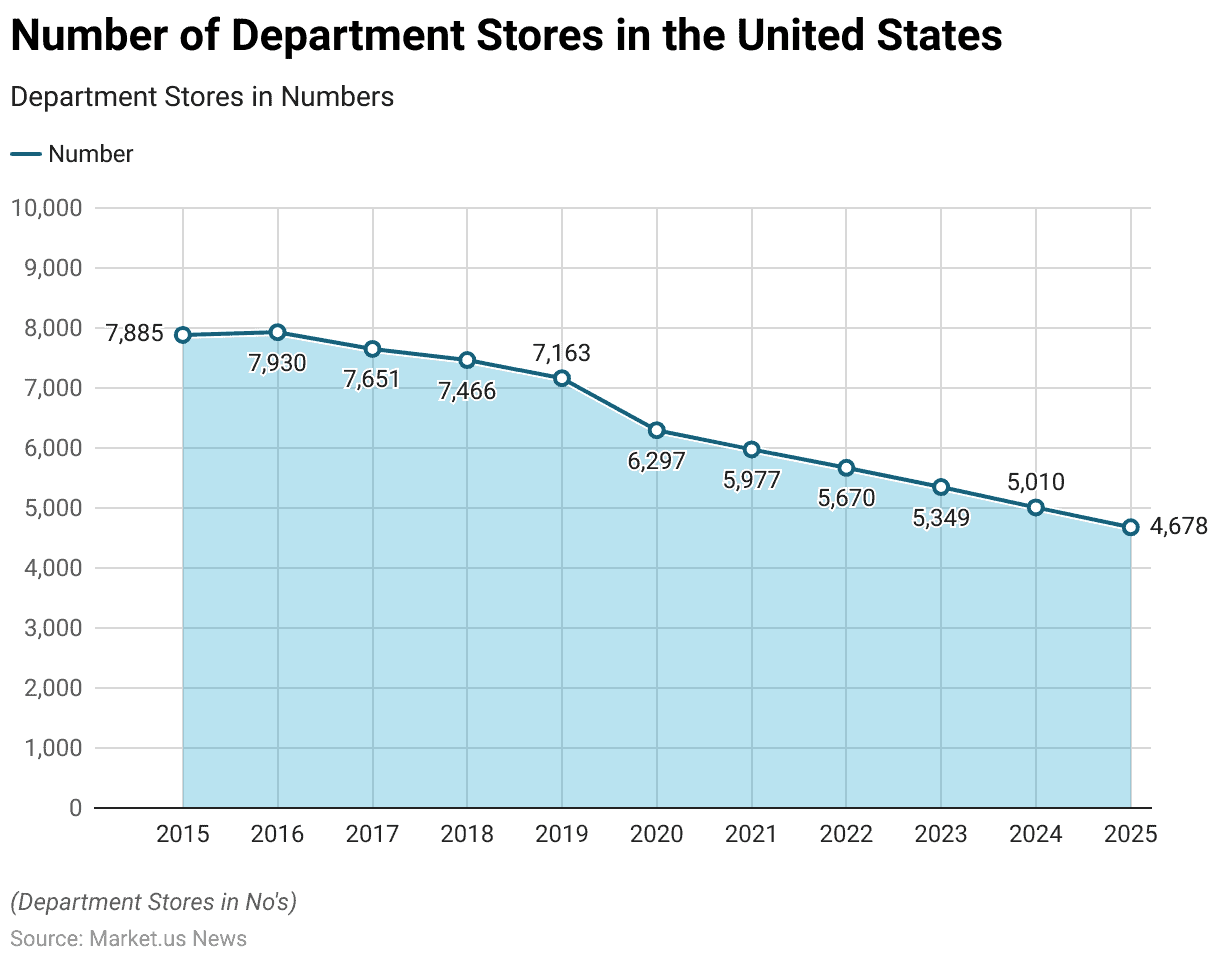
- The number of department stores in the United States has seen a steady decline from 2015 to 2025, reflecting broader shifts in consumer behavior and the retail landscape.
- In 2015, the U.S. had 7,885 department stores, a number that slightly increased to 7,930 in 2016.
- However, from 2017 onward, the number of stores began to decrease, with 7,651 department stores recorded in 2017 and a further drop to 7,466 in 2018.
- By 2019, the number had decreased to 7,163, and the decline accelerated in the following years, with 6,297 stores in 2020, largely due to the impacts of the COVID-19 pandemic and the subsequent shift to online shopping.
- In 2021, the number of department stores fell to 5,977, and by 2022, it had further decreased to 5,670.
- The downward trend continued into 2023, with only 5,349 department stores remaining, and projections suggest that by 2024, this number will drop to 5,010.
- By 2025, the number of department stores in the U.S. is expected to decline further to 4,678, indicating a long-term contraction in the traditional department store model.
- This reduction reflects the ongoing transformation in the retail sector, with many stores either closing or shifting to a more e-commerce-focused model as consumer preferences increasingly favor online shopping over brick-and-mortar locations.
(Source: Statista)
China
- The total number of department stores in China has experienced notable fluctuations between 2012 and 2022, reflecting the evolving retail environment and changing consumer preferences.
- In 2012, China had 4,342 department stores, and the number gradually increased over the next few years, reaching 4,524 in 2013 and 4,684 in 2014.
- The growth continued into 2015, with 4,847 department stores, and peaked at 6,037 in 2016, as the retail sector expanded rapidly during that period.
- However, the following years saw a decline in the number of department stores. In 2017, the number dropped to 5,894, and by 2018, it had decreased further to 4,224.
- The trend continued with 4,148 stores in 2019 before experiencing a rebound in 2020, when the total number rose to 5,732, likely driven by a resurgence in consumer spending as the country recovered from the pandemic.
- In 2021, the number of department stores decreased to 4,540, and by 2022, it slightly increased to 4,559.
- This fluctuation in the number of department stores highlights the changing dynamics of China’s retail sector, which has been influenced by factors such as rapid urbanization, the growth of e-commerce, and shifting consumer habits.
- Despite the fluctuations, the retail market in China remains one of the largest and most complex in the world.
(Source: Statista)
Vietnam
- As of March 2023, the total number of department stores in Vietnam stood at 111 across various cities, with the majority located in major urban centers.
- Ho Chi Minh City, the country’s largest and most populous city, had the highest concentration of department stores, with 24 stores serving the city’s diverse and growing population.
- The capital, Ha Noi, is closely followed by 18 department stores, reflecting its status as an important cultural and economic hub in the northern region of the country.
- In addition to these two major cities, there were 69 department stores located in other regions of Vietnam, indicating the spread of retail development beyond the primary urban centers.
- This distribution highlights the expanding reach of department stores in Vietnam, catering to a broad consumer base in both large cities and emerging areas.
(Source: Statista)
Canada
- As of December 2023, Canada had a total of department stores distributed unevenly across its provinces and territories, reflecting the population density and urbanization in each region.
- Ontario, the most populous province, led the country with 186 department stores, highlighting its dominant role in Canada’s retail sector.
- Quebec, the second-largest province by population, had 89 department stores, showcasing its robust retail infrastructure.
- Alberta followed with 72 department stores, reflecting its strong economic bases and urban centers such as Calgary and Edmonton.
- British Columbia had 65 department stores, serving its vibrant urban areas and diverse population.
- In the eastern provinces, Nova Scotia recorded 20 department stores, while Manitoba had 18, and Saskatchewan had 16, demonstrating a moderate retail presence in these regions.
- New Brunswick accounted for 13 department stores, and Newfoundland and Labrador had 11, catering to their relatively smaller populations.
- The smaller provinces and territories had fewer department stores, with Prince Edward Island housing only 2.
- The Northwest Territories and Yukon each had one department store, reflecting their sparsely populated nature and limited retail demand.
- This distribution highlights the concentration of department stores in densely populated and economically active provinces, while rural and remote areas maintain a minimal retail footprint.
(Source: Statista)
Australia
- In the financial year 2023, Australia had a total of 174 department stores distributed across its states and territories, with a significant concentration in the more populated regions.
- Victoria led the country with 90 department stores, reflecting its status as a major economic and retail hub supported by large urban centers such as Melbourne.
- New South Wales, home to the largest city, Sydney, ranked second with 39 department stores, underscoring its importance in the national retail landscape.
- Queensland accounted for 22 department stores, serving its growing population and key cities like Brisbane and the Gold Coast.
- Western Australia followed with 12 department stores, concentrated in urban areas such as Perth.
- South Australia had a more modest retail presence, with only five department stores. In comparison, Tasmania and the Northern Territory each had three department stores, reflecting their smaller populations and retail demand.
- The Australian Capital Territory and other territories did not report any department stores in operation during this period.
- This distribution illustrates the correlation between population density, economic activity, and the presence of retail establishments, with a pronounced focus on the eastern and south-eastern states where most of Australia’s population resides.
(Source: Statista)
Department Store Visits Statistics
Level of Preparation Before Department Store Visit
- As of April 2023, shoppers in South Korea exhibited varying levels of preparation before visiting department stores.
- The majority of respondents, 41.3%, indicated that they typically decided on the type of item they wanted to purchase beforehand without necessarily committing to a specific brand or article.
- A significant portion, 20.4%, made decisions about both the type of item and brand before their visit, indicating a more focused shopping approach.
- 12.1% of respondents only decided on the brand they wanted to purchase, while 9.4% made preparations by choosing the type of item, brand, and specific article before heading to the store, demonstrating a high level of planning for their shopping experience.
- On the other hand, 16.8% of respondents reported that they did not make any decisions beforehand, suggesting that some shoppers prefer a more spontaneous or exploratory approach when visiting department stores.
- This data highlights the different shopping behaviors in South Korea, with many consumers engaging in some level of preparation. In contrast, others opt for a more flexible, on-the-spot decision-making process.
(Source: Statista)
Key Points of Consideration When Visiting Department Stores Statistics
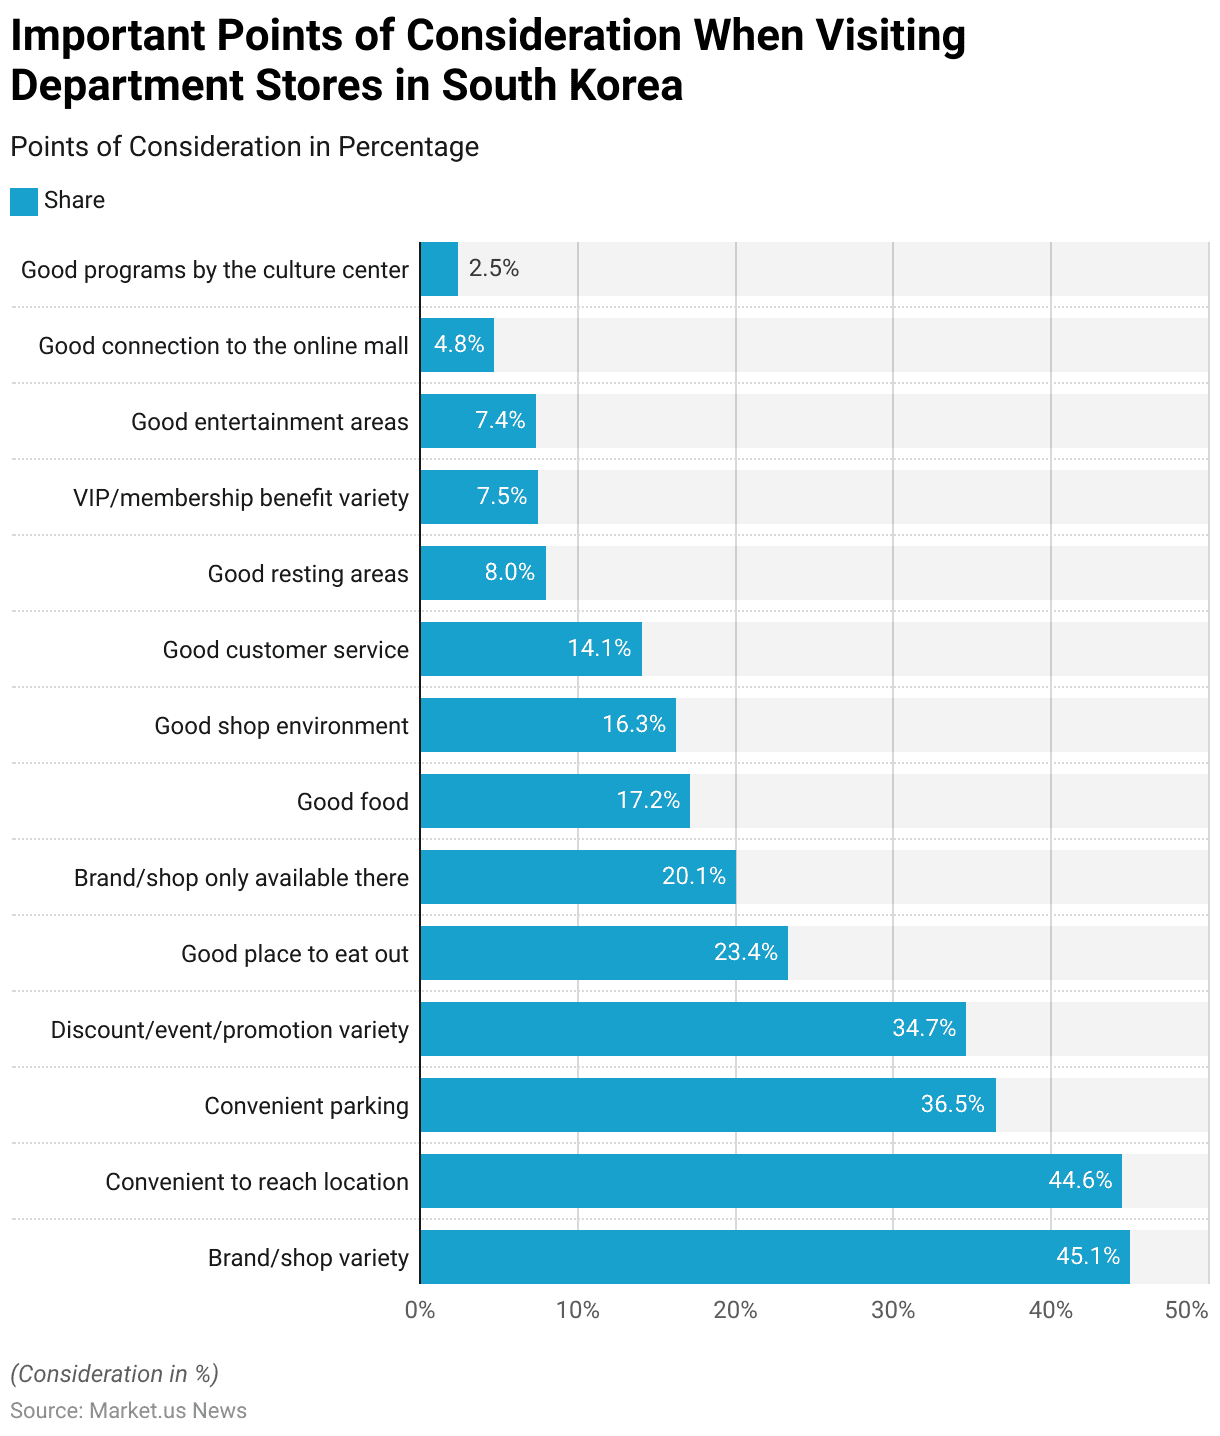
- As of April 2023, when visiting department stores in South Korea, shoppers prioritized several key factors.
- The most important consideration for 45.1% of respondents was the variety of brands and shops available, highlighting the importance of a diverse retail selection.
- Convenience of location was close behind, with 44.6% of shoppers emphasizing the need for easily accessible stores.
- In addition, 36.5% of respondents considered convenient parking essential, reflecting the challenge of parking in busy urban areas.
- Discounts, events, and promotions were significant for 34.7%, showing that sales and special offers play a major role in attracting customers.
- Other factors influencing shopping decisions included the availability of dining options, with 23.4% of shoppers looking for a good place to eat out, and the presence of exclusive brands or shops, which appealed to 20.1%.
- In-store experiences were also important: 17.2% valued good food, 16.3% prioritized a pleasant shopping environment, and 14.1% highlighted the importance of good customer service.
- Resting areas, VIP benefits, entertainment options, and strong connections to online malls were valued to a lesser extent, with 8%, 7.5%, 7.4%, and 4.8% of respondents, respectively, mentioning these features.
- Finally, cultural programs by department stores were the least important consideration, with only 2.5% of respondents finding them significant.
(Source: Statista)
Frequency of Visiting Department Stores Statistics
- As of April 2023, the frequency with which people visit department stores in South Korea varied widely among respondents.
- A small portion, 9.9%, reported visiting department stores more than twice a week, indicating frequent shoppers.
- 15.2% of respondents went once a week, while 29.8% visited 2-3 times a month, showing that a significant portion of the population shops at department stores on a regular but less frequent basis.
- Additionally, 24.3% of shoppers visited department stores once a month, suggesting a more moderate shopping routine.
- On the less frequent end, 15.7% of respondents went to department stores once every 2-3 months, and only 5% visited less than once every 2-3 months, indicating that a smaller segment of the population only shops at department stores occasionally.
- This data reflects a mix of shopping habits, from frequent visits by some consumers to more sporadic trips by others, influenced by personal preferences, convenience, and retail offerings.
(Source: Statista)
Most Visited Department Store Sections
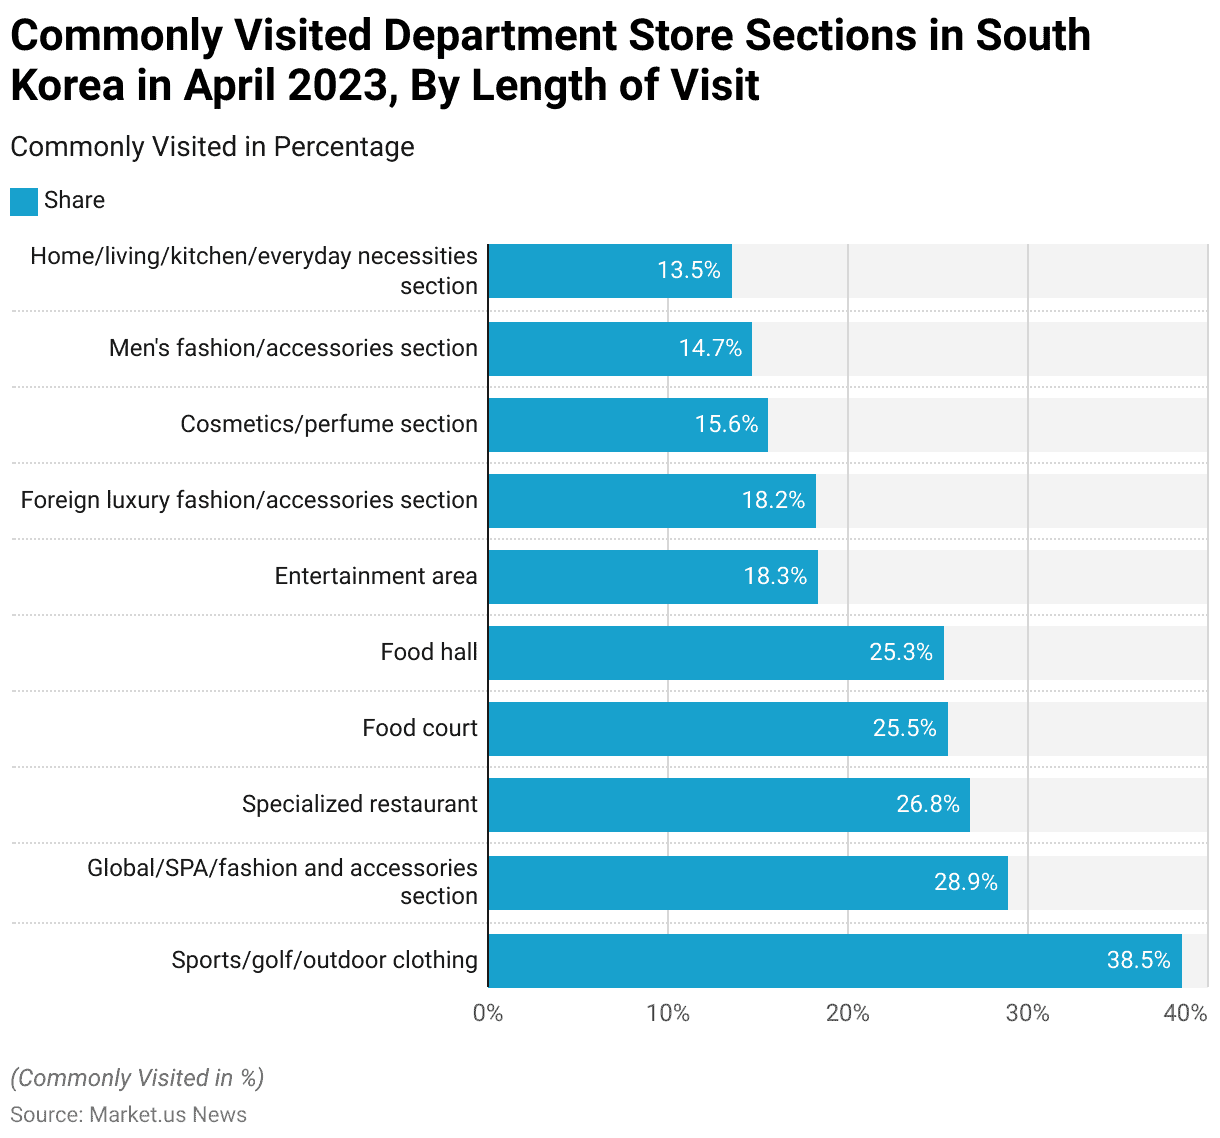
- As of April 2023, shoppers in South Korea frequented various sections of department stores, with certain areas drawing more attention based on the purpose of their visit.
- The sports, golf, and outdoor clothing section emerged as the most popular, with 38.5% of respondents spending time there, reflecting the growing interest in fitness and outdoor activities.
- The global/SPA/fashion and accessories section followed closely with 28.9%, highlighting the appeal of international and trendy fashion options.
- Other commonly visited areas included specialized restaurants (26.8%) and the food court (25.5%), which indicate that dining is an integral part of the shopping experience for many consumers.
- The food hall was also popular, with 25.3% of shoppers visiting to purchase gourmet food items.
- Entertainment areas attracted 18.3%, while the foreign luxury fashion/accessories section drew 18.2%, indicating an interest in high-end, international brands.
- Other notable sections included the cosmetics and perfume section (15.6%), men’s fashion and accessories section (14.7%), and the home, living, kitchen, and everyday necessities section (13.5%), all of which cater to different aspects of consumers’ lifestyle and shopping needs.
- These preferences reflect the diverse ways in which department stores serve as multifaceted destinations for shopping, dining, and entertainment.
(Source: Statista)
Monthly Department Store Visiting Frequency – By Membership Status
- As of April 2023, the frequency of visits to department stores in South Korea differed significantly based on membership status.
- Members of department stores reported an average of 4.17 visits per month, indicating that individuals with memberships tend to visit more frequently.
- This higher frequency could be attributed to the various benefits and promotions typically offered to members, encouraging regular shopping.
- In contrast, non-members visited department stores less often, averaging 1.95 visits per month.
- This suggests that non-members may visit more sporadically, likely driven by specific shopping needs or occasional discounts rather than the regular incentives that membership provides.
- This data underscores the impact of membership programs in fostering greater customer loyalty and frequency of visits.
(Source: Statista)
Department Store Sales in Different Nations
United States
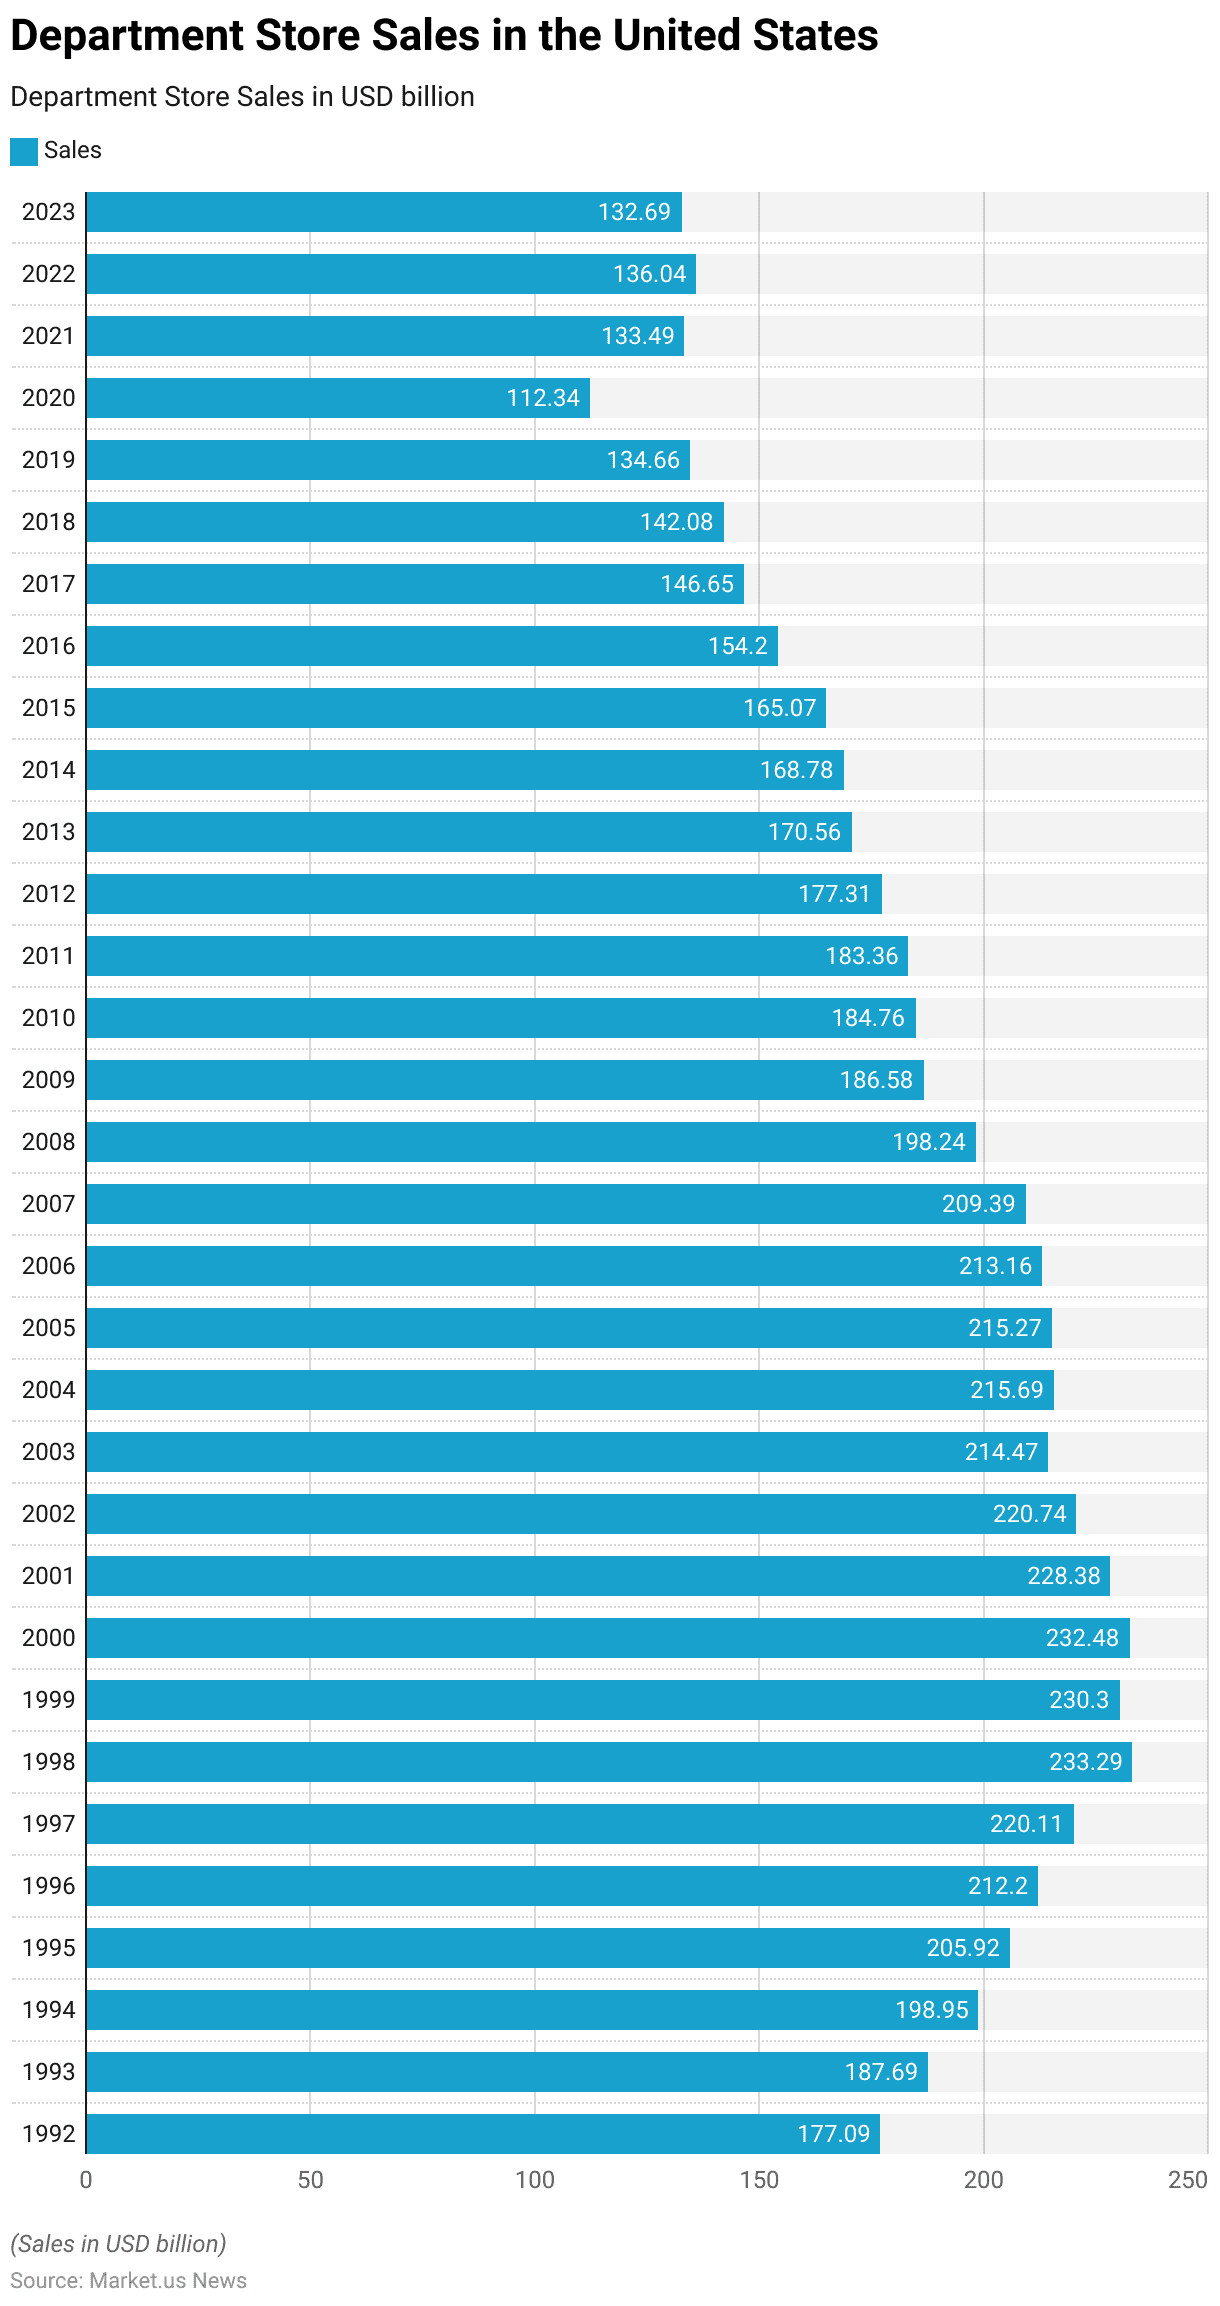
- From 1992 to 2023, department store sales in the United States experienced notable fluctuations.
- In 1992, sales stood at USD 177.09 billion and gradually increased over the following years, reaching a peak of USD 233.29 billion in 1998.
- The market continued to grow, with sales hitting USD 220.11 billion in 1997 and USD 232.48 billion in 2000.
- However, after 2000, growth slowed, with a slight decline to USD 228.38 billion in 2001, followed by further decreases in subsequent years.
- In 2008, amid the global financial crisis, sales sharply dropped to USD 198.24 billion, and by 2009, they further decreased to USD 186.58 billion.
- The market continued to struggle, with sales staying below USD 200 billion in the years following the recession, such as USD 184.76 billion in 2010 and USD 177.31 billion in 2012.
- In the years from 2013 to 2016, the downward trend persisted, with sales decreasing from USD 170.56 billion in 2013 to USD 154.2 billion in 2016.
- The steady decline in department store sales reflects broader shifts in consumer behavior including the rise of e-commerce and changes in retail shopping habits.
- These sales figures illustrate a retail landscape transforming, with department stores facing increasing competition from online platforms and specialty retailers.
(Source: Statista)
Great Britain
- From 2006 to 2023, retail sales in non-specialized stores in Great Britain saw several fluctuations, reflecting changes in consumer spending and economic conditions.
- In 2006, retail sales were £25,196 million, and gradually increased over the next few years, reaching £26,173 million in 2007.
- Despite a small dip to £25,646 million in 2008 and £25,330 million in 2009, sales rebounded in 2010 to £26,602 million and continued to rise in the following years, peaking at £28,331 million in 2012.
- From 2013 onwards, retail sales in non-specialized stores saw steady growth, with sales reaching £34,166 million in 2013 and continuing to increase gradually each year, reaching £34,754 million in 2015 and £35,407 million in 2016.
- This upward trend persisted through 2017 and 2018, with sales reaching £35,504 million in 2018.
- However, in 2019, sales saw a slight dip to £34,921 million, and this decline continued in the following years, with £33,604 million recorded in 2020, likely due to the economic impact of the COVID-19 pandemic.
- Sales further declined in 2021 to £32,929 million and £32,227 million in 2022.
- By 2023, retail sales had slightly stabilized at £32,213 million, indicating a relatively stable but lower level of spending in non-specialized retail stores compared to the earlier part of the decade.
- The data reflects the broader economic challenges, including the pandemic and changing consumer behaviors that have influenced retail trends in Great Britain over the past two decades.
(Source: Statista)
China
- From 2011 to 2021, retail sales of department stores in China exhibited significant growth, followed by some fluctuations.
- In 2011, sales were 263.14 billion yuan, and they steadily increased over the next few years, reaching 291.62 billion yuan in 2012 and 307.64 billion yuan in 2013.
- The growth continued into 2014, with sales climbing to 325.05 billion yuan and further rising to 338.02 billion yuan in 2015, marking the peak of the period.
- However, from 2016 onward, retail sales began to decline, with a notable drop to 316.52 billion yuan in 2016.
- This downward trend continued in 2017 and 2018, with sales reaching 320.47 billion yuan and 319.62 billion yuan, respectively.
- In 2019, sales further decreased to 298.22 billion yuan, and the situation worsened in 2020, likely due to the impact of the COVID-19 pandemic, with sales falling to 250.8 billion yuan.
- In 2021, sales rebounded slightly to 285.49 billion yuan, reflecting some recovery in the department store sector.
- Overall, the data shows a period of growth followed by challenges and eventual recovery in the retail sector.
(Source: Statista)
Hong Kong
- From 2013 to 2023, the value of retail sales in department stores in Hong Kong showed fluctuations, largely influenced by economic conditions and external factors such as the COVID-19 pandemic.
- In 2013, retail sales were 51,586 million Hong Kong dollars, and they slightly increased in 2014 to 52,273 million Hong Kong dollars.
- However, sales began to decline in 2015, dropping to 50,123 million Hong Kong dollars and further decreased to 47,011 million Hong Kong dollars in 2016.
- In 2017, retail sales showed a small recovery, reaching 48,617 million Hong Kong dollars, and in 2018, they rebounded to 52,257 million Hong Kong dollars, reflecting stronger consumer demand.
- However, the downward trend resumed in 2019, with sales falling to 46,253 million Hong Kong dollars.
- The impact of the COVID-19 pandemic became evident in 2020, with sales dropping significantly to 35,939 million Hong Kong dollars, and they remained low in 2021 at 34,752 million Hong Kong dollars.
- In 2022, the value of retail sales further declined to 31,294 million Hong Kong dollars, reaching its lowest point in the decade.
- However, in 2023, sales showed signs of recovery, increasing to 35,176 million Hong Kong dollars, reflecting a gradual rebound in the retail sector following the pandemic’s peak.
- The data highlights the volatility in the department store retail market in Hong Kong, with periods of growth followed by significant downturns, especially due to the global health crisis.
(Source: Statista)
Australia
- From August 2020 to August 2024, monthly department store retail revenue in Australia demonstrated a range of trends, with periods of growth and decline reflective of both seasonal variations and economic conditions.
- In the initial months, the revenue fluctuated, with 1,469.5 million Australian dollars in August 2020, slightly dropping to 1,468.7 million dollars in September. However, there was a steady increase towards the end of the year, reaching 1,809.1 million dollars in November 2020 and 1,702.5 million dollars in December.
- In early 2021, January saw 1,677.9 million dollars, with February and March seeing slight increases to 1,672.8 million dollars and 1,786.6 million dollars, respectively.
- April 2021 recorded 1,711 million dollars, followed by a decrease in May to 1,672.7 million dollars. June 2021 saw further declines to 1,566.3 million dollars, with July dropping to 1,395.4 million dollars and August 2021 seeing the lowest point of 1,220.5 million dollars during this period.
- September 2021 showed a small recovery with 1,235.4 million dollars, followed by another increase to 1,526.3 million dollars in October.
- November 2021 saw a strong recovery, with revenue rising to 1,799.2 million dollars and December maintaining a healthy level of 1,584.3 million dollars. Moving into 2022, January brought in 1,628 million dollars, and February saw further growth with 1,752.2 million dollars.
- March 2022 saw a peak at 1,800.6 million dollars, with April maintaining similar figures at 1,797.9 million dollars.
- May 2022 marked another peak with 1,844 million dollars, followed by consistent growth in June at 1,849.9 million dollars and July reaching 1,876.9 million dollars.
- This data suggests a recovery in retail sales, particularly during the second half of 2021 and throughout 2022, with steady revenue growth. The impact of seasonal factors, including holiday shopping and end-of-financial-year sales, seems to be a major contributor to the revenue fluctuations observed.
(Source: Statista)
Department Store Product Sales
Distribution of Total Sales of Department Stores – By Product Group Statistics
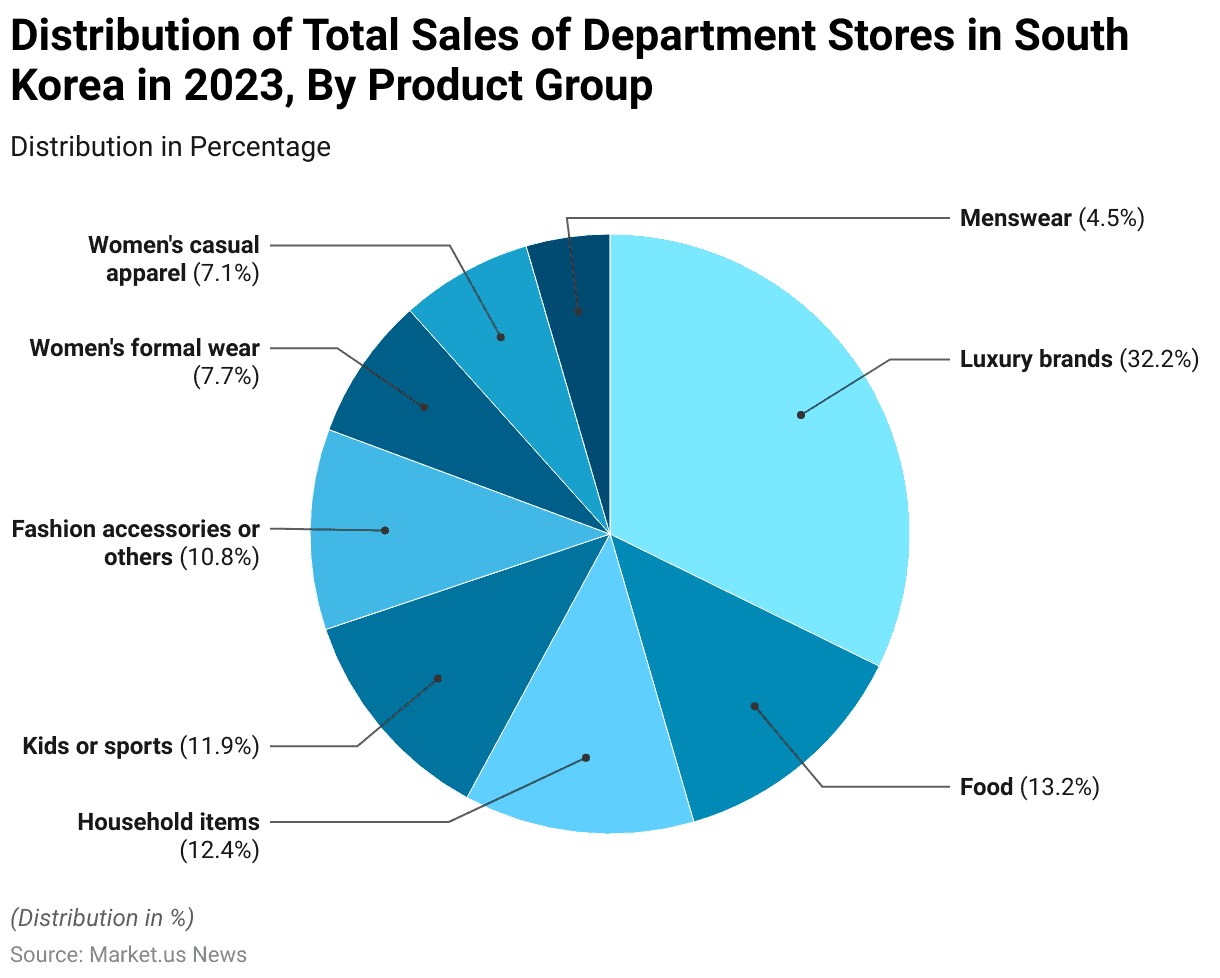
- In 2023, the distribution of total sales in department stores in South Korea was heavily skewed towards luxury brands, which accounted for 32.2% of total sales.
- This was followed by food, which contributed 13.2% to the overall sales.
- Household items made up 12.4%, reflecting a strong consumer demand in this category.
- Kids or sports products represented 11.9% of total sales, while fashion accessories and other products accounted for 10.8%.
- Women’s formal wear and casual apparel together contributed 14.8%, with formal wear making up 7.7% and casual apparel 7.1%.
- Menswear, on the other hand, accounted for the smallest share of 4.5%.
- This breakdown highlights the dominance of luxury and essential categories in the South Korean department store market in 2023.
(Source: Statista)
Sales Share of Macy’s Inc. Worldwide – By Merchandise Department
- In 2023, Macy’s Inc.’s sales worldwide were predominantly driven by women’s accessories and cosmetics, which accounted for 41.23% of total sales.
- This category was by far the largest contributor to the company’s revenue.
- Following this, men’s and kids’ merchandise made up 21.30% of sales, while women’s apparel represented 21.05%.
- Home and other products, including household goods and various non-clothing items, contributed the remaining 16.43%.
- This distribution underscores Macy’s strong focus on the women’s market, particularly in accessories and cosmetics, alongside a notable presence in the men’s and children’s segments.
(Source: Statista)
Marks & Spencer: Clothing & Home Sales
- From the financial year 2009/10 to 2023/24, Marks & Spencer’s clothing and home revenue in the United Kingdom has shown significant fluctuations, reflecting various market conditions and strategic shifts.
- In the 2009/10 financial year, the company generated £4,362 million in revenue.
- This figure rose steadily in the following years, peaking at £5,103 million in 2013/14, driven by strong sales performance in both clothing and home goods.
- However, revenue began to decline from 2015 onwards, with a noticeable drop to £4,688 million in 2015/16.
- Despite efforts to recover, Marks & Spencer’s revenue in this segment continued to fall, reaching £4,457 million in 2016/17.
- By 2019/20, the revenue had further declined to £4,074 million, with the pandemic in 2020 exacerbating the downturn, dropping to £3,711 million.
- In 2021/22, the company showed a slight recovery to £3,851 million, but growth remained subdued.
- As of 2023/24, Marks & Spencer’s clothing and home revenue is forecast to reach approximately £4,032 million, indicating a gradual but consistent recovery following the challenges of recent years.
- This trend reflects ongoing adjustments to the company’s product offerings, store formats, and response to changing consumer behavior.
(Source: Statista)
Sales of Target – By Product Segment
2017-2019
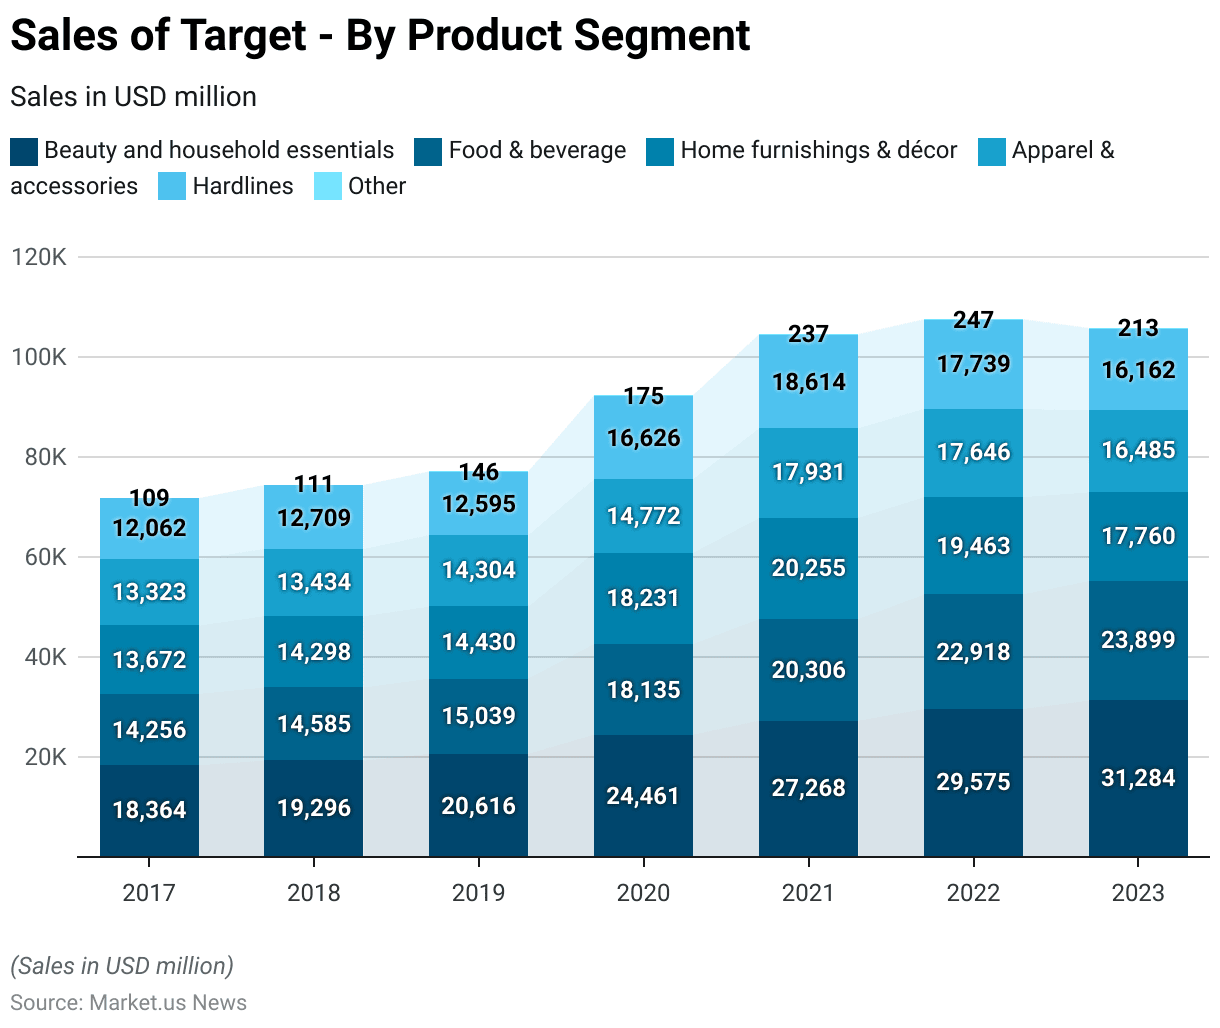
- From 2017 to 2019, Target’s sales in the United States across various product segments showed steady growth, with some categories experiencing more significant increases than others.
- In 2017, the company generated $18,364 million from beauty and household essentials, $14,256 million from food and beverages, and $13,672 million from home furnishings and décor.
- Apparel and accessories contributed $13,323 million, while hardline sales amounted to $12,062 million, and other categories brought in $109 million.
- In 2018, Target’s sales across all segments grew slightly, with beauty and household essentials reaching $19,296 million, food and beverage sales rising to $14,585 million, and home furnishings and décor totaling $14,298 million.
- Apparel and accessories saw a small increase to $13,434 million, while hardlines sales grew to $12,709 million, and other sales remained steady at $111 million.
- The trend continued into 2019, with beauty and household essentials leading at $20,616 million, followed by food and beverage at $15,039 million.
- Home furnishings and décor maintained strong performance with $14,430 million, while apparel and accessories sales reached $14,304 million. Hardlines continued to perform well, ttotaling$12,595 million, and other sales increased to $146 million.
- The COVID-19 pandemic in 2020 resulted in substantial growth for Target, particularly in certain categories. Beauty and household essentials surged to $24,461 million, food and beverage sales jumped to $18,135 million, and home furnishings and décor soared to $18,231 million.
- Apparel and accessories saw a slight dip to $14,772 million, while hardlines grew significantly to $16,626 million, and other sales increased to $175 million.
2021-2023
- In 2021, sales continued to rise across most segments, with beauty and household essentials reaching $27,268 million, food and beverage increasing to $20,306 million, and home furnishings and décor at $20,255 million. Apparel and accessories grew to $17,931 million, hardlines reached $18,614 million, and other sales rose to $237 million.
- In 2022, Target’s growth continued, with beauty and household essentials reaching $29,575 million, food and beverage growing to $22,918 million, and home furnishings and décor at $19,463 million.
- Apparel and accessories saw a slight decrease to $17,646 million, while hardlines declined to $17,739 million. Other sales remained steady at $247 million.
- By 2023, beauty and household essentials reached $31,284 million, food and beverage sales rose to $23,899 million, and home furnishings and décor dropped to $17,760 million. Apparel and accessories continued to decline to $16,485 million, while hardlines decreased to $16,162 million, and other sales fell to $213 million.
- This steady growth in key categories highlights Target’s resilience and its ability to adapt to changing consumer behaviors and market conditions.
(Source: Statista)
Net Sales Share of Walmart – By Merchandise Category
- In the fiscal year 2023, Walmart U.S. saw a significant portion of its net sales driven by the grocery segment, which accounted for 58.8% of total sales.
- General merchandise followed with 28.2%, reflecting Walmart’s broad product offerings in areas such as clothing, electronics, and home goods.
- Health and wellness products, including pharmaceuticals and personal care items, contributed 11.1% to the overall sales.
- The remaining 1.9% of sales came from other merchandise categories, which likely included various non-core product offerings.
- This breakdown highlights the dominant role of grocery sales in Walmart’s U.S. business, with general merchandise and health-related products also playing substantial roles in the retailer’s revenue composition.
(Source: Statista)
Department Store Discount Statistics
Sales of the Leading General Merchandise/Discount Store Companies Worldwide
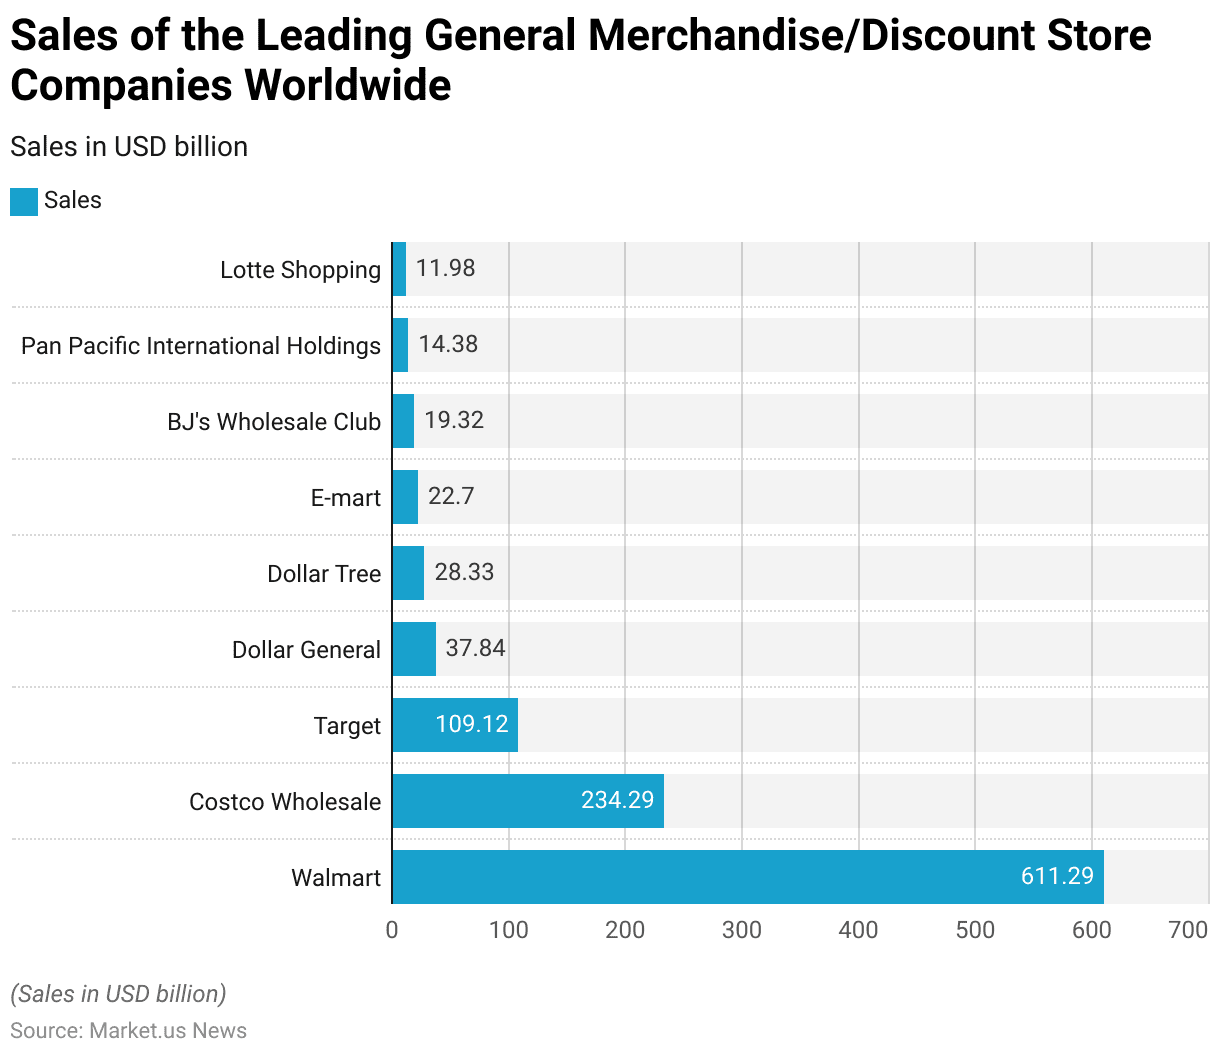
- From May 2022 to May 2023, Walmart led global general merchandise and discount store companies with an impressive sales figure of 611.29 billion USD, far surpassing its competitors.
- Costco Wholesale followed in second place, achieving sales of 234.29 billion USD.
- Target ranked third, with sales reaching 109.12 billion USD during the period.
- Dollar General and Dollar Tree recorded sales of 37.84 billion USD and 28.33 billion USD, respectively, highlighting their presence in the discount retail segment.
- E-mart posted sales of 22.7 billion USD, while BJ’s Wholesale Club generated 19.32 billion USD.
- Pan Pacific International Holdings contributed 14.38 billion USD in sales, and Lotte Shopping rounded out the list with 11.98 billion USD.
- These figures underscore the significant revenue disparities among the leading players in the global retail market.
(Source: Statista)
Sales of Discount Department Stores Statistics
- The sales of discount department stores in the United States (NAICS 452112) experienced a consistent decline from 2008 to 2020.
- In 2008, sales reached a peak of 127,087 million USD, reflecting robust consumer demand during that period.
- However, in 2009, sales slightly dropped to 123,243 million USD, and the downward trend continued in subsequent years.
- By 2010, sales had further declined to 119,854 million USD, followed by 117,623 million USD in 2011 and 114,352 million USD in 2012.
- The year 2013 witnessed sales of 109,578 million USD, marking a steady decrease as discount department stores faced increasing competition from online retailers and changing consumer preferences.
- This trend persisted into 2014, with sales falling to 107,525 million USD, and in 2015, sales further dropped to 105,654 million USD.
- By 2016, sales had reduced to 103,533 million USD, and in 2017, they were slightly lower at 102,959 million USD.
- The decline became more pronounced after 2018, with sales decreasing to 101,921 million USD. In 2019, the figure further reduced to 101,052 million USD, and by 2020, sales hit their lowest point during the period, at 100,347 million USD.
- This continuous decline over the years reflects the challenges faced by traditional discount department stores, including market saturation, the rise of e-commerce, and evolving consumer behavior.
(Source: Statista)
Monthly Retail Sales of Discount Department Stores Statistics
- From 2018 to 2024, the monthly retail sales of discount department stores in the United States exhibited notable seasonal fluctuations and growth trends.
- In January 2018, sales were $6,479 million, and they gradually increased over the next several months, reaching $8,151 million in May 2018.
- The peak of the year occurred in December 2018, with sales hitting $12,740 million.
- In 2019, the trend continued upward, with January starting at $8,708 million and December reaching a remarkable $18,151 million in sales.
- The sales trajectory in 2020 experienced a dip in the early months, as January, February, and March recorded $6,294 million, $6,546 million, and $6,783 million, respectively, likely reflecting the effects of the pandemic.
- This pattern indicates a mix of steady consumer demand in some periods and significant spikes during peak seasons, particularly in the fourth quarter, which typically sees higher sales due to holidays and promotions.
- The data for 2020 and beyond likely continues this seasonal trend, though further analysis would be required to see how the retail landscape evolved post-2020, as the pandemic reshaped consumer shopping behavior.
(Source: Statista)
Consumers Regularly Buying Food and Products for Everyday Use in Discount Stores – By Generation
- In 2023, discount stores in the United States saw varying levels of consumer engagement across generations for everyday food and product purchases.
- Millennials emerged as the most frequent shoppers, with 23% of respondents from this generation regularly buying from these stores.
- They were followed by Generation X, which accounted for 21% of regular shoppers.
- Baby Boomers also contributed significantly, representing 20% of respondents who consistently relied on discount stores for their daily needs.
- Gen Z, while representing the youngest cohort, made up 18% of regular shoppers, reflecting their growing participation in the discount retail segment.
- These insights highlight generational preferences and their contribution to the thriving discount store industry in the United States.
(Source: Statista)
Consumer Satisfaction in Department and Discount Stores
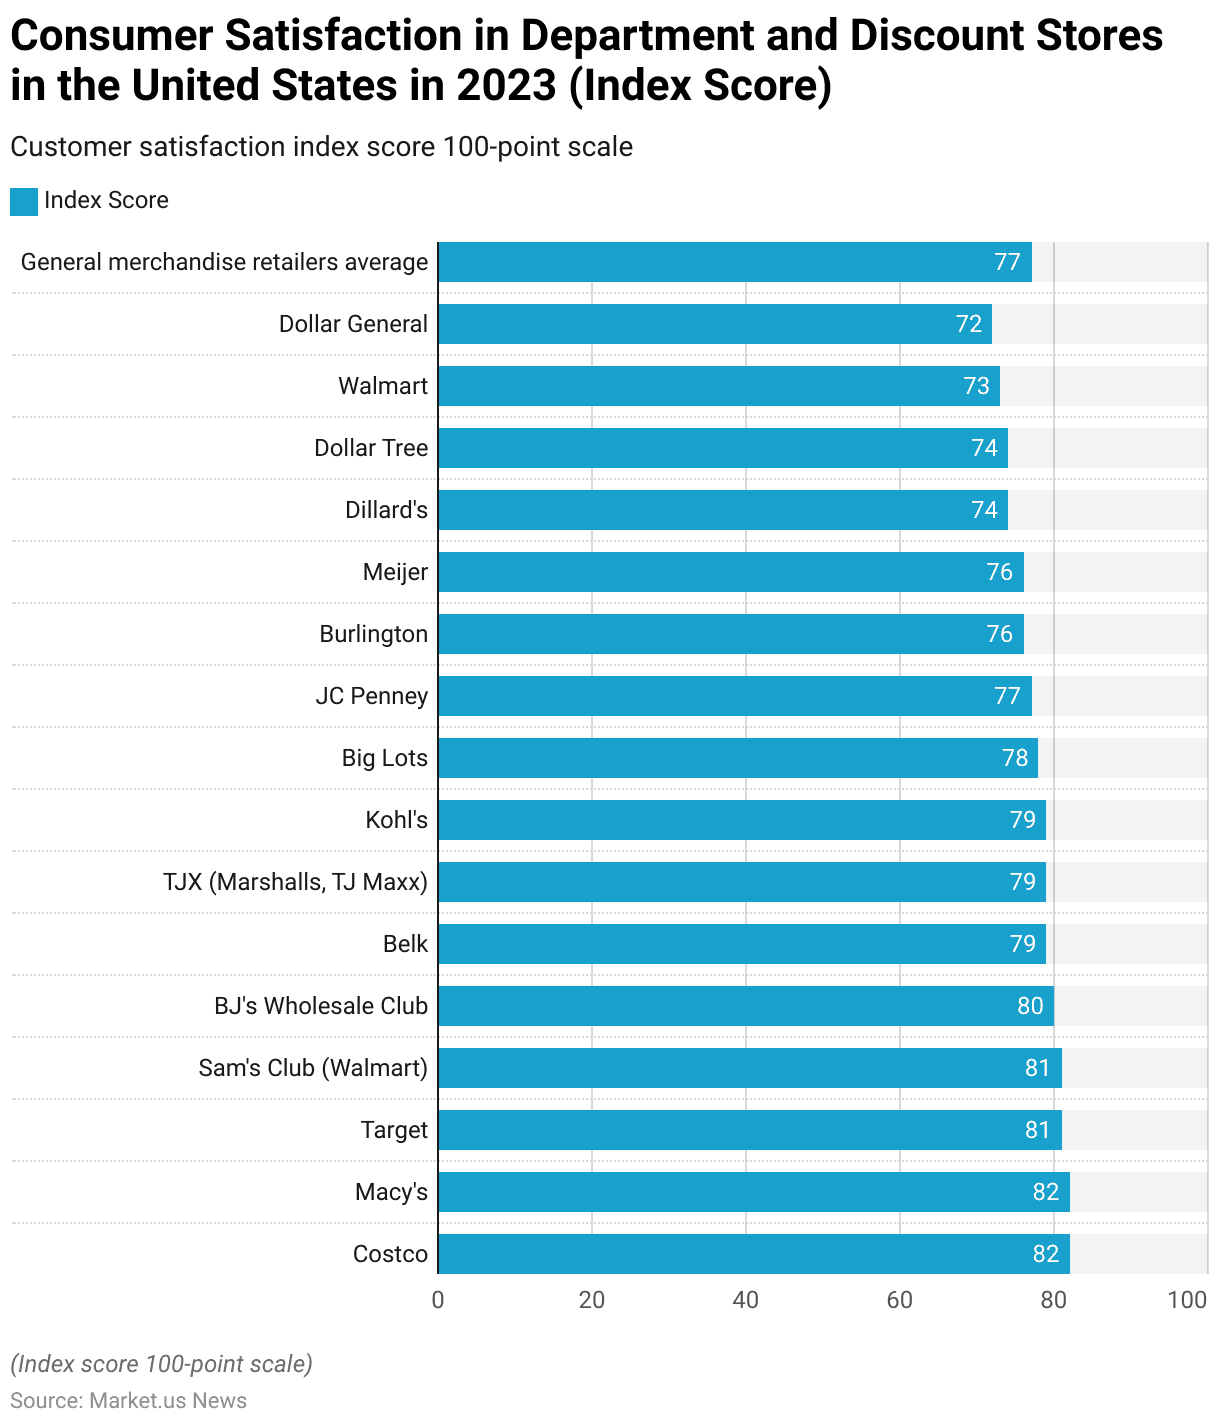
- In 2023, customer satisfaction within the department and discount store segment in the United States varied across key retailers.
- Costco and Macy’s led the ranking with the highest customer satisfaction scores of 82 on a 100-point scale, showcasing their strong commitment to customer experience.
- They were closely followed by Target and Sam’s Club (a Walmart subsidiary), both scoring 81, reflecting their competitive service quality. BJ’s Wholesale Club also performed well, achieving a score of 80.
- Belk, along with TJX (which includes Marshalls and T.J. Maxx) and Kohl’s, each scored 79, highlighting their appeal among shoppers.
- Big Lots followed with a score of 78, just above the general merchandise retailers’ average score of 77.
- JCPenney scored 77, while Burlington and Meijer scored 76.
- Dillard’s and Dollar Tree received identical scores of 74, slightly higher than Walmart’s score of 73.
- Dollar General ranked lowest in the comparison, with a score of 72, indicating room for improvement.
- These scores reflect varying levels of customer satisfaction and the diverse strategies employed by retailers to engage and satisfy their customer base.
(Source: Statista)
Popular Department Stores in Various Countries Statistics
Most Popular General Merchandise and Department Stores in the United States Statistics
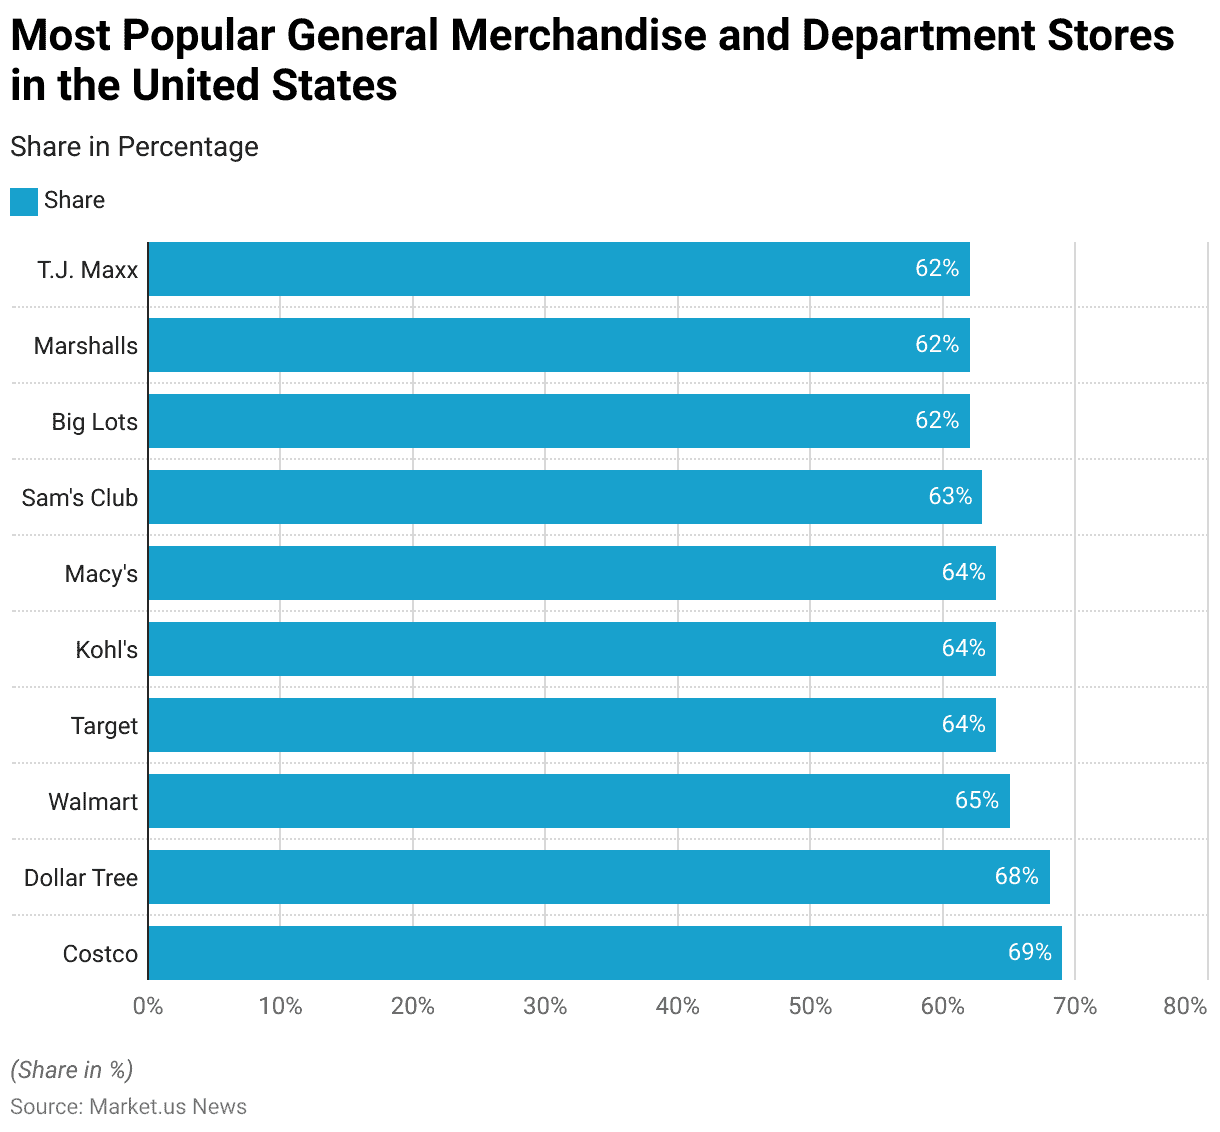
- In the fourth quarter of 2023, Costco emerged as the most popular general merchandise department store among U.S. consumers, with 69% of respondents expressing a positive opinion of the brand.
- Dollar Tree followed closely, earning a favorable perception from 68% of respondents, reflecting its strong appeal in the discount retail sector.
- Walmart ranked third, garnering positive opinions from 65% of consumers, showcasing its widespread presence and affordability.
- Target, Kohl’s, and Macy’s each received a 64% positive response, highlighting their consistent appeal across diverse consumer segments.
- Sam’s Club, a Walmart subsidiary, achieved a 63% positive rating, reinforcing its reputation for value-driven bulk shopping.
- Big Lots, Marshalls, and T.J. Maxx each secured a 62% share of positive consumer opinions, reflecting their popularity for offering affordable and varied product ranges.
- These rankings underscore the competitive landscape of the U.S. general merchandise and department store sector, where both big-box retailers and discount chains maintain strong consumer loyalty.
(Source: Statista)
Most Popular Department and Home Stores in the United Kingdom (UK)
- In the third quarter of 2024, John Lewis emerged as the most popular department and home store in the United Kingdom, with an impressive 77% of respondents expressing a positive opinion of the brand.
- Marks & Spencer followed closely, garnering a 74% favorable rating, reflecting its continued appeal as a trusted retailer of quality goods.
- Screwfix ranked third, earning a 71% positive opinion from consumers, driven by its focus on tools and hardware for home improvement.
- Wilko maintained strong consumer loyalty, achieving a 70% positive response, while B&Q and Dunelm each garnered a 69% approval rating, underscoring their popularity for home improvement and furnishings.
- Wickes, another home improvement retailer, received a 67% positive opinion, highlighting its competitive position in the market.
- IKEA, renowned for its flat-pack furniture and home accessories, achieved a 64% approval rating among UK consumers.
- Debenhams and Habitat, while scoring lower, each received a 56% positive opinion, reflecting ongoing recognition despite challenges faced in the evolving retail landscape.
- These rankings demonstrate a blend of traditional department stores and specialized home improvement retailers that remain central to the UK consumer market, reflecting diverse preferences across retail categories.
(Source: Statista)
Consumer Attitudes Towards Department Stores Statistics
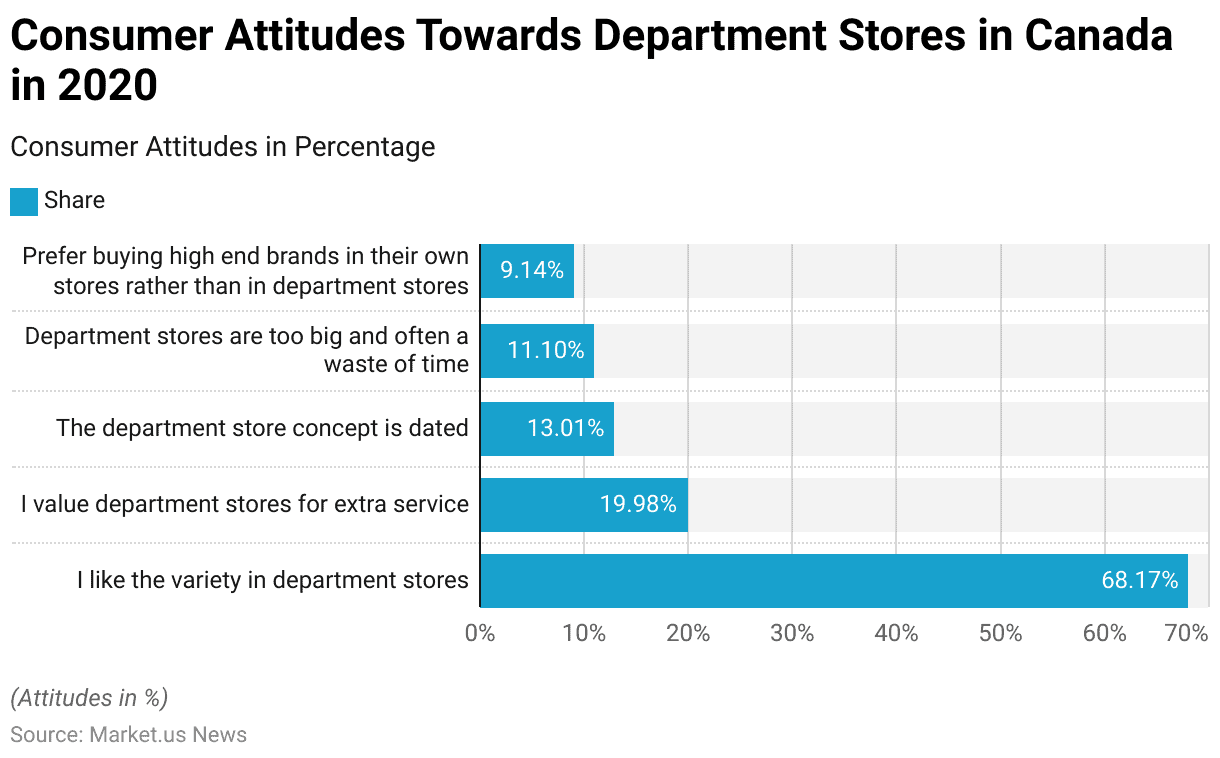
- In 2020, consumer attitudes towards department stores in Canada revealed varied perspectives on their value and relevance.
- A significant majority, 68.17% of respondents, expressed appreciation for the variety offered in department stores, emphasizing the appeal of diverse product selections under one roof.
- Meanwhile, 19.98% of respondents valued the extra services provided by department stores, such as personalized assistance and unique shopping experiences, highlighting their role beyond just retail spaces.
- However, not all opinions were favorable Approximately 13.01% of respondents perceived the department store concept as dated, reflecting a growing sentiment that these stores may be struggling to adapt to modern retail trends.
- Additionally, 11.10% of consumers found department stores too large and often a waste of time, suggesting that their scale and layout might deter efficiency-focused shoppers.
- Lastly, 9.14% of respondents indicated a preference for purchasing high-end brands directly from their standalone stores rather than through department stores, underscoring a potential challenge for department stores in maintaining their appeal to luxury-oriented consumers.
- These findings provide insights into the evolving role and perception of department stores in the Canadian retail landscape.
(Source: Statista)
Challenges and Concerns
Leading Challenges Encountered by Department Store Operators
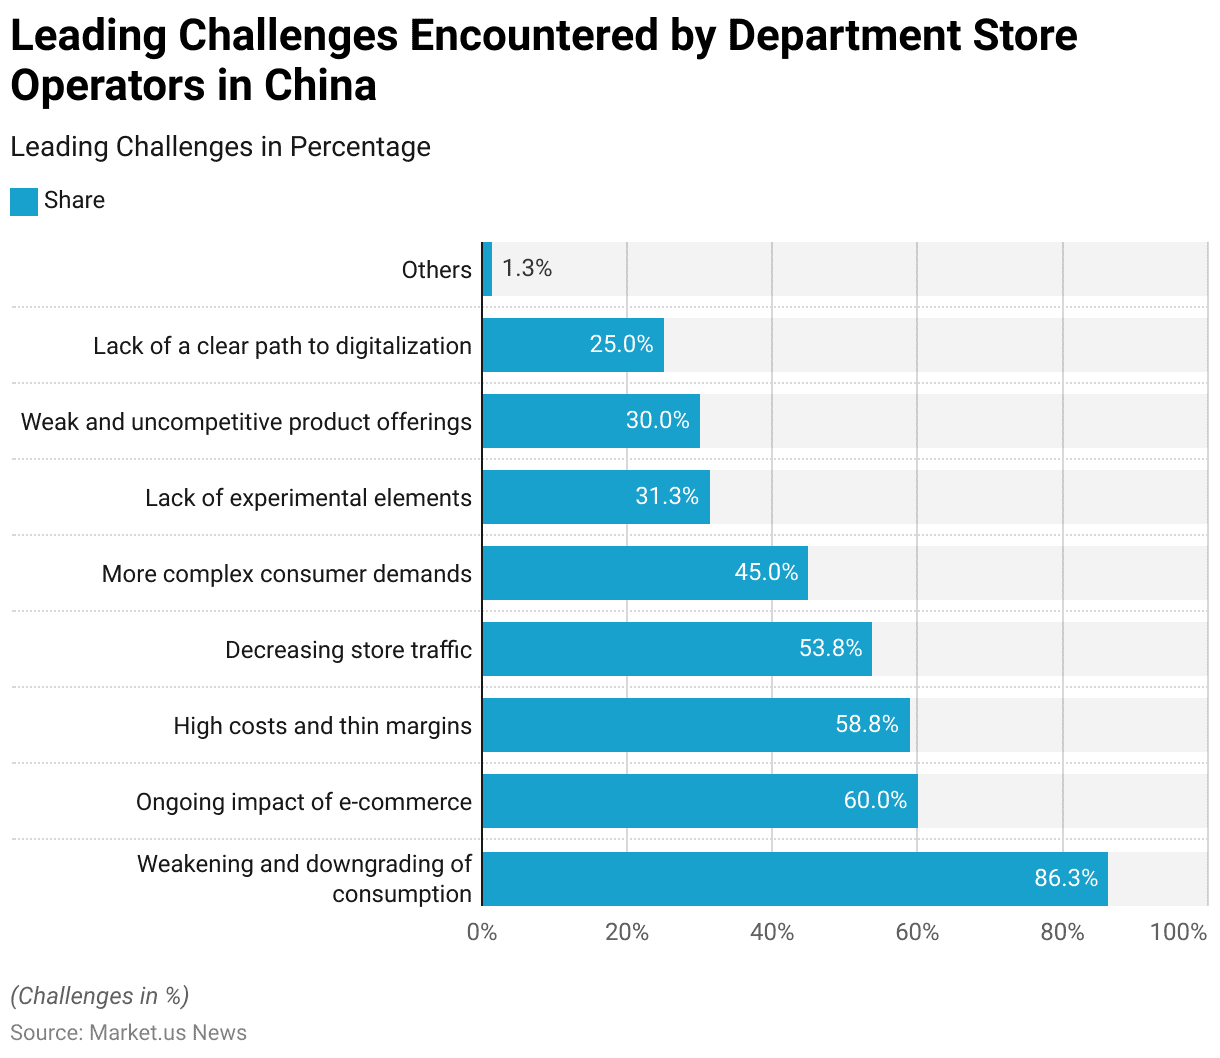
- In 2023, department store operators in China faced several critical challenges that significantly impacted their operations and strategies.
- The most pressing issue, reported by 86.3% of surveyed enterprises, was the weakening and downgrading of consumer spending, reflecting broader economic pressures and shifting consumption patterns.
- The ongoing impact of e-commerce ranked as the second most significant challenge, cited by 60% of respondents, as the digital retail landscape continued to attract customers away from physical stores.
- High operational costs and thin profit margins were a concern for 58.8% of enterprises, underscoring the financial pressures faced by traditional retailers.
- Additionally, 53.8% of respondents pointed to decreasing store traffic, signaling a decline in consumer visits to physical department stores. Increasingly complex consumer demands were highlighted by 45% of operators, illustrating the need for more targeted and personalized offerings.
- Other challenges included the lack of experimental and innovative elements in stores, identified by 31.3% of respondents, and weak, uncompetitive product offerings, which concerned 30% of surveyed businesses.
- Moreover, 25% of respondents cited the lack of a clear path to digitalization as a key hurdle, reflecting the importance of integrating technology into retail operations to remain competitive.
- A small proportion (1.3%) of enterprises reported other challenges, indicating that the majority of issues faced by department stores are industry-wide and systemic.
- These findings highlight the urgent need for department store operators in China to innovate, digitalize, and adapt to the evolving retail environment.
(Source: Statista)
Major Challenges of Developing Private Labels for Department Store Operators
- As of May 2020, department store operators in China faced several significant challenges in developing private labels, with high investment costs emerging as the most pressing issue.
- Scoring 4.33 on a 6-point scale, this challenge reflects the substantial financial resources required to establish and promote private-label products.
- The long period needed to achieve market recognition, rated 4.26, posed another critical barrier, as building consumer trust and loyalty for new brands demands considerable time and effort.
- High inventory risk, with a score of 4.19, further complicated the process, as unsold goods can lead to financial losses and operational inefficiencies.
- Additionally, the lack of suitable talent scored 3.95, highlighting the difficulties in recruiting professionals with the expertise to develop and manage successful private-label programs.
- Predicting consumer needs, which scored 3.36, also proved challenging, given the evolving and diverse preferences of the modern shopper.
- Lastly, insufficient support from corporate decision-makers, rated at 1.37, emerged as a relatively minor issue. This suggests that while executive buy-in may not be a widespread obstacle, it could hinder efforts in some cases.
- Overall, these challenges underscore the complexity and risk involved in launching private labels for department stores, requiring a combination of financial investment, strategic planning, and market insight to succeed.
(Source: Statista)
Regulations for Department Stores
- Regulations governing department stores vary significantly across countries, focusing on consumer protection, ethical standards, and environmental sustainability.
- In the European Union, for instance, stringent measures are enacted to ensure transparency in product origins and environmental impacts, with specific regulations targeting waste management and recycling practices.
- For example, Germany‘s Corporate Due Diligence Obligations in Supply Chains Act mandates companies to prevent human rights violations and environmental harm within their supply chains, reflecting a broad commitment to ethical business practices across the continent.
- France has introduced progressive laws such as the Consumer Information on Environmental Qualities of Products and a penalty system for ultra-fast fashion items, emphasizing ecological accountability.
- Similarly, the Netherlands and Sweden have implemented Extended Producer Responsibility (EPR) policies, requiring producers to manage waste from textiles, which significantly impacts department store operations by mandating recycling and reuse.
- In contrast, the UK has focused on labeling and product information to improve price transparency.
- Globally, countries like Norway and Spain enforce laws to enhance supply chain transparency and prevent environmental degradation through comprehensive waste legislation and ethical retail standards.
- These regulations not only aim to protect consumer interests but also drive department stores toward more sustainable and ethical business operations, highlighting the global shift towards responsible retailing practices.
(Sustainable Brand Platform, RSM Global)
Recent Developments
Acquisitions and Mergers:
- Procter & Gamble Acquires T3 Micro (2023): In early 2023, Procter & Gamble, a leader in hygiene and health products, acquired T3 Micro, a tech company known for its smart handwashing and hygiene devices. This acquisition, valued at $1.2 billion, will allow P&G to integrate advanced sensor technology into their handwashing products, expanding their market into high-tech hygiene solutions. The move is expected to increase P&G’s share in the hand hygiene market by 15% over the next 3 years.
- Unilever Partners with Klenz (2022): Unilever, a global leader in health and hygiene products, entered a partnership with Klenz, an AI-powered smart soap dispenser company, in December 2022. The partnership aims to revolutionize hand hygiene with IoT-enabled dispensers that track and analyze users’ handwashing habits. The market adoption of smart handwashing solutions is expected to grow by 20% annually over the next five years.
Product Launches:
- Colgate-Palmolive’s Smart Handwashing System (2023): In March 2023, Colgate-Palmolive launched its first-ever smart handwashing system. The system uses an AI-powered device to provide real-time feedback and reminders on hand hygiene. Priced at $99, this device is expected to revolutionize personal hygiene habits. Initial sales figures suggest a 25% increase in smart home product sales for Colgate in the first quarter of 2023.
- Lysol’s New Hand Soap Line (2023): In February 2023, Lysol launched a new range of antibacterial hand soaps aimed at children and families. The line, which includes both liquid soap and foaming options, features an innovative formulation designed to kill 99.9% of germs while being gentle on the skin. Early reports suggest a strong market reception, with sales expected to increase by 30% over the next year.
Funding and Investments:
- Handwashing Innovation Fund (2023): The World Health Organization (WHO) and UNICEF launched a $10 million Handwashing Innovation Fund in 2023 to support startups working on innovative solutions to improve hand hygiene globally. The fund aims to develop affordable and accessible handwashing technologies, especially in underserved regions. Over 40 companies have applied for grants, with expectations for significant growth in the hand hygiene sector, particularly in developing countries.
- Funding for HealthTech Startups (2022): In 2022, the healthtech startup CleanTech received $5 million in Series A funding to enhance their touchless handwashing stations. These stations, designed for both public and private spaces, use motion sensors to provide soap and water, ensuring no physical contact. This new technology is expected to increase public handwashing adherence by up to 50% in high-traffic areas.
Regulatory Developments:
- US FDA Approves New Hand Sanitizer Guidelines (2023): In early 2023, the U.S. Food and Drug Administration (FDA) announced new guidelines for hand sanitizers, clarifying formulations and effectiveness standards for over-the-counter products. The updated regulations focus on improving the efficacy of sanitizers while ensuring they are safe for frequent use. This move is expected to affect over $2 billion in sanitizer product sales annually.
- EU’s Green Hygiene Policy (2023): The European Union introduced new regulations for eco-friendly hand hygiene products in 2023, aiming to reduce plastic waste and encourage the use of biodegradable packaging. This initiative is expected to increase demand for sustainable hand hygiene products by 15% within the next five years, according to market estimates.
Conclusion
Department Stores Statistics – In conclusion, the department store industry continues to experience significant transformation, driven by evolving consumer preferences, the growth of e-commerce, and the need for enhanced customer experiences.
Retailers are increasingly focusing on omnichannel strategies to integrate physical stores with digital platforms, aiming to provide seamless shopping experiences.
While traditional department stores face challenges, those that adapt to changing market dynamics, embrace technology, and cater to shifting consumer demands can position themselves for long-term success.
The industry’s future will likely depend on innovation, efficient supply chain management, and the ability to personalize customer interactions.
FAQs
Department stores are large retail establishments that offer a wide range of products in various categories, such as clothing, home goods, electronics, beauty products, and more, all within separate departments under one roof.
Department stores carry a wide variety of goods across multiple categories, while specialty stores focus on a specific product category, such as electronics, beauty products, or footwear.
Many department stores offer loyalty programs that reward customers with points, discounts, or exclusive offers based on purchases. Signing up for these programs can provide benefits for frequent shoppers.
The best times to shop for sales at department stores are typically during seasonal events, such as Black Friday, Cyber Monday, New Year’s sales, or end-of-season clearance sales. Many stores also have holiday-specific sales like Christmas and Labor Day sales.
Some department stores offer discounts for senior citizens, students, or military personnel. These discounts may be available upon showing a valid ID at checkout, or they may be promoted through specific loyalty programs.
Discuss your needs with our analyst
Please share your requirements with more details so our analyst can check if they can solve your problem(s)