Table of Contents
- Introduction
- Editor’s Choice
- Water Pollution Statistics
- Bottled Water Statistics
- Reusable Water Bottles Market Statistics
- Reusable Water Bottles Statistics – By Material
- Reusable Water Bottles Recycling Statistics – By Type
- Weight Metrics
- Demographic Factors Influencing Reusable Water Bottles Purchases for Environmental Reasons Statistics
- Impact of COVID-19
- Consumer Preferences and Trends
- Key Goals and Targets
- Regulations, Policies, and Legislations for Reusable Water Bottles Statistics
- Recent Developments
- Conclusion
- FAQs
Introduction
Reusable Water Bottles Statistics: Reusable water bottles offer a sustainable alternative to single-use plastics. Available in materials such as plastic, stainless steel, glass, and aluminum.
These bottles are designed to be durable, often feature leak-proof caps, and are frequently BPA-free. Stainless steel bottles provide excellent insulation for temperature maintenance, while glass bottles ensure purity in taste.
Although glass is more fragile and heavier, and aluminum requires a protective coating, each material has its benefits.
Reusable bottles reduce environmental impact, offer long-term cost savings, and promote health by avoiding harmful chemicals. Regular cleaning and proper care are essential for maintaining their effectiveness and longevity.
Editor’s Choice
- In 2020, China led the global consumption of bottled water. Which consumed 27.8 billion gallons, making it the largest market by volume.
- The global reusable water bottles market revenue reached USD 9.7 billion in 2023.
- By 2032, the market is projected to achieve USD 14.6 billion in revenue. With USD 9.1 billion from offline channels and USD 5.5 billion from online channels. Indicating robust and sustained growth across both distribution channels over the forecast period.
- The market for reusable water bottles is predominantly driven by insulated bottles, which hold a significant market share of 62%.
- As of 2018, Norway led the world in PET plastic bottle recycling with an impressive recycling rate of 97%.
- In the past year, 69% of Gen Z individuals purchased a reusable water bottle due to its environmental sustainability, a significantly higher rate compared to other age groups.
- In the European Union, the 2021 Single-Use Plastics Directive has been pivotal, mandating member states to promote reusable alternatives. Particularly through the principle of Extended Producer Responsibility (EPR), where producers are responsible for the costs of waste management.
Water Pollution Statistics
Serious Water Pollution Incidents
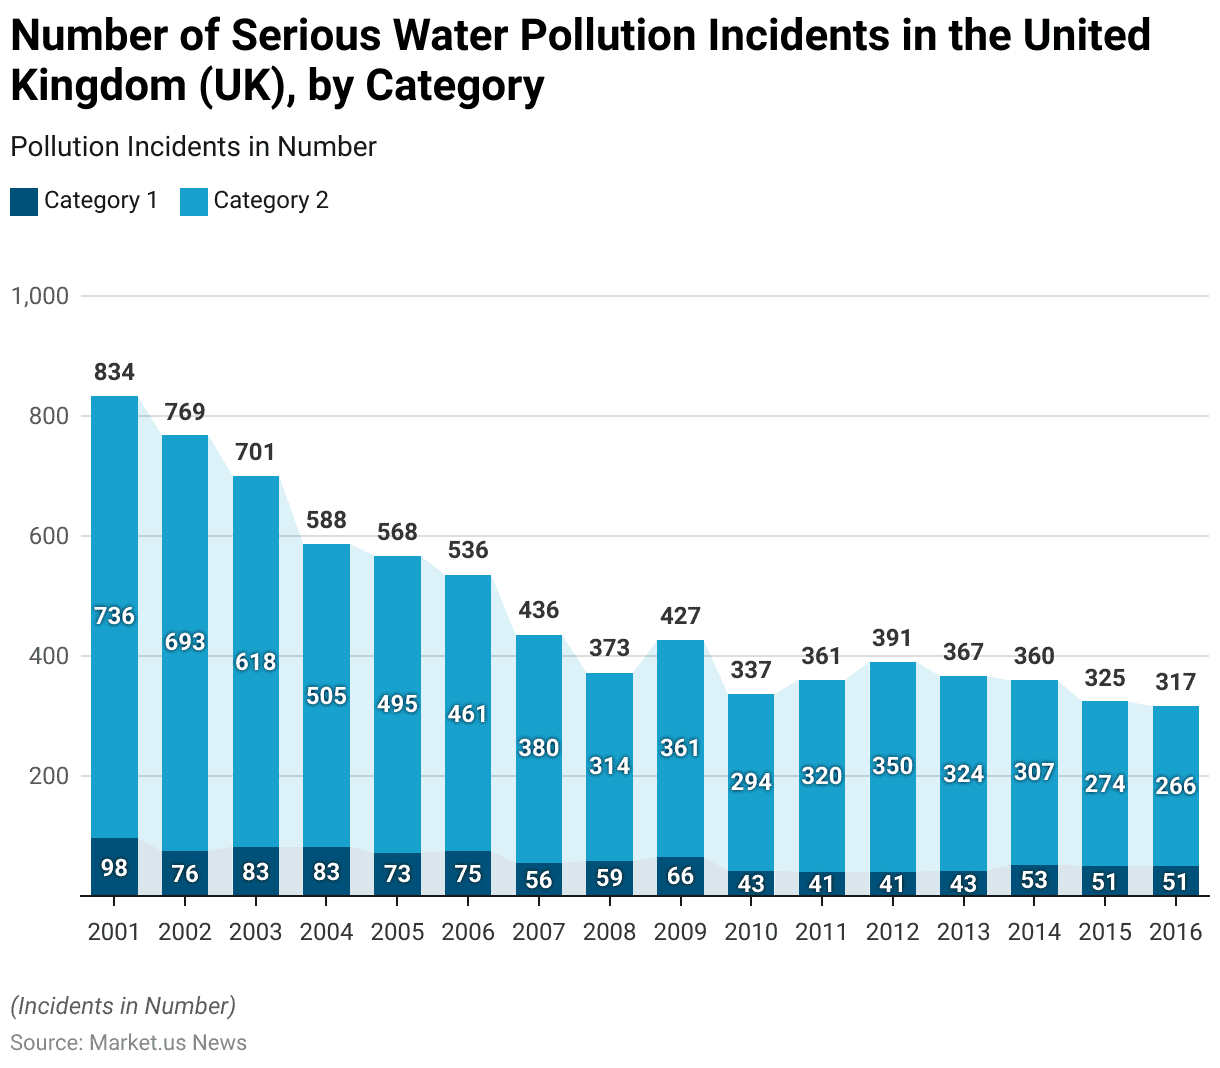
- From 2001 to 2016, the United Kingdom experienced a notable decline in the number of serious water pollution incidents, categorized into two severity levels.
- In 2001, there were 98 incidents classified as Category 1, the most severe, and 736 incidents classified as Category 2. Over the following years, both categories saw a gradual decrease.
- By 2003, Category 1 incidents slightly declined to 83, while Category 2 incidents dropped to 618.
- This downward trend continued, with Category 1 incidents fluctuating but generally decreasing, reaching 73 in 2005 and 75 in 2006.
- Category 2 incidents showed a more consistent decline, falling to 495 in 2005 and further to 461 in 2006.
- The number of incidents in both categories continued to decrease significantly over the next decade.
- By 2010, Category 1 incidents had reduced to 43, and Category 2 incidents to 294.
- The trend of decreasing water pollution incidents persisted. With Category 1 incidents stabilizing around 41 to 53 per year from 2011 to 2016.
- By 2016, the number of Category 1 incidents stood at 51, while Category 2 incidents had dropped to 266.
- This data reflects the UK’s progress in managing and reducing serious water pollution incidents over the last 15 years.
(Source: Statista)
Public Concern About the Pollution of Drinking Water
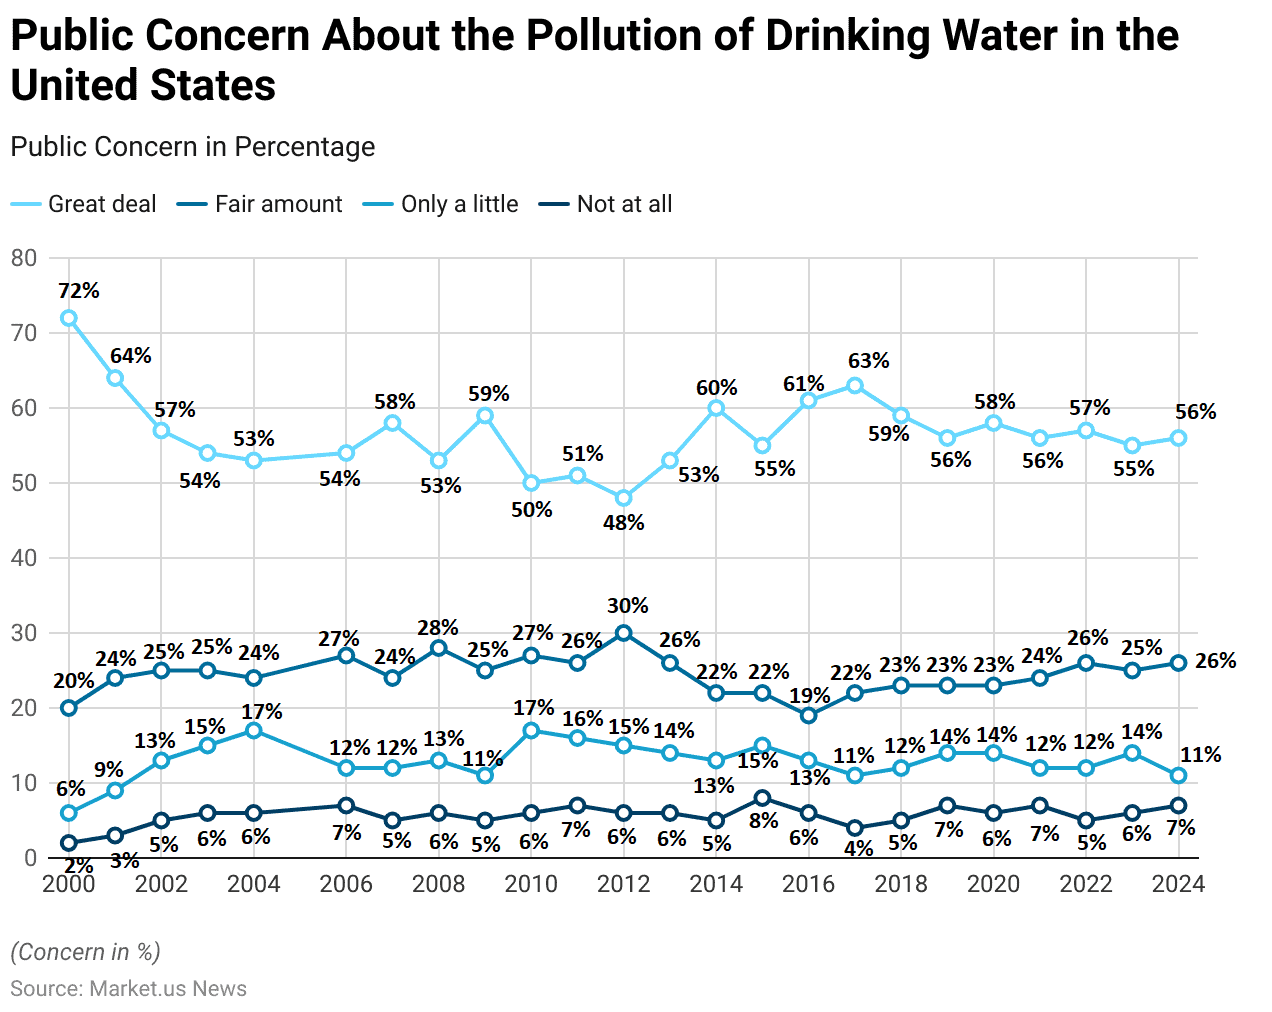
- Public concern about the pollution of drinking water in the United States has varied over the years. With a significant portion of the population consistently expressing a high level of concern.
- In 2000, 72% of respondents indicated they were concerned “a great deal” about water pollution. While 20% expressed a “fair amount” of concern and smaller percentages, 6% and 2%, reported being concerned “only a little” or “not at all,” respectively.
- This high level of concern gradually declined over the years, with 64% of respondents in 2001 indicating “a great deal” of concern, and by 2004, this figure had decreased to 53%.
- From 2006 to 2010, the percentage of those with “a great deal” of concern fluctuated between 50% and 58%, with corresponding variations in the other levels of concern.
- In the mid-2010s, concern levels saw a resurgence. With 60% of respondents in 2014 and 61% in 2016 indicating “a great deal” of concern.
- By 2017, this figure peaked at 63%, accompanied by a decrease in those expressing only “a little” or “not at all” concern.
- However, after 2017, concern levels slightly decreased. With 59% expressing “a great deal” of concern in 2018 and 56% in 2019.
- This pattern of slight fluctuations continued, with 58% expressing “a great deal” of concern in 2020 and the figure remaining relatively stable at 56% in both 2021 and 2024.
- Throughout this period, the percentage of respondents with a “fair amount” of concern remained relatively consistent, generally around 24% to 26%. While those with lower levels of concern fluctuated slightly but remained a smaller segment of the population.
- This data highlights a sustained and significant concern about drinking water pollution among the American public over the past two decades.
(Source: Statista)
Global Air and Water Quality Satisfaction
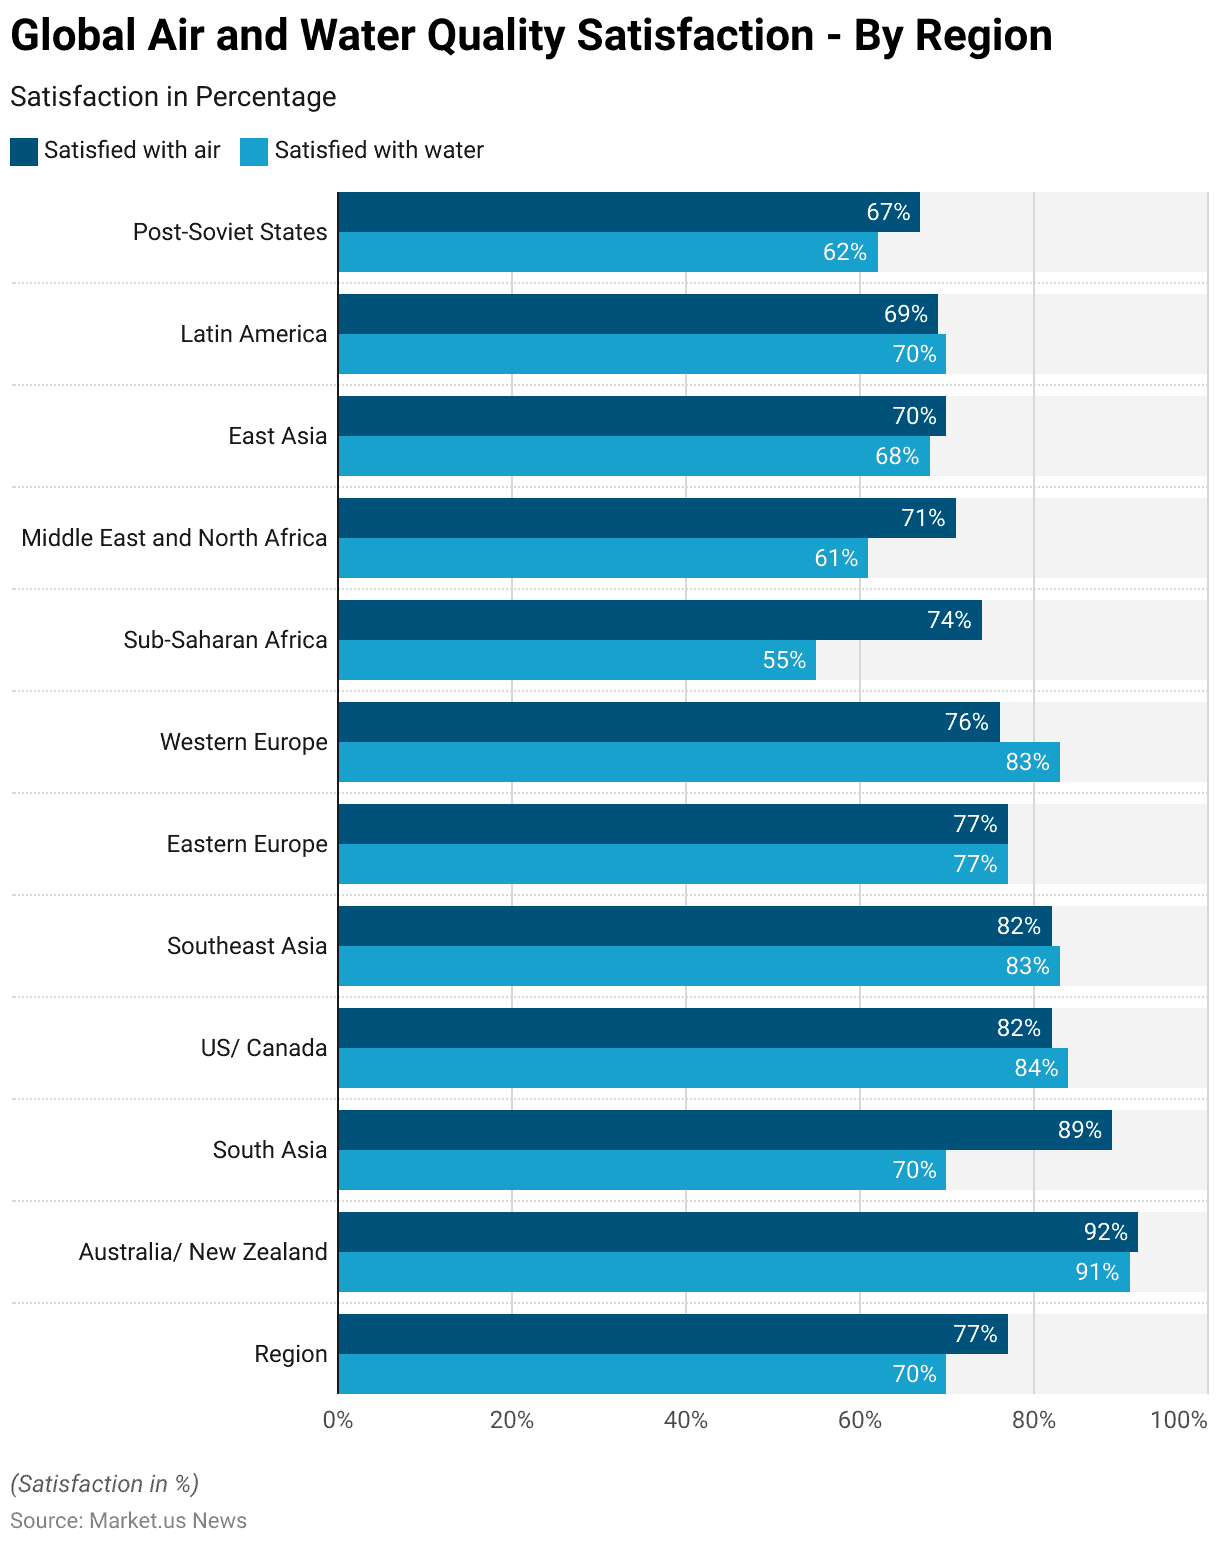
- In 2017, global satisfaction with air and water quality varied significantly by region.
- On average, 77% of people worldwide were satisfied with air quality, while 70% were satisfied with water quality.
- Australia and New Zealand had the highest levels of satisfaction. With 92% satisfied with air quality and 91% satisfied with water quality.
- In South Asia, 89% were satisfied with air quality, but only 70% were satisfied with water quality.
- In the US and Canada, satisfaction was relatively high, with 82% satisfied with air quality and 84% with water quality.
- Southeast Asia also reported high satisfaction rates, with 82% for air quality and 83% for water quality.
- Similarly, in Western Europe, 76% were satisfied with air quality and 83% with water quality. While Eastern Europe showed equal satisfaction levels for both air and water at 77%.
- In contrast, regions such as Sub-Saharan Africa, the Middle East, and North Africa reported lower satisfaction levels.
- In Sub-Saharan Africa, 74% were satisfied with air quality, but only 55% were satisfied with water quality.
- The Middle East and North Africa had 71% satisfied with air quality and 61% with water quality. East Asia also had lower satisfaction levels, with 70% for air quality and 68% for water quality.
- Latin America showed similar satisfaction levels, with 69% for air quality and 70% for water quality.
- The post-Soviet states had the lowest satisfaction rates among the regions. With 67% satisfied with air quality and 62% satisfied with water quality.
- These figures indicate that while many regions report high satisfaction with air and water quality, significant regional disparities exist. Particularly in water quality satisfaction, highlighting the varying environmental conditions and challenges faced across the globe.
(Source: Statista)
Bottled Water Statistics
Consumption of Bottled Water – By Country
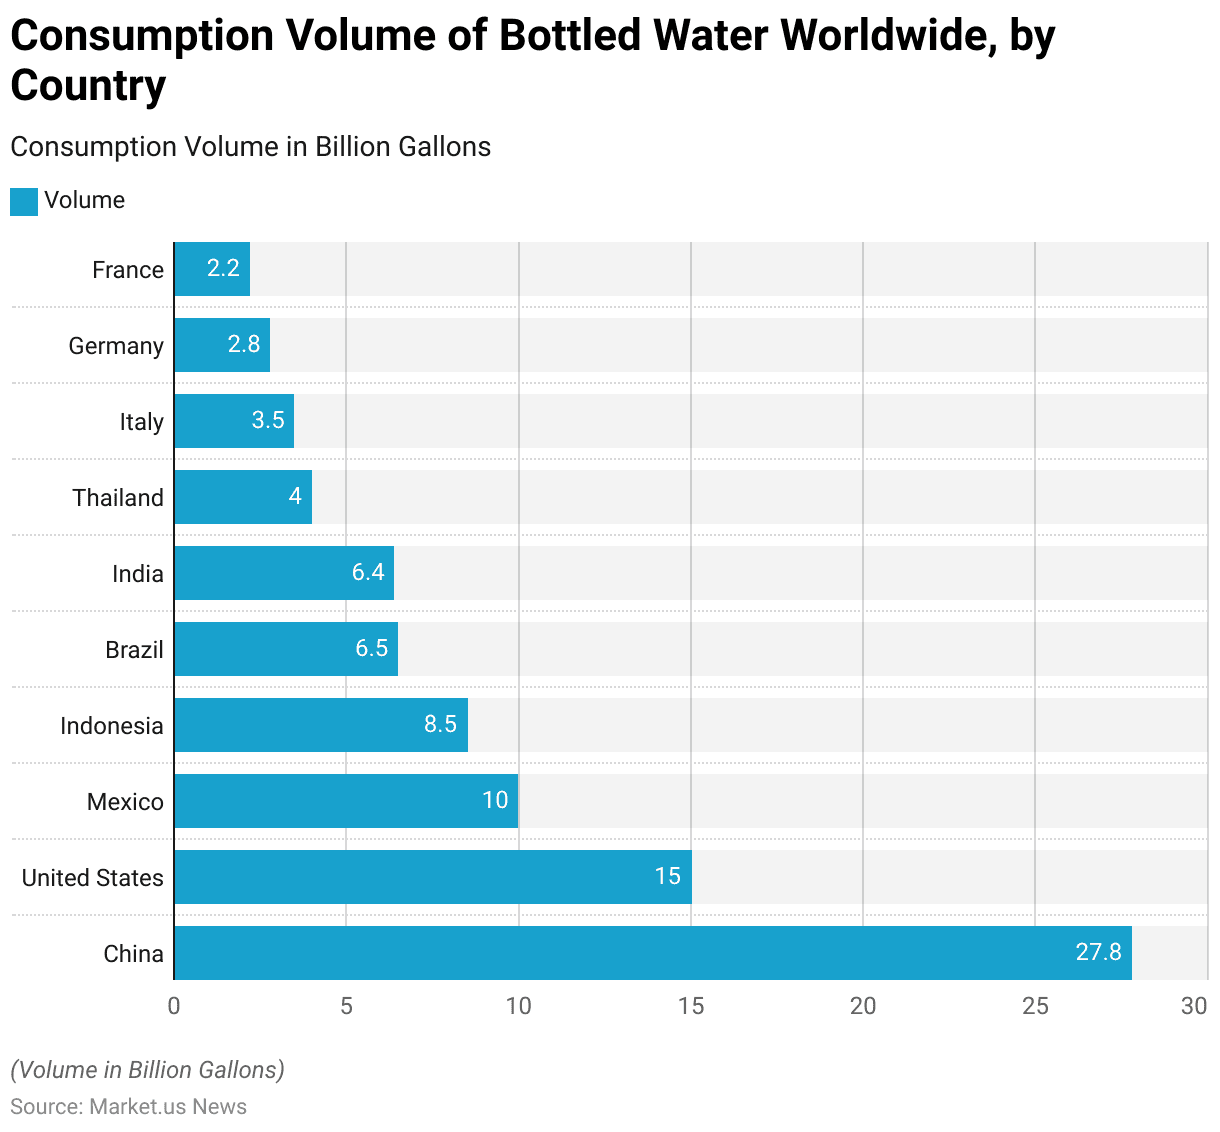
- In 2020, China led the global consumption of bottled water. Which consumed 27.8 billion gallons, making it the largest market by volume.
- The United States followed as the second-largest consumer with 15 billion gallons.
- Mexico ranked third, consuming 10 billion gallons. Indonesia and
- Brazil was also a significant market, with consumption volumes of 8.5 billion and 6.5 billion gallons, respectively.
- India closely followed Brazil with 6.4 billion gallons.
- Other notable countries included Thailand, which consumed 4 billion gallons; and Italy. Which consumed 3.5 billion gallons; Germany, which consumed 2.8 billion gallons; and France, which consumed 2.2 billion gallons.
- This data highlights the widespread demand for bottled water across diverse global markets. With Asia and North America are the dominant regions in terms of consumption volume.
Sales of Bottled Water – By Country
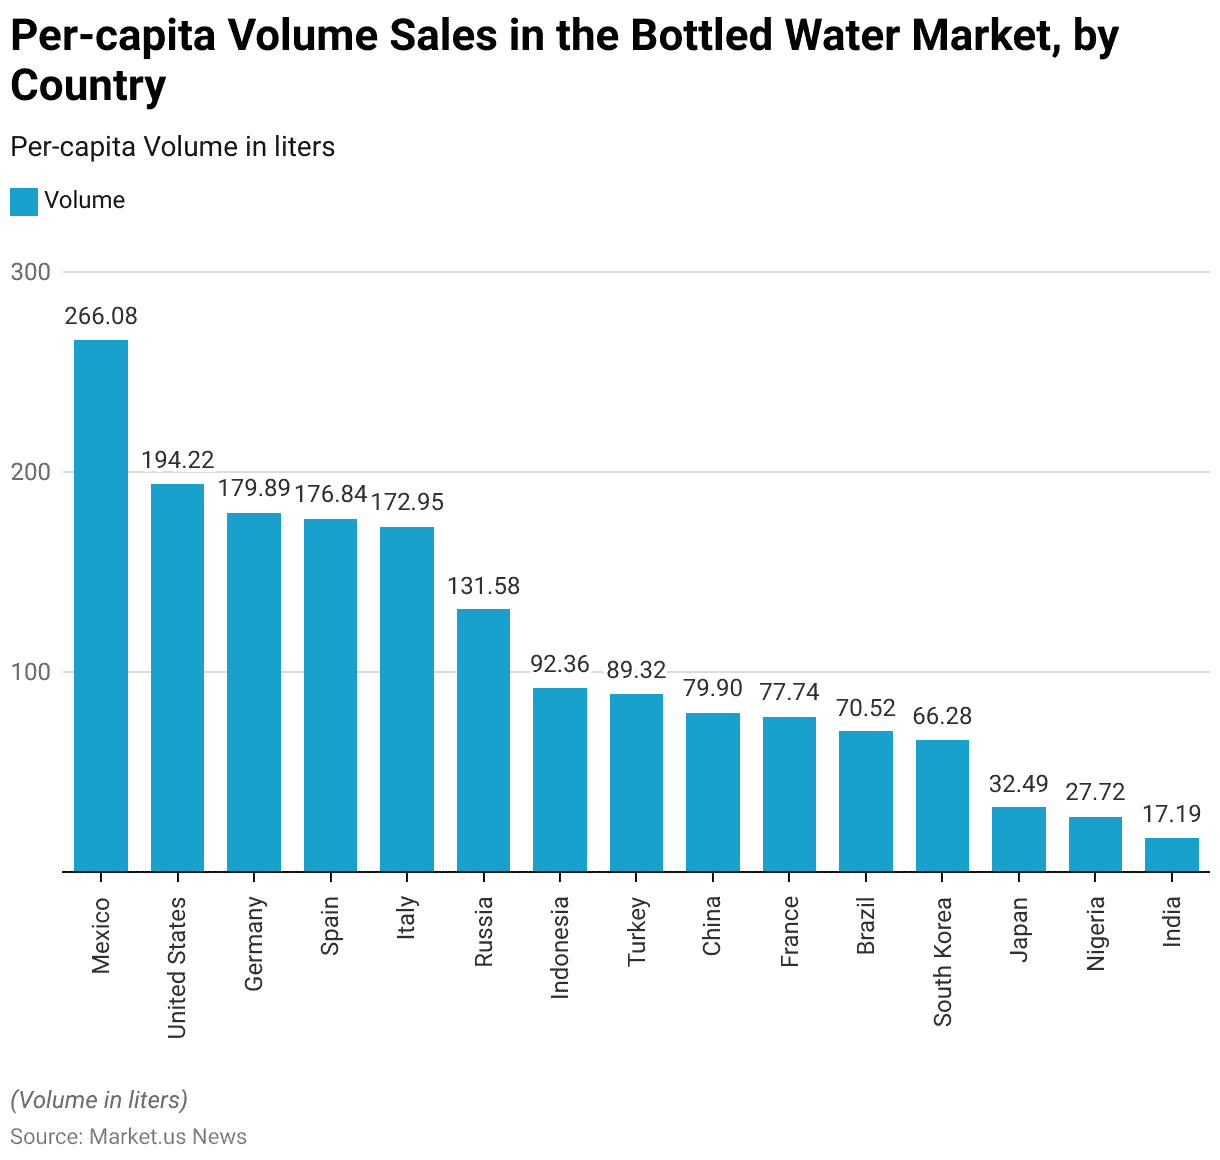
- In 2023, Mexico led the world in per-capita bottled water consumption, with an impressive 266.08 liters per person.
- The United States followed with 194.22 liters, and Germany was close behind at 179.89 liters.
- Spain and Italy also had high per-capita consumption rates, with 176.84 liters and 172.95 liters, respectively.
- Russia’s per-capita volume was 131.58 liters, while Indonesia and Turkey recorded 92.36 liters and 89.32 liters per person, respectively.
- In China, the per-capita consumption was 79.9 liters, slightly higher than France’s 77.74 liters.
- Brazil, South Korea, and Japan had lower consumption rates at 70.52 liters, 66.28 liters, and 32.49 liters, respectively.
- In contrast, Nigeria and India had the lowest per-capita consumption among the listed countries, with 27.72 liters and 17.19 liters, respectively.
- This data reflects significant regional variations in bottled water consumption, with the highest rates observed in North America and Europe. At the same time, Asian and African countries generally show lower per-capita volumes.
(Source: Statista)
Price of Bottled Water
2018-2023
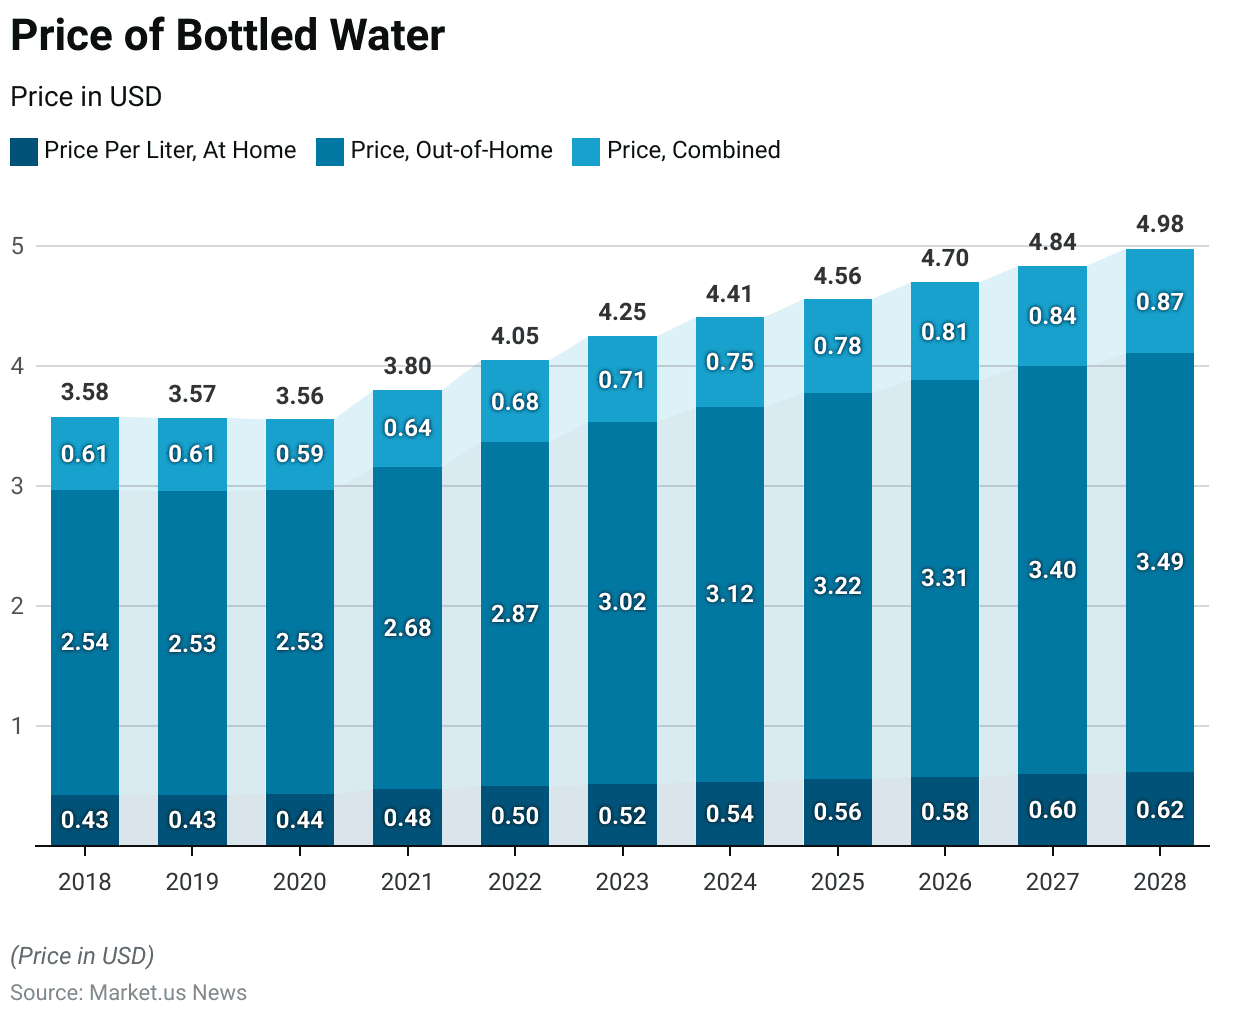
- The price of bottled water has shown a gradual increase across different purchase settings from 2018 to 2023.
- In 2018, the price per liter for at-home consumption was USD 0.43. While the price for out-of-home consumption was significantly higher at USD 2.54. Resulting in a combined average price of USD 0.61. This pricing structure remained stable through 2019.
- However, in 2020, the price per liter for at-home consumption increased slightly to USD 0.44. While out-of-home prices held steady at USD 2.53. Bringing the combined price down marginally to USD 0.59.
- The upward trend became more pronounced in subsequent years. With the at-home price per liter rising to USD 0.48 in 2021 and the out-of-home price increasing to USD 2.68. Resulting in a combined price of USD 0.64.
- By 2022, the price per liter at home will reach USD 0.50. With out-of-home prices climbing to USD 2.87 and a combined price of USD 0.68.
- This trend continued through 2023, with at-home prices reaching USD 0.52 per liter and out-of-home prices rising to USD 3.02, leading to a combined price of USD 0.71.
2024-2028
- Projections for the following years indicate continued price increases, with at-home prices expected to reach USD 0.54 in 2024 and USD 0.56 in 2025. While out-of-home prices are projected to rise to USD 3.12 and USD 3.22, respectively.
- The combined prices for these years are forecasted to be USD 0.75 in 2024 and USD 0.78 in 2025.
- By 2026, the at-home price is expected to reach USD 0.58 per liter, with out-of-home prices at USD 3.31 and a combined price of USD 0.81.
- This upward trajectory is projected to continue through 2028, with the at-home price per liter reaching USD 0.62, out-of-home prices climbing to USD 3.49, and the combined price expected to be USD 0.87, reflecting the sustained increase in the cost of bottled water across all purchasing environments.
(Source: Statista)
Reusable Water Bottles Market Statistics
Global Reusable Water Bottles Market Size Statistics
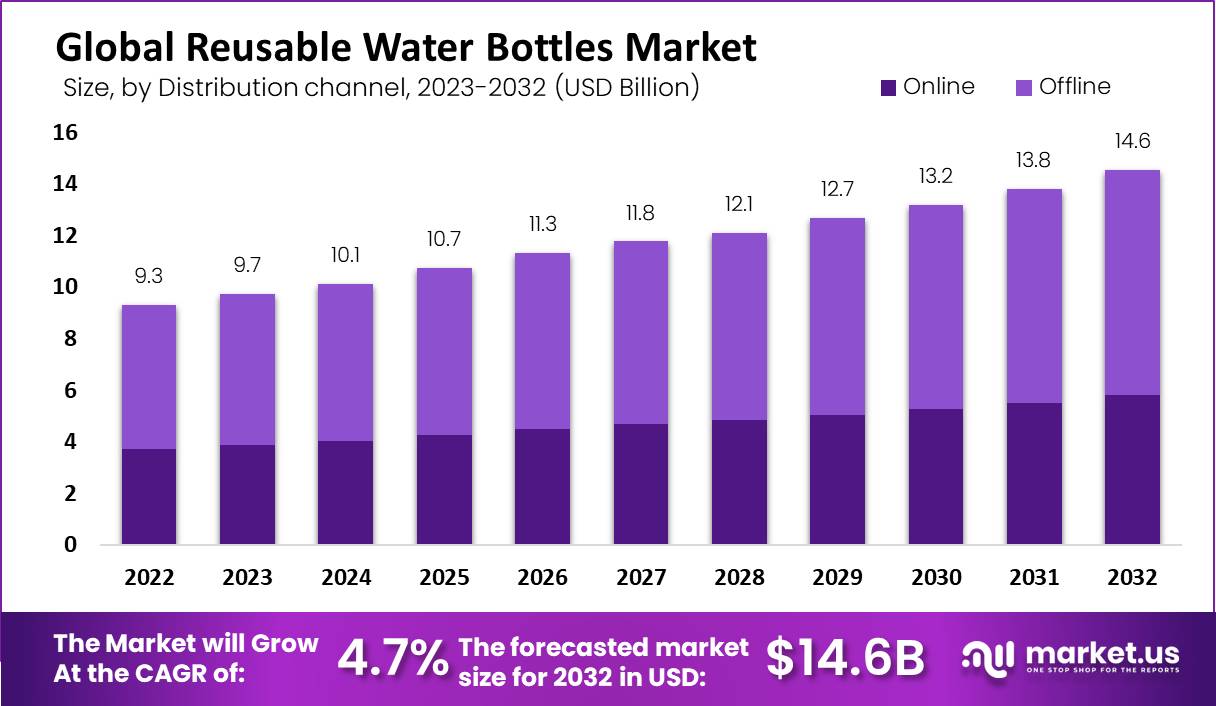
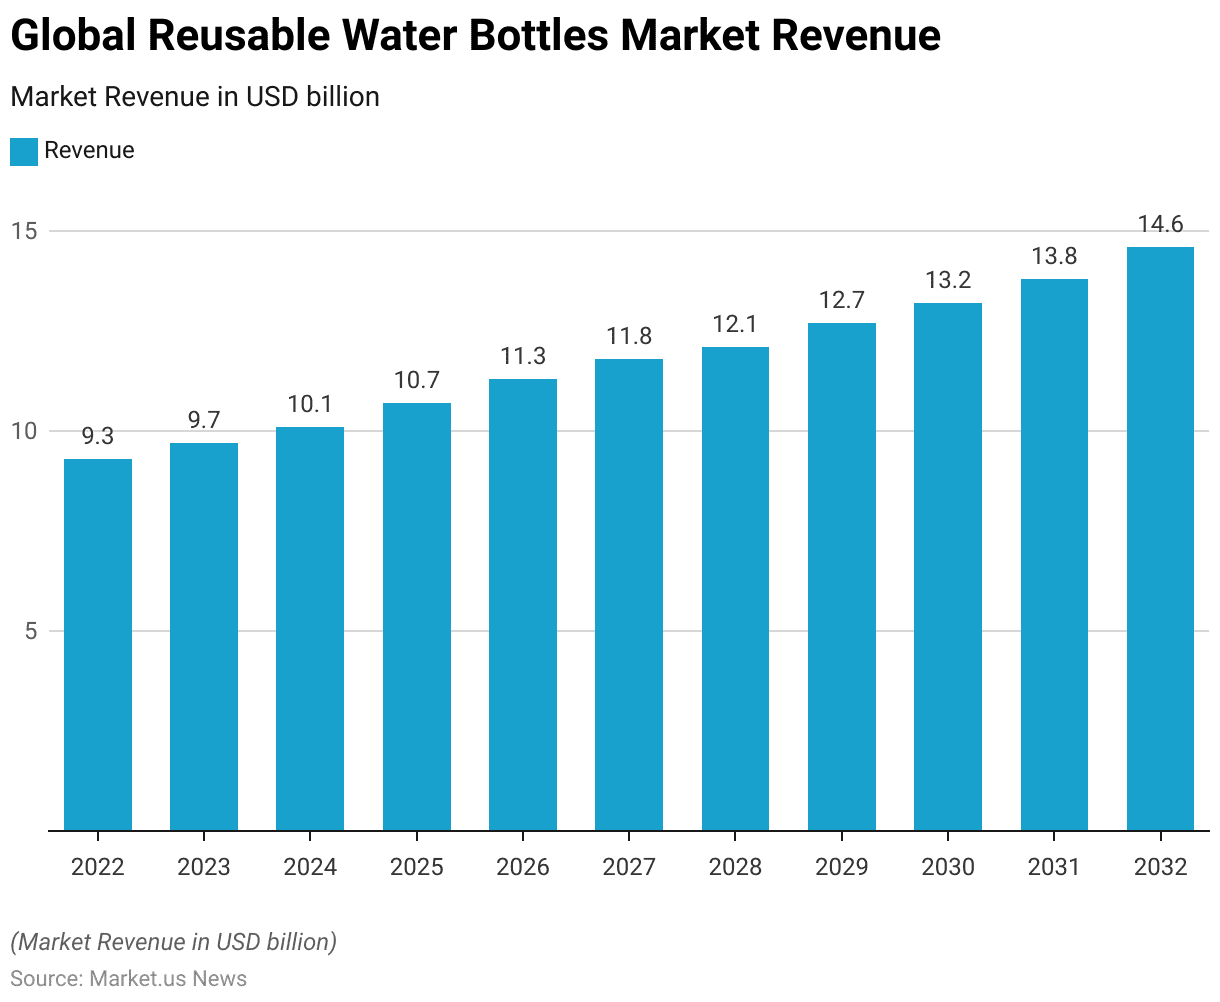
- The global reusable water bottles market has demonstrated a consistent upward trajectory in revenue at a CAGR of 4.7%, beginning with USD 9.3 billion in 2022.
- This figure increased to USD 9.7 billion in 2023, with projections indicating continued growth to USD 10.1 billion by 2024.
- The market is expected to expand further, reaching USD 10.7 billion in 2025 and USD 11.3 billion in 2026.
- By 2027, revenue is anticipated to climb to USD 11.8 billion, with subsequent growth to USD 12.1 billion in 2028.
- The trend is projected to persist, with market revenues forecasted to rise to USD 12.7 billion in 2029, USD 13.2 billion in 2030, and USD 13.8 billion in 2031.
- By 2032, the market is expected to achieve a revenue of USD 14.6 billion, reflecting sustained growth throughout the decade.
(Source: market.us)
Reusable Water Bottles Market Size – By Distribution Channel Statistics
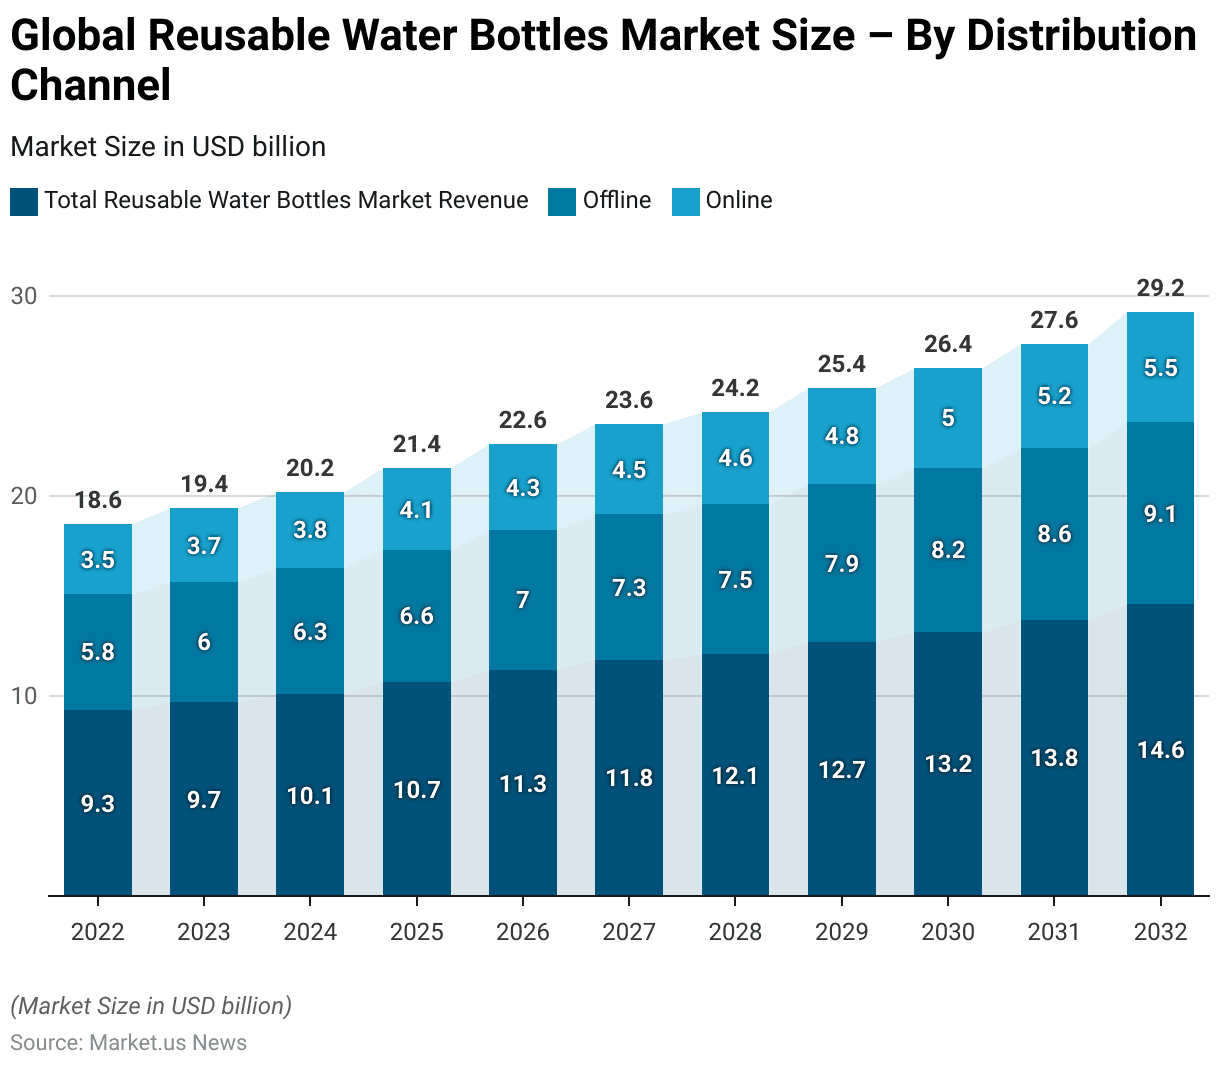
- The global reusable water bottles market, segmented by distribution channel, has shown a steady increase in revenue across both offline and online channels from 2022 to 2032.
- In 2022, the market generated USD 9.3 billion in total revenue, with USD 5.8 billion attributed to offline sales and USD 3.5 billion to online sales.
- By 2023, revenues rose to USD 9.7 billion, with offline channels contributing USD 6.0 billion and online channels USD 3.7 billion.
- This growth trend is expected to continue, with total market revenue reaching USD 10.1 billion in 2024 (USD 6.3 billion offline, USD 3.8 billion online) and USD 10.7 billion in 2025 (USD 6.6 billion offline, USD 4.1 billion online).
- The market is projected to grow to USD 11.3 billion by 2026, with offline sales at USD 7.0 billion and online sales at USD 4.3 billion.
- By 2027, total market revenue is expected to increase to USD 11.8 billion (USD 7.3 billion offline, USD 4.5 billion online), and by 2028, to USD 12.1 billion (USD 7.5 billion offline, USD 4.6 billion online).
- The market is forecasted to reach USD 12.7 billion in 2029 (USD 7.9 billion offline, USD 4.8 billion online) and USD 13.2 billion in 2030 (USD 8.2 billion offline, USD 5.0 billion online).
- By 2031, total market revenue is expected to grow to USD 13.8 billion, with USD 8.6 billion generated offline and USD 5.2 billion online.
- Finally, by 2032, the market is projected to achieve USD 14.6 billion in revenue, with USD 9.1 billion from offline channels and USD 5.5 billion from online channels, indicating robust and sustained growth across both distribution channels over the forecast period.
(Source: market.us)
Global Reusable Water Bottles Market Share – By Type Statistics
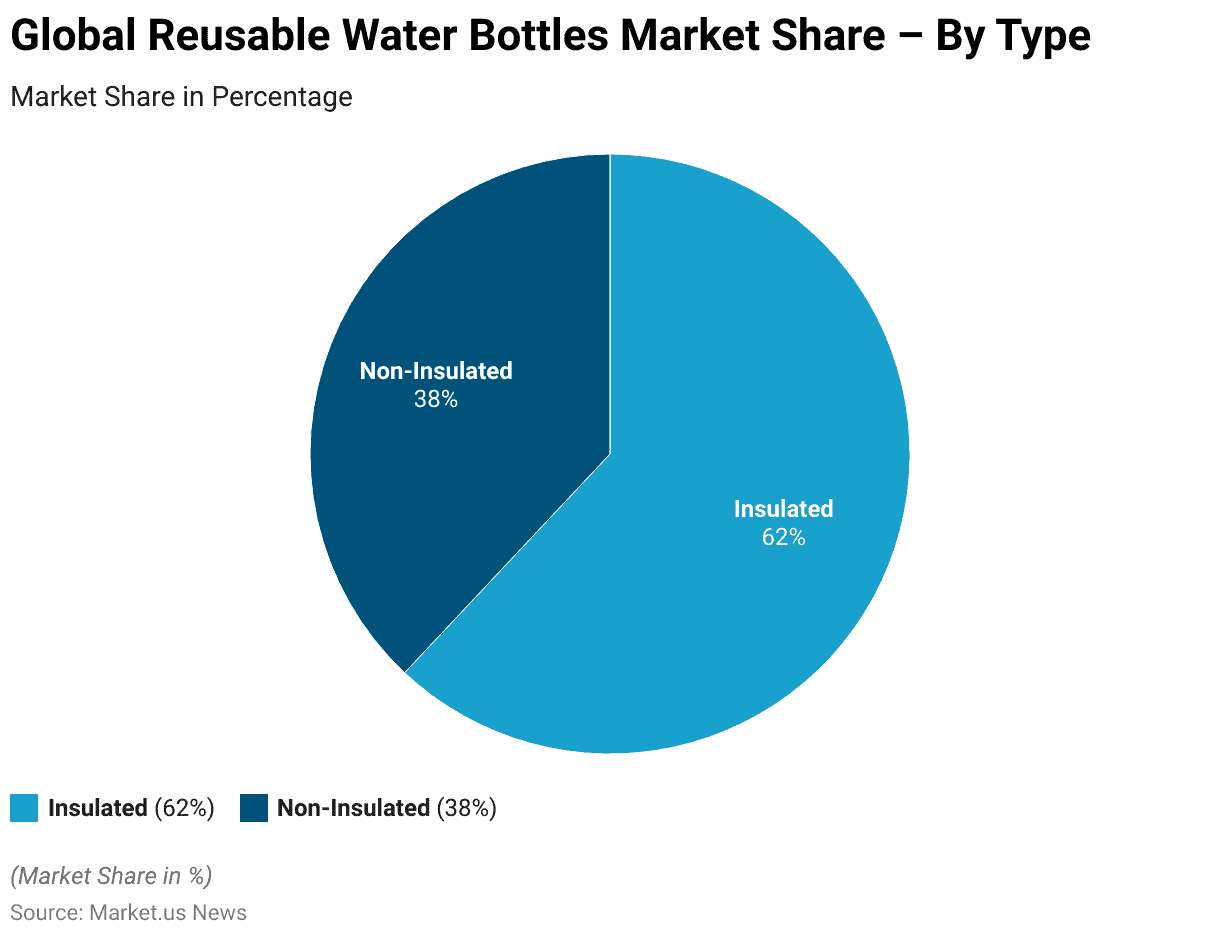
- The market for reusable water bottles is predominantly driven by insulated bottles, which hold a significant market share of 62%.
- In contrast, non-insulated bottles account for the remaining 38% of the market.
- This distribution indicates a strong consumer preference for insulated bottles, likely due to their ability to maintain the temperature of beverages for extended periods, offering added convenience and functionality.
- The market dynamics suggest that insulated bottles will continue to lead, driven by consumer demand for performance and quality in reusable water bottle products.
(Source: market.us)
Reusable Water Bottles Statistics – By Material
Value of The Reusable Water Bottles Market – By Material Type Statistics
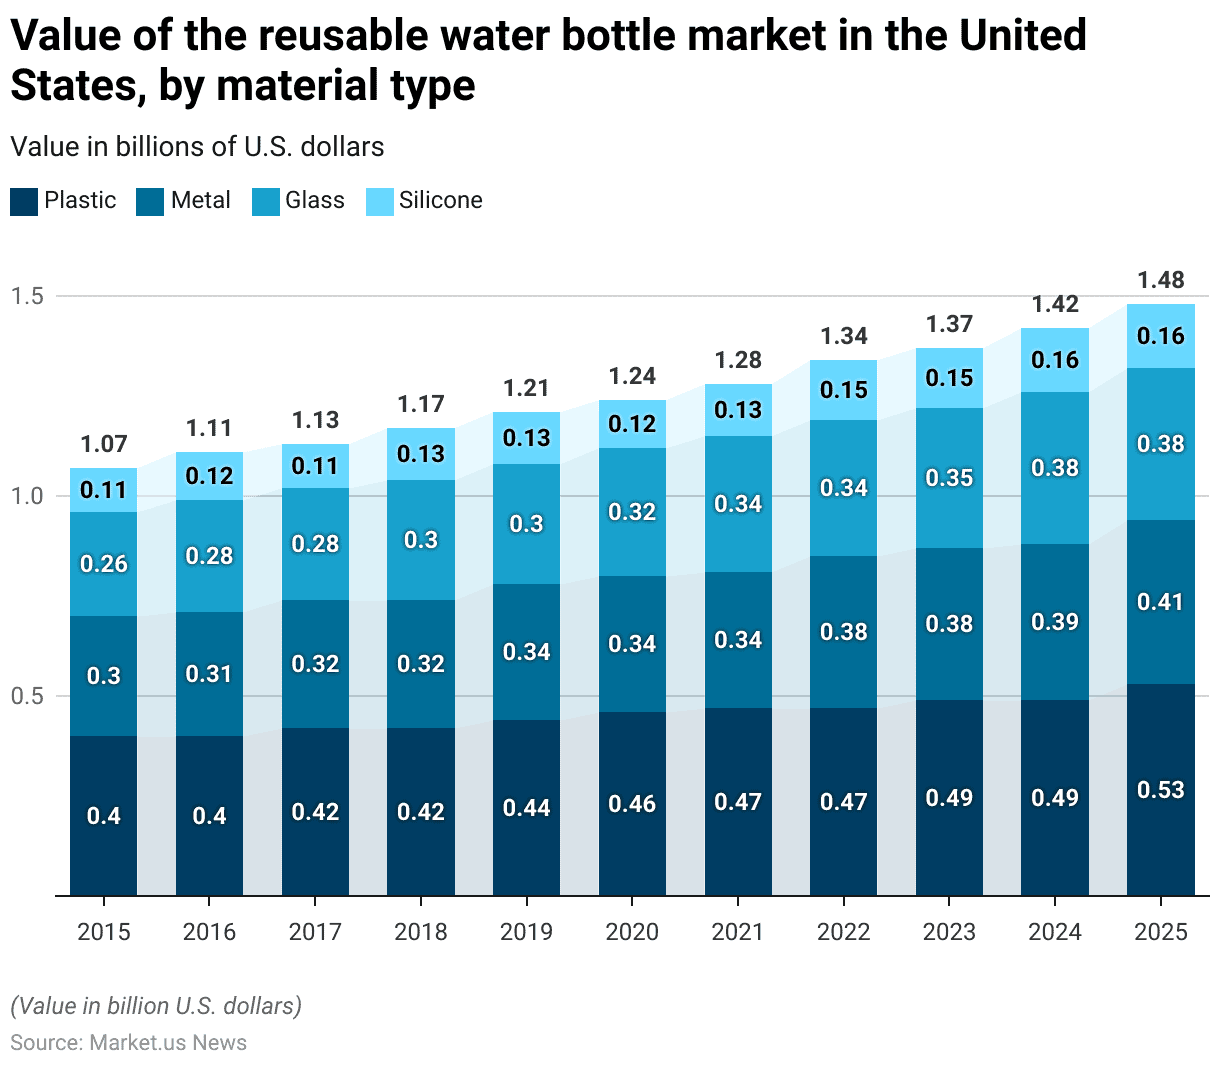
- The value of the reusable water bottle market in the United States has exhibited steady growth across various material types from 2015 to 2025.
- In 2015, the market for plastic water bottles was valued at USD 0.4 billion, with metal bottles at USD 0.3 billion, glass at USD 0.26 billion, and silicone at USD 0.11 billion.
- By 2020, the market for plastic bottles grew to USD 0.46 billion, while metal and glass bottles reached USD 0.34 billion each, and silicone maintained a value of USD 0.12 billion.
- The upward trend continued into 2021 and 2022, with plastic bottles reaching USD 0.47 billion, metal bottles increasing to USD 0.38 billion by 2022, and glass bottles also reaching USD 0.34 billion in 2021, rising slightly to USD 0.35 billion in 2023.
- Silicone bottles saw a modest increase to USD 0.15 billion by 2022.
- Projections for 2025 suggest that plastic bottles will continue to lead the market, with an estimated value of USD 0.53 billion.
- Metal bottles are expected to reach USD 0.41 billion, while glass bottles are forecasted to grow to USD 0.38 billion.
- Silicone bottles, although the smallest segment, are anticipated to increase to USD 0.16 billion.
- This data underscores the growing demand for reusable water bottles across all material types, with a particularly strong emphasis on plastic and metal bottles.
(Source: Statista)
Reusable Water Bottles Recycling Statistics – By Type
PET Reusable Plastic Water Bottles Recycling Rate – By Country Statistics
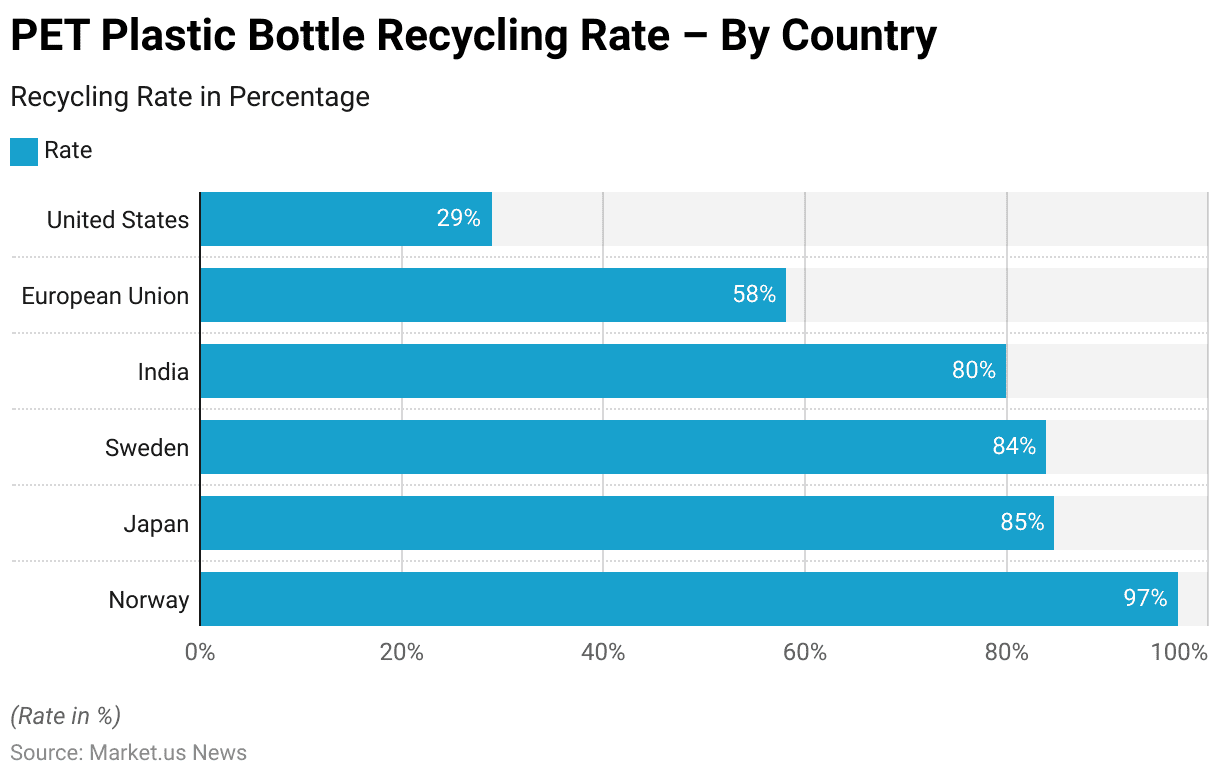
- As of 2018, Norway led the world in PET plastic bottle recycling with an impressive recycling rate of 97%.
- Japan and Sweden followed, with recycling rates of 84.8% and 84%, respectively. India also demonstrated strong recycling efforts, achieving a rate of 80%.
- The European Union, as a whole, had a recycling rate of 58.2%, indicating varying levels of recycling efficiency across its member states.
- In contrast, the United States lagged significantly behind, with a recycling rate of only 28.9%.
- This data underscores the substantial differences in recycling practices across different regions, with some countries achieving near-total recycling while others struggle with significantly lower rates.
(Source: Statista)
Recycling Rate of Post-Consumer Plastic Water Bottles – By Reusable Material Type Statistics
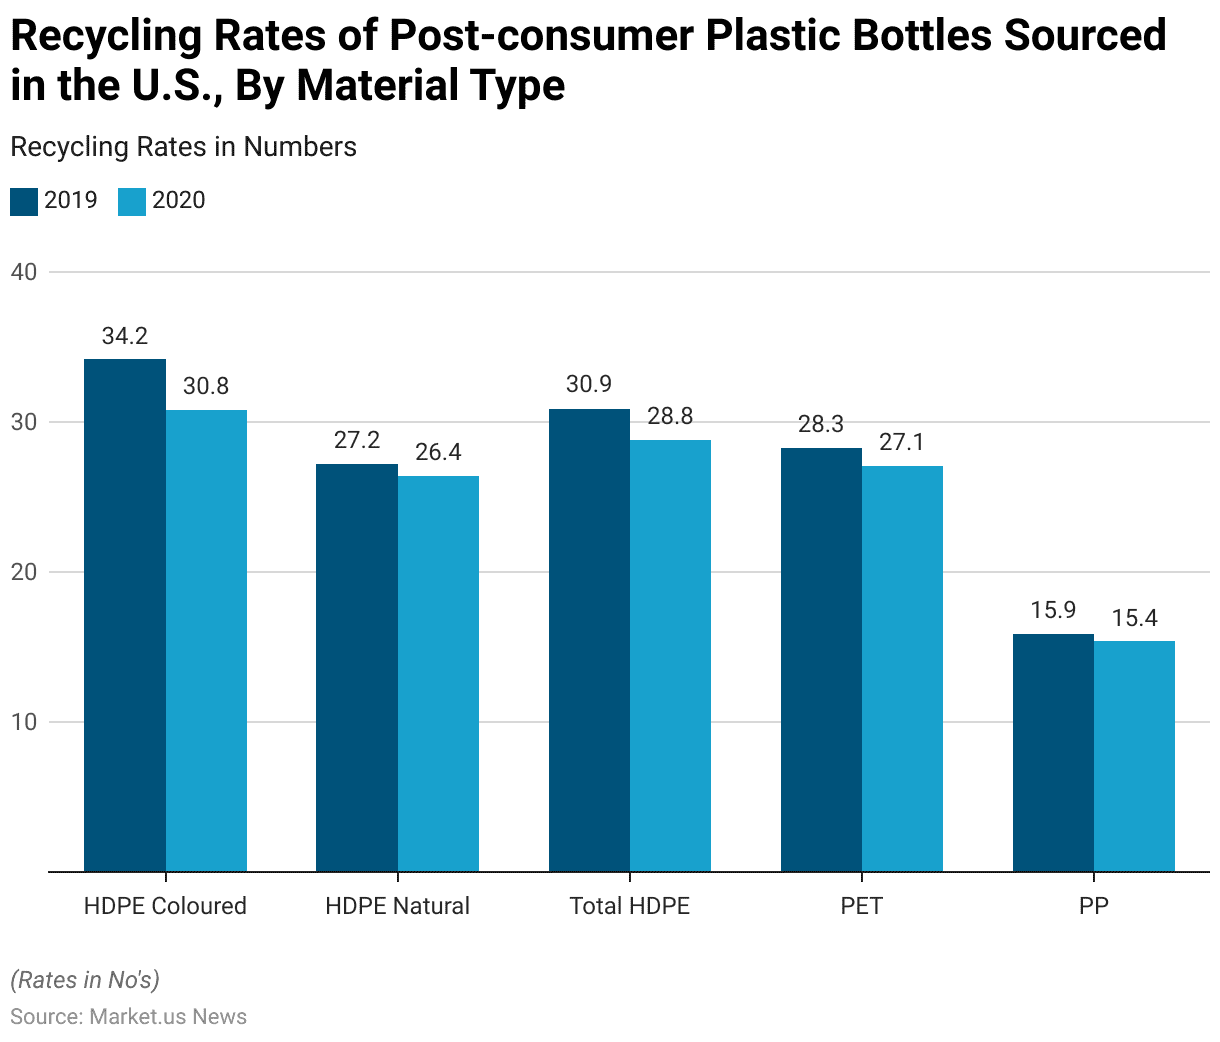
- The recycling rates of post-consumer plastic bottles in the United States showed a slight decline across various material types from 2019 to 2020.
- In 2019, the recycling rate for HDPE (High-Density Polyethylene) colored bottles was 34.2%, which decreased to 30.8% in 2020.
- Similarly, HDPE natural bottles saw a decline from 27.2% in 2019 to 26.4% in 2020.
- The overall recycling rate for total HDPE bottles fell from 30.9% in 2019 to 28.8% in 2020.
- PET (Polyethylene Terephthalate) bottles also experienced a decrease in recycling rates, dropping from 28.3% in 2019 to 27.1% in 2020.
- Additionally, the recycling rate for PP (Polypropylene) bottles slightly decreased from 15.9% in 2019 to 15.4% in 2020.
- These trends indicate a general decline in the recycling rates of post-consumer plastic bottles in the United States during this period, reflecting challenges in maintaining or improving recycling efficiency.
(Source: Statista)
PET Bottles Recycled by Consumers – By Reusable Building Type Statistics
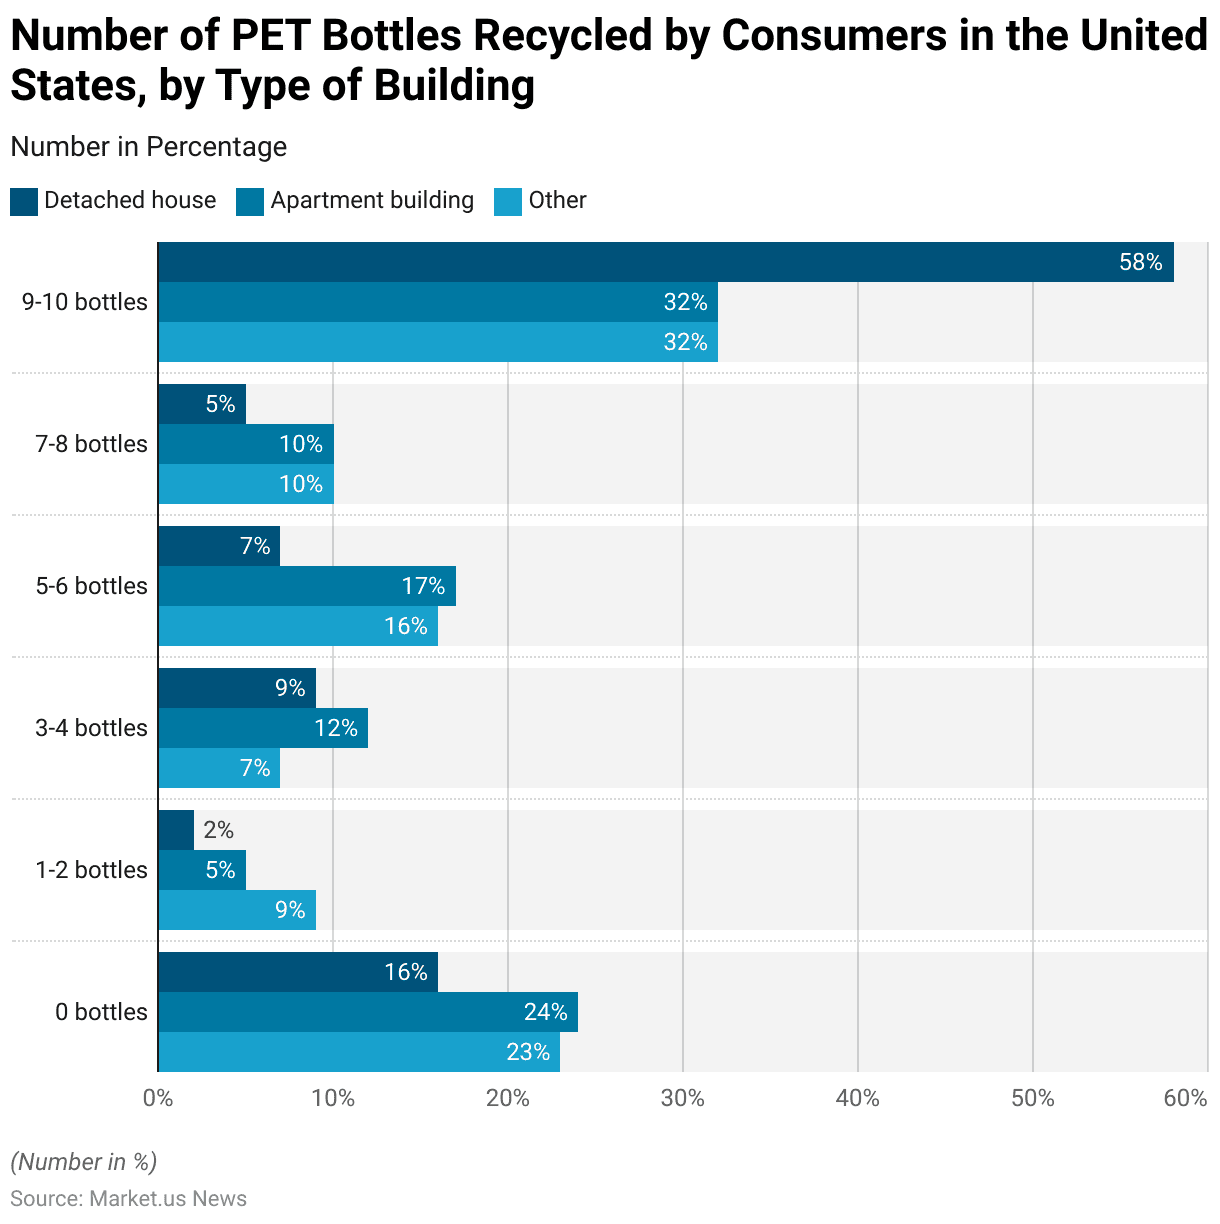
- In 2017, the recycling behavior of polyethylene terephthalate (PET) bottles among consumers in the United States varied significantly depending on the type of building in which they resided.
- Among those living in detached houses, 58% reported recycling 9-10 bottles, while 16% did not recycle any bottles.
- In apartment buildings, 32% of residents recycled 9-10 bottles, but a higher proportion, 24%, did not recycle any bottles.
- Residents of other types of housing, such as trailer parks or gated communities, showed similar behavior, with 32% recycling 9-10 bottles and 23% recycling none.
- For those who recycled smaller quantities, 2% of detached house residents, 5% of apartment residents, and 9% of those in other housing types recycled 1-2 bottles.
- Recycling rates for 3-4 bottles were relatively low across all housing types, with 9% in detached houses, 12% in apartments, and 7% in other housing.
- Additionally, 7% of detached house residents, 17% of apartment residents, and 16% of those in other housing types recycled 5-6 bottles, while 5%, 10%, and 10%, respectively, recycled 7-8 bottles.
- This data indicates that residents of detached houses were more likely to recycle higher quantities of PET bottles, whereas a significant portion of apartment residents and those in other housing types recycled fewer bottles or none at all.
(Source: Statista)
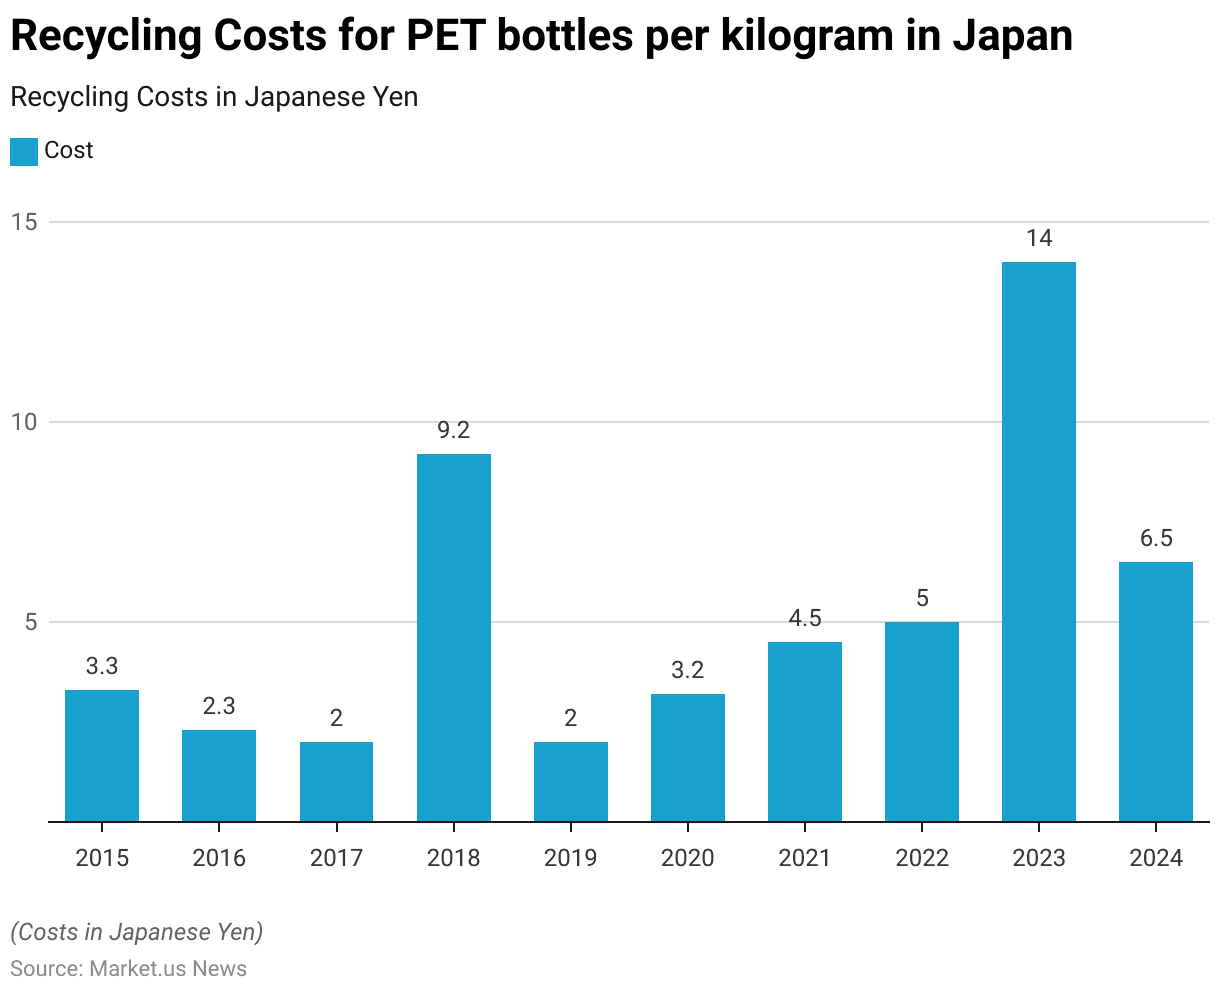
Recycling Costs for Reusable Polyethylene Terephthalate (PET) Water Bottles Statistics
- The recycling costs for polyethylene terephthalate (PET) bottles in Japan have experienced significant fluctuations from 2015 to 2024.
- In 2015, the cost per kilogram was 3.3 Japanese yen, which decreased to 2.3 yen in 2016 and further to 2 yen in 2017.
- However, 2018 saw a substantial spike in recycling costs, rising sharply to 9.2 yen per kilogram.
- This increase was followed by a return to the previous lower levels, with costs stabilizing at 2 yen in 2019.
- In 2020, the recycling cost increased again to 3.2 yen per kilogram, continuing to rise in 2021 and 2022 to 4.5 yen and 5 yen, respectively.
- A dramatic surge occurred in 2023, with costs reaching 14 yen per kilogram, the highest in the observed period.
- However, projections for 2024 indicate a reduction in costs to 6.5 yen per kilogram.
- These variations reflect the changing economic and regulatory factors affecting recycling in Japan over the years.
(Source: Statista)
Weight Metrics
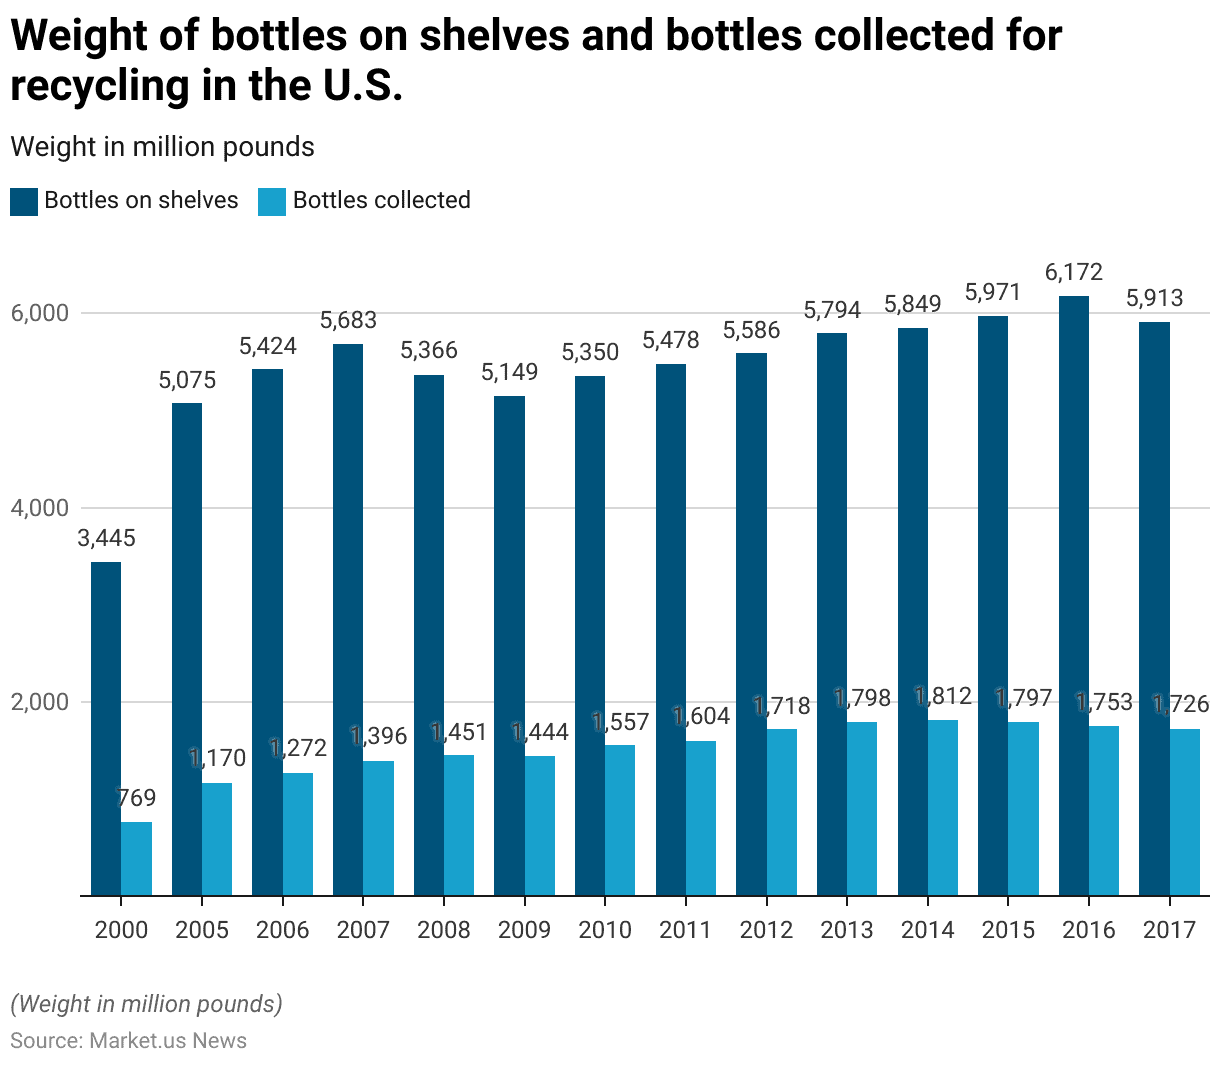
- Between 2000 and 2017, the weight of bottles placed on shelves and collected for recycling in the United States saw significant growth.
- In 2000, 3,445 million pounds of bottles were placed on shelves, while 769 million pounds were collected for recycling.
- By 2005, the weight of bottles on shelves had increased to 5,075 million pounds, with 1,170 million pounds collected for recycling.
- This upward trend continued over the following years. In 2006, the weight of bottles on shelves reached 5,424 million pounds, with 1,272 million pounds collected for recycling.
- By 2007, these figures had risen to 5,683 million pounds and 1,396 million pounds, respectively.
- In 2010, the weight of bottles on shelves was 5,350 million pounds, with 1,557 million pounds collected for recycling, indicating a steady increase in both production and recycling efforts.
- By 2012, 5,586 million pounds of bottles were on shelves, and 1,718 million pounds were collected for recycling.
- The highest recorded weight of bottles on shelves during this period was in 2016, with 6,172 million pounds, while 1,753 million pounds were collected for recycling.
- However, in 2017, there was a slight decrease in both figures, with 5,913 million pounds of bottles on shelves and 1,726 million pounds collected for recycling.
- Overall, the data shows a clear growth in both the production of bottles and the efforts to recycle them over these 17 years.
(Source: Statista)
Demographic Factors Influencing Reusable Water Bottles Purchases for Environmental Reasons Statistics
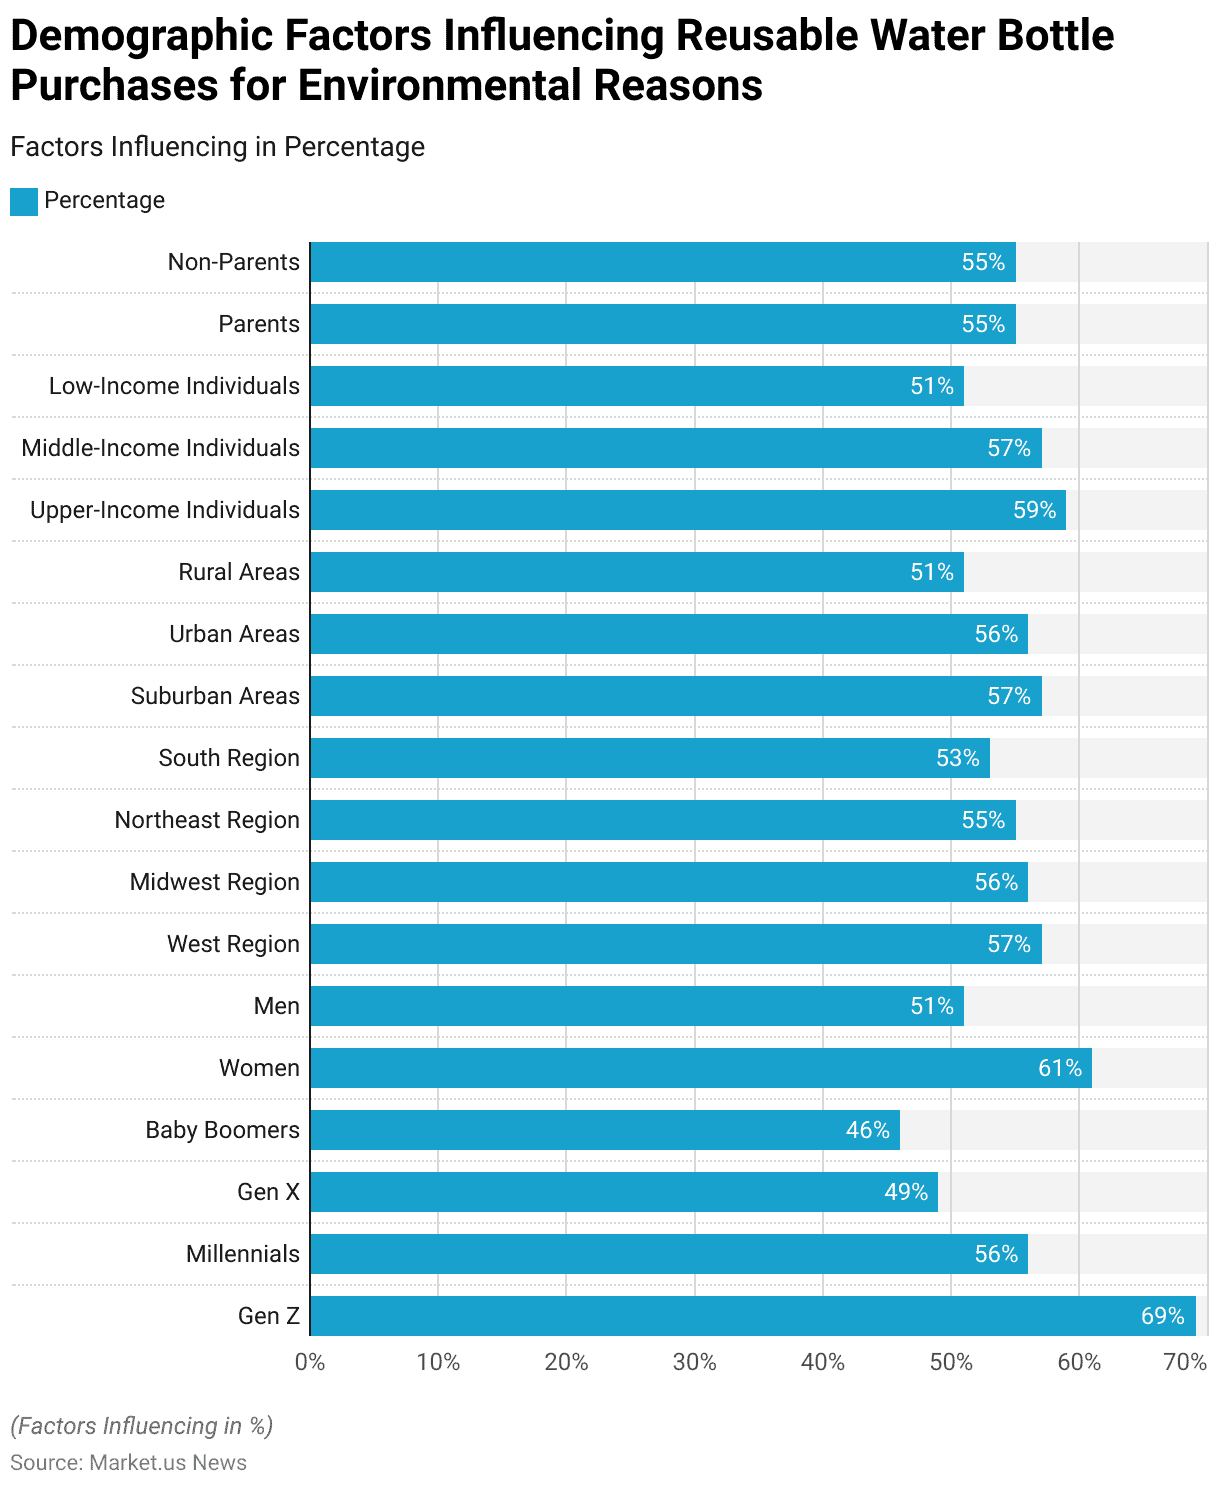
- In the past year, 69% of Gen Z individuals purchased a reusable water bottle due to its environmental sustainability, a significantly higher rate compared to other age groups.
- Millennials followed with 56%, Gen X with 49%, and Baby Boomers with 46%. Despite Gen Z’s higher inclination towards buying reusable water bottles, they also exhibit a considerable trust in and usage of bottled water, which is detrimental to the environment.
- This trend aligns with research indicating that Gen Z is particularly motivated to adopt more sustainable lifestyles.
- Regarding gender, 61% of women purchased a reusable water bottle for environmental reasons in the past year, whereas 51% of men did so.
- From a regional perspective, no specific region exhibited an unusually high or low rate of purchasing reusable water bottles for environmental reasons. The West had the highest rate at 57%, followed by the Midwest at 56%, the Northeast at 55%, and the South at 53%.
- This suggests that geographical location has minimal impact on the decision to purchase reusable water bottles for environmental purposes compared to other demographic factors.
- Geography also had a minimal effect on purchasing behavior within different areas. Individuals living in suburban areas were the most likely to purchase a reusable water bottle for environmental reasons at 57%, followed by urban residents at 56% and rural residents at 51%.
- Income level had a positive correlation with the likelihood of purchasing a reusable water bottle for environmental sustainability.
- Among upper-income individuals, 59% made such a purchase, compared to 57% of middle-income individuals and 51% of low-income individuals.
- Lastly, the likelihood of purchasing a reusable water bottle for environmental reasons was similar between parents and non-parents, with both groups at 55%.
(Source: Trellis)
Impact of COVID-19
Reasons for Increased Bottled Water Purchases During the COVID-19 Pandemic
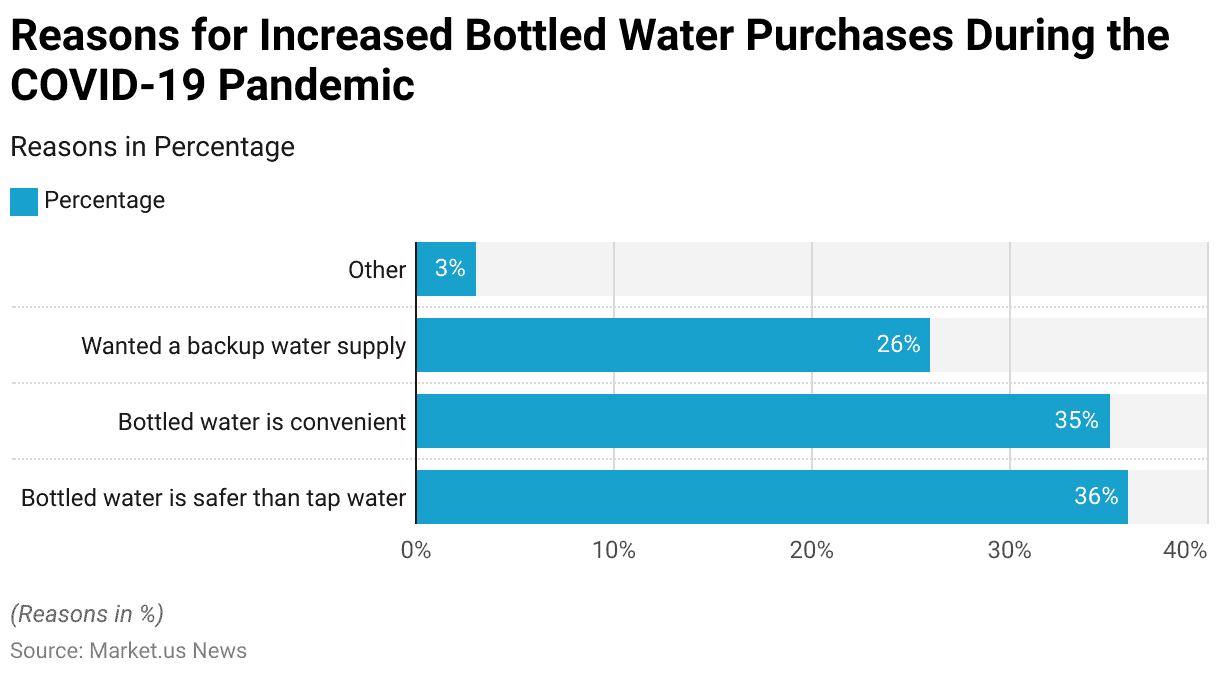
- During the COVID-19 pandemic, consumers increased their purchases of bottled water for several reasons.
- A significant portion, 36%, believed that bottled water was safer than tap water, driving their decision to buy more.
- Convenience was another major factor, with 35% of consumers citing it as the reason for their increased bottled water purchases.
- Additionally, 26% of respondents wanted to ensure they had a backup water supply during the uncertain times of the pandemic.
- A small percentage, 3%, indicated other reasons for their increased purchases of bottled water.
- These factors collectively highlight the heightened demand for bottled water as a response to concerns about safety, convenience, and preparedness during the pandemic.
(Source: Aquasana)
Reasons for Decreased Bottled Water Purchases During the COVID-19 Pandemic
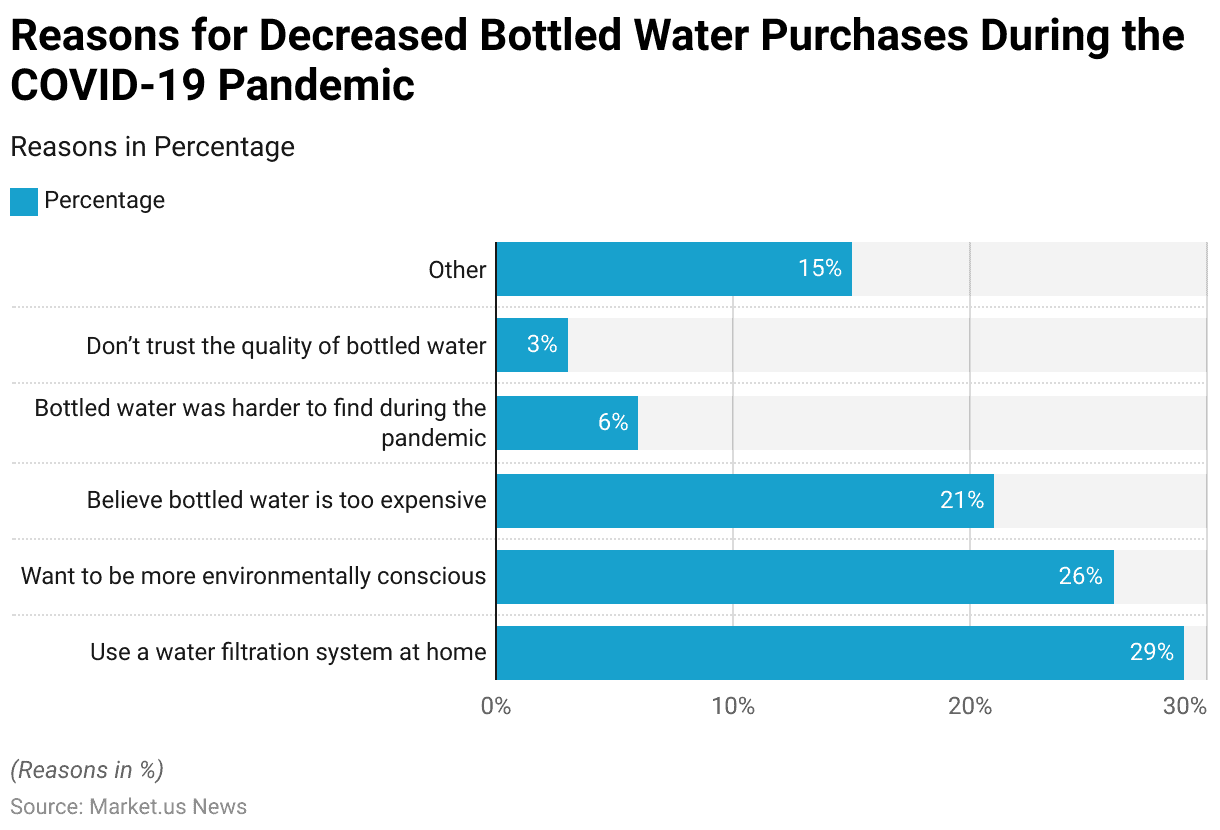
- During the COVID-19 pandemic, some consumers reduced their bottled water purchases for various reasons.
- The most common reason was cited by 29% of respondents. The use of a water filtration system for homemade bottled water is unnecessary.
- Additionally, 26% of consumers decreased their purchases to be more environmentally conscious.
- Financial considerations also played a role, with 21% of respondents believing that bottled water was too expensive.
- A smaller percentage, 6%, found that bottled water was harder to find during the pandemic. Which contributed to their reduced consumption.
- Only 3% of respondents cited a lack of trust in the quality of bottled water as a reason for their decreased purchases.
- Meanwhile, 15% of respondents mentioned other reasons for reducing their bottled water consumption during this period.
- These factors reflect a shift in consumer behavior driven by a combination of environmental concerns, cost, and alternative water sources.
(Source: Aquasana)
Consumer Preferences and Trends
Recycling Rate of Single-Use Plastic Bottles
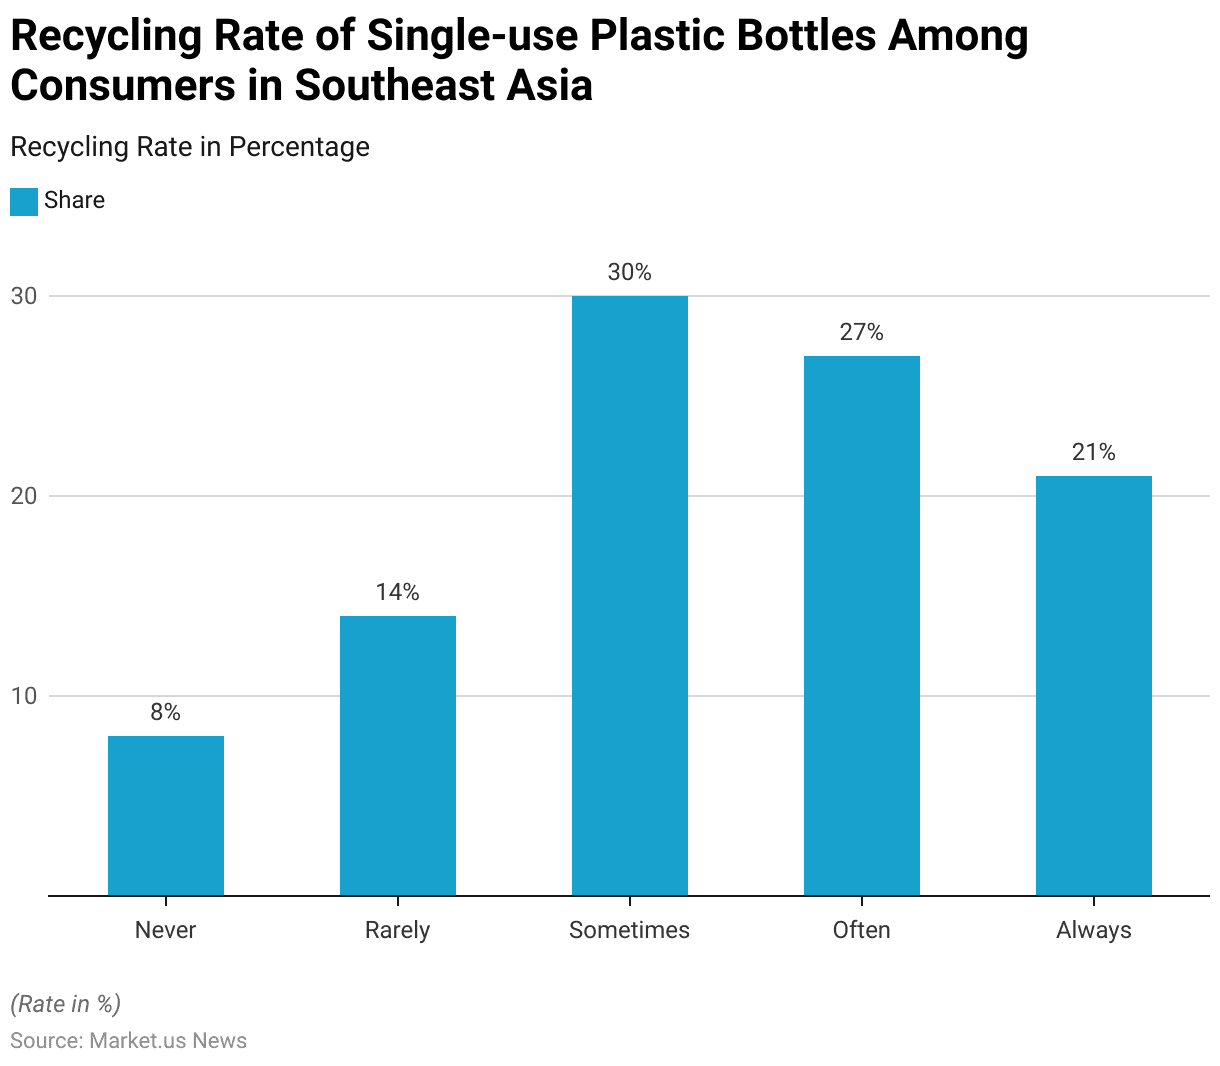
- In 2023, the recycling habits of consumers in Southeast Asia regarding single-use plastic bottles varied significantly.
- A minority of respondents, 8%, reported that they never recycle these bottles, while 14% indicated that they rarely do so.
- The largest group, comprising 30% of respondents, stated that they sometimes recycle single-use plastic bottles.
- Those who often recycle made up 27% of the population, and 21% of respondents reported that they always recycle these bottles.
- This data suggests that a significant portion of the population is engaged in recycling practices. There is still room for improvement, particularly in encouraging more consistent recycling behaviors.
(Source: Statista)
Consumer Preferences in Purchasing Upcycled Products
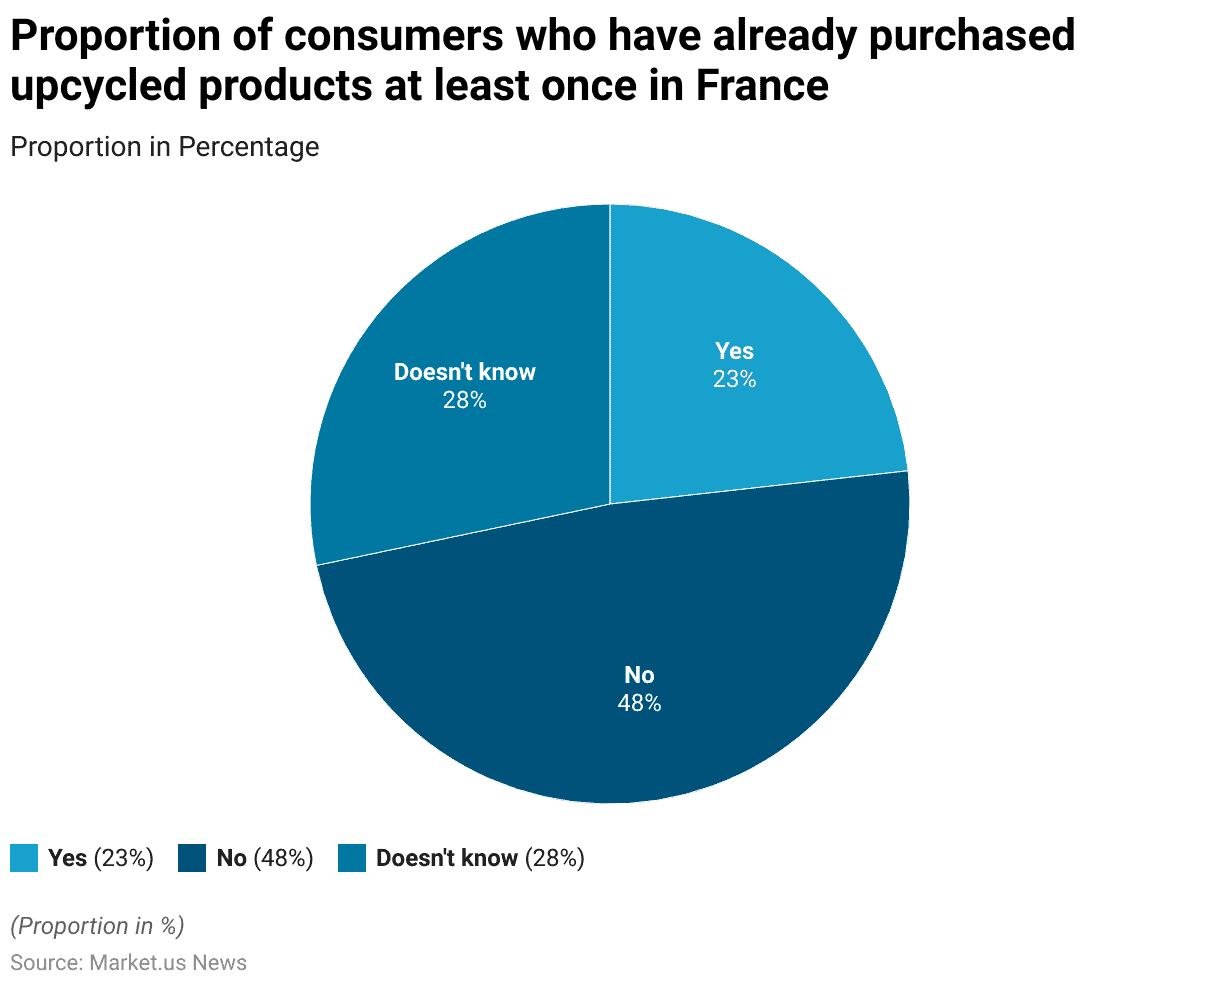
- In 2020, the awareness and adoption of upcycled products among consumers in France were relatively low.
- Only 23% of respondents reported having purchased upcycled products at least once.
- In contrast, nearly half of the respondents (48%) indicated that they had not purchased such products.
- Additionally, 28% of respondents were uncertain or did not know whether they had ever bought upcycled products.
- This data highlights the need for greater awareness and education about upcycled products to increase consumer engagement and adoption in the French market.
(Source: Statista)
Level of Comfort Asking for Water or Top Up for Reusable Water
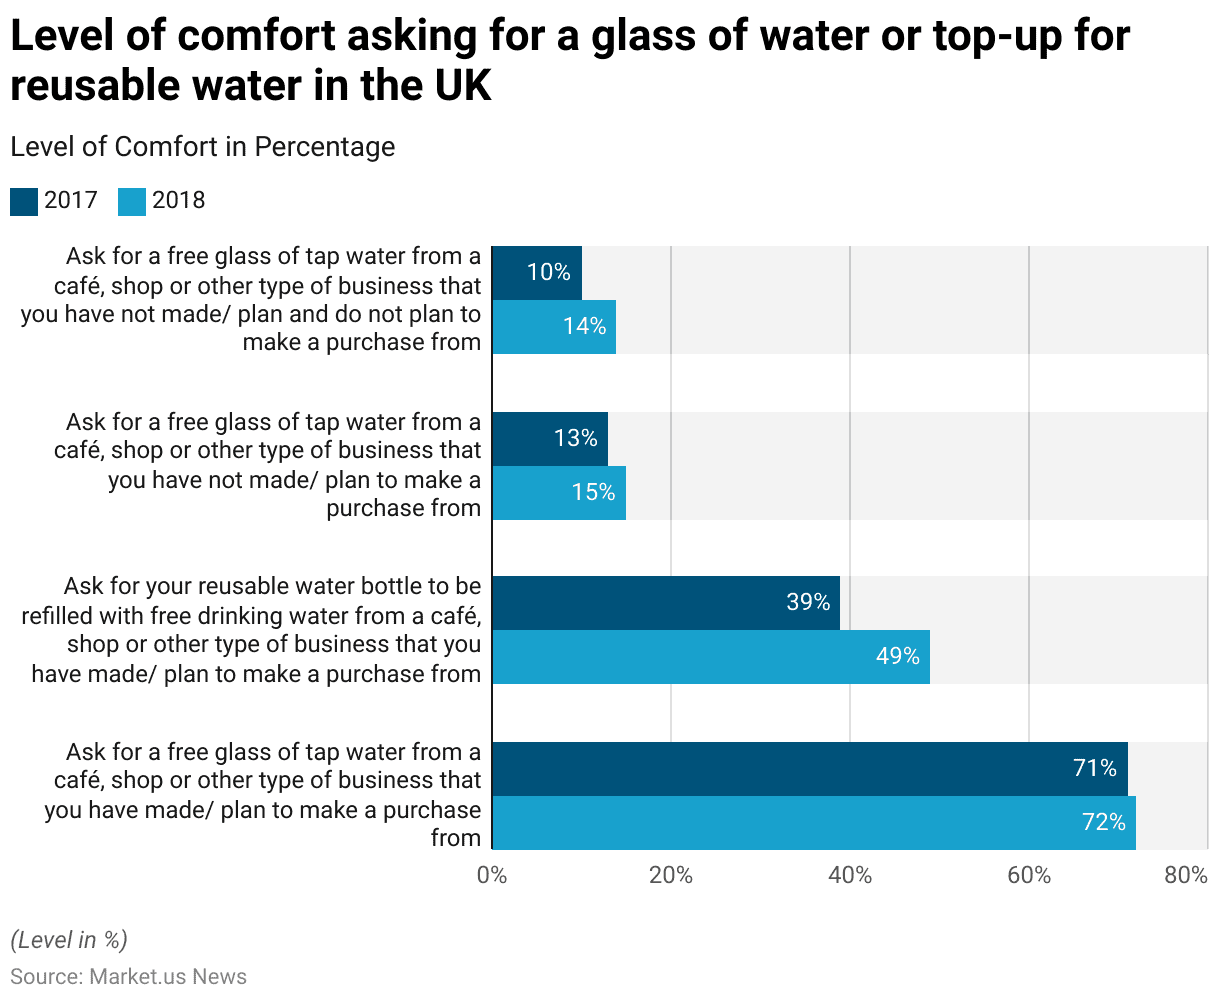
- In the United Kingdom, the level of comfort in asking for water from businesses increased slightly between 2017 and 2018.
- In 2017, 71% of respondents felt comfortable asking for a free glass of tap water from a café, shop, or other business where they had made or planned to make a purchase.
- This figure rose marginally to 72% in 2018.
- The comfort level in asking for a reusable water bottle to be refilled at such establishments saw a more significant increase, from 39% in 2017 to 49% in 2018.
- When it came to asking for a free glass of tap water from a business where the respondent had not made and did not plan to make a purchase. The comfort level was considerably lower but still showed a slight increase.
- In 2017, 13% of respondents felt comfortable doing so, compared to 15% in 2018.
- Finally, asking for a free glass of tap water from a business where the respondent had neither made nor planned to make a purchase was the least comfortable scenario. With only 10% feeling comfortable in 2017, rising to 14% in 2018.
- These trends suggest a growing, albeit cautious, willingness among the UK public to request free water from businesses, particularly when they are customers.
(Source: Statista)
Key Goals and Targets
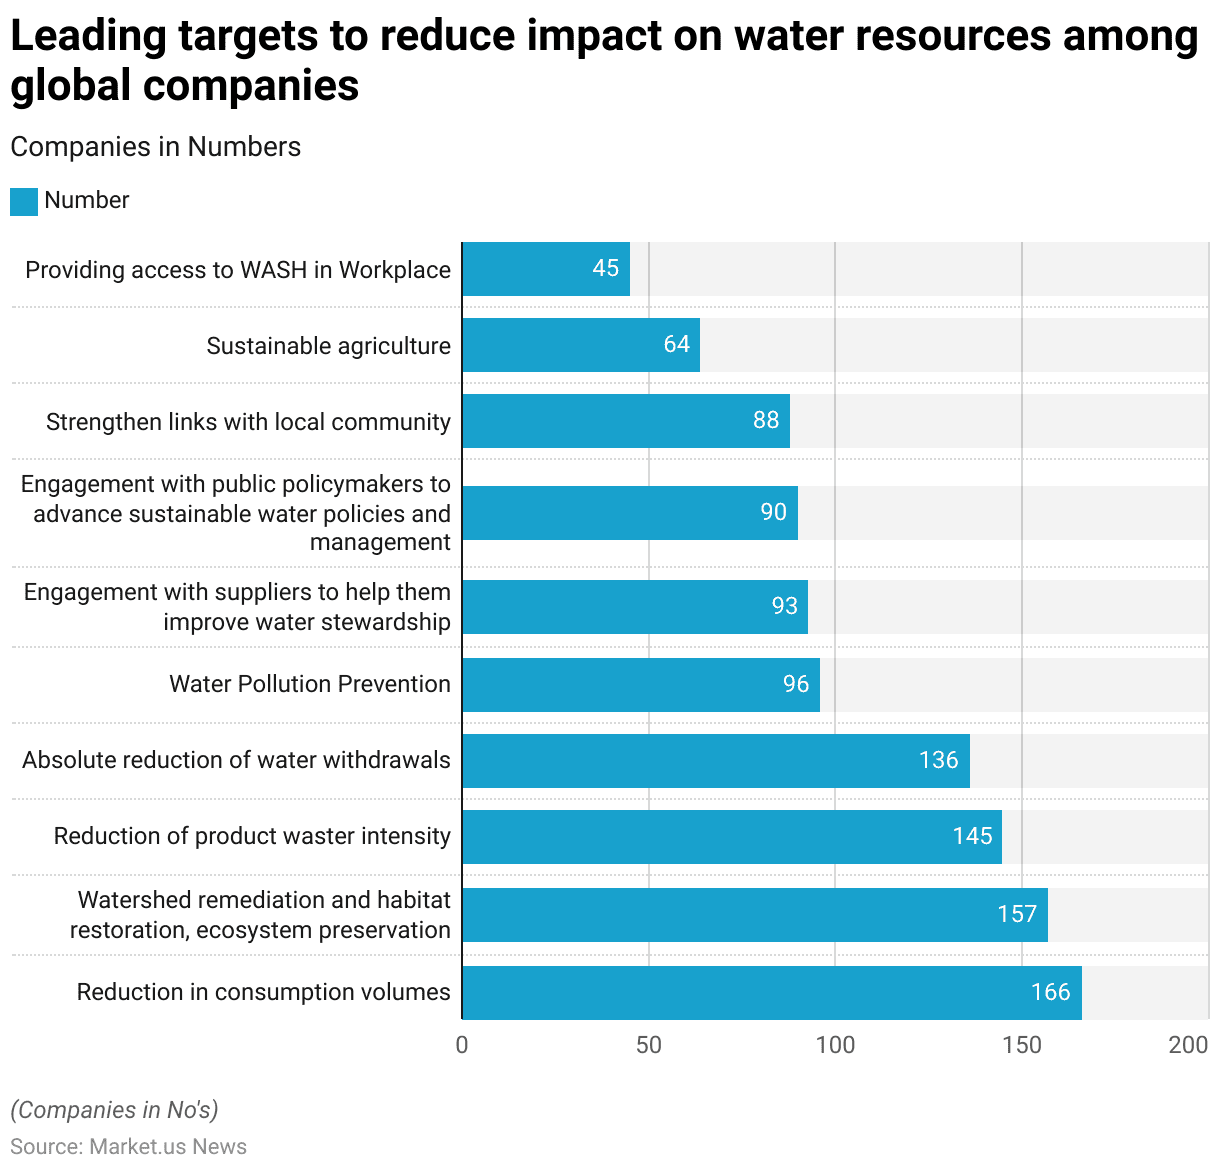
- As of 2017, global companies were actively setting targets and goals to reduce their impact on water resources, with a focus on various strategies.
- The most common target among these companies was the reduction in consumption volumes, with 166 companies prioritizing this goal.
- Following closely, 157 companies were involved in watershed remediation, habitat restoration, and ecosystem preservation efforts.
- Additionally, 145 companies focused on reducing the water intensity of their products, while 136 companies set absolute reduction targets for water withdrawals. Water pollution prevention was also a significant concern, with 96 companies working towards this goal.
- Engagement with external stakeholders was another key focus area. Specifically, 93 companies engaged with their suppliers to improve water stewardship, and 90 companies worked with public policymakers to advance sustainable water policies and management practices.
- Moreover, 88 companies aimed to strengthen their links with local communities as part of their water management strategies.
- Other efforts included promoting sustainable agriculture, a goal shared by 64 companies, and providing access to Water, Sanitation, and Hygiene (WASH) facilities in the workplace, which 45 companies targeted.
- These initiatives highlight the broad spectrum of approaches being employed by companies worldwide to address water-related challenges.
(Source: Statista)
Regulations, Policies, and Legislations for Reusable Water Bottles Statistics
- The regulations, policies, and legislation concerning reusable water bottles are becoming increasingly stringent across the globe. Driven by environmental concerns and the need to reduce single-use plastics.
- In the European Union, the 2021 Single-Use Plastics Directive has been pivotal, mandating member states to promote reusable alternatives. Particularly through the principle of Extended Producer Responsibility (EPR), where producers are responsible for the costs of waste management.
- Germany, a leader in circular economy practices, has implemented comprehensive packaging laws that enforce high recycling rates, including for reusable bottles.
- In the Americas, Chile’s 2021 plastic regulation mandates that by 2024, 30% of beverage bottles sold must be reusable, showcasing a strong move towards sustainability.
- Similarly, countries like Japan have integrated reuse policies within broader circular economy frameworks. Focusing on reducing waste through product lifecycle management.
- These policies not only foster environmental sustainability but also present significant opportunities. Market growth in the reusable water bottle sector as companies innovate to comply with these evolving regulations.
(Sources: Green Peace, Library of Congress, Reusable Industrial Packaging Association)
Recent Developments
Acquisitions and Mergers:
- Hydro Flask acquires KeepCup: In mid-2023, Hydro Flask, a leading brand in reusable water bottles, acquired KeepCup, a popular maker of reusable coffee cups, for $100 million. This acquisition aims to expand Hydro Flask’s product offerings and strengthen its position in the sustainable beverage container market.
- CamelBak merges with Contigo: In late 2023, CamelBak announced a merger with Contigo, two prominent names in the reusable water bottle industry. Creating a powerhouse in the market with combined revenues of over $500 million annually. The merger is expected to enhance product innovation and expand market reach.
New Product Launches:
- S’well introduces the “Sustain” line: In early 2024, S’well launched a new line of reusable water bottles called “Sustain,” made from 90% recycled stainless steel. This product line focuses on reducing the environmental impact of production while maintaining the brand’s signature stylish design.
- Nalgene’s Eco-Friendly Bottles: Nalgene introduced a new series of eco-friendly bottles in mid-2023, made from 50% post-consumer recycled plastic. These bottles aim to appeal to environmentally conscious consumers who are looking for sustainable alternatives.
Funding:
- Soma secures $25 million: In 2023, Soma, a company known for its glass water bottles and sustainable filtration systems, raised $25 million in a Series B funding round. The funds will be used to expand product lines and enhance marketing efforts, particularly in North America and Europe.
- LARQ raises $50 million: LARQ, a startup famous for its self-cleaning water bottles. Secured $50 million in early 2024 to invest in R&D, develop new products, and expand its global distribution network.
Technological Advancements:
- Self-Cleaning Bottles: The trend of self-cleaning reusable water bottles is gaining momentum, with companies like LARQ leading the way. These bottles use UV-C LED technology to eliminate bacteria and viruses, offering a convenient and hygienic solution for consumers.
- Smart Water Bottles: There is a growing interest in smart water bottles equipped with features like hydration tracking, temperature control, and reminders to drink water. These bottles are increasingly popular among health-conscious consumers and are driving innovation in the market.
Market Dynamics:
- Growth in Reusable Water Bottles Market: This growth is driven by increasing environmental awareness and the shift away from single-use plastics.
- Rising Demand for Sustainable Products: Consumer demand for sustainable and eco-friendly products is a significant driver of the reusable water bottle market. In 2023, around 70% of consumers reported that they prefer purchasing products from brands that prioritize sustainability.
Conclusion
Reusable Water Bottles Statistics – The global market for reusable water bottles is experiencing significant growth. Fueled by increasing consumer awareness of environmental sustainability and health benefits.
Insulated bottles dominate the market, reflecting a strong demand for products that offer both functionality and eco-friendliness.
However, regional differences in consumption and recycling rates indicate that while some markets are advanced, others are still developing.
Despite these challenges, the market is expected to continue expanding. Driven by innovation and the growing emphasis on reducing single-use plastics. Continued efforts in recycling and consumer education will be key to sustaining this growth.
FAQs
Reusable water bottles are commonly made from materials like stainless steel, glass, and BPA-free plastic. Some are also made from silicone or aluminum.
Yes, reusable water bottles made from non-toxic materials like stainless steel, glass, and BPA-free plastic are safe to use. It’s important to clean them regularly to avoid bacteria build-up.
Insulated reusable water bottles are designed to keep drinks hot or cold for several hours. The effectiveness depends on the bottle’s construction, with double-walled stainless steel being particularly effective.
As long as you choose bottles made from safe, non-toxic materials and clean them regularly, there should be no health concerns. Avoid bottles made from materials that may leach chemicals into your drink.
Prices vary depending on the material, brand, and features. Basic models start at around $10, while high-end insulated bottles can cost $30 or more.


