
Table of Contents
- Introduction
- Editor’s Choice
- Used Car Market Statistics
- Distribution of Used Car Market by Sector Statistics
- Used Car Sales Statistics
- Trends in Average Asking Price and Transaction Price of Used Car Statistics
- Demographics of Used Car Owners Statistics
- Consumer Preferences for Used Car Statistics
- Recent Developments
- Conclusion
- FAQs
Introduction
Used Car Statistics: The used car market, influenced by economic conditions, technological advancements, and shifting consumer preferences, is witnessing significant growth globally.
Factors such as economic fluctuations and advancements in automotive technologies drive consumer purchasing behavior. With online marketplaces and certified pre-owned programs gaining traction.
Moreover, the rise of electric and hybrid vehicles, along with regulatory changes, presents both challenges and opportunities for industry stakeholders.
Despite supply chain disruptions and the emergence of mobility-as-a-service platforms, the used car market remains dynamic. Offering cost-effective alternatives and meeting the diverse transportation needs of consumers worldwide.
Editor’s Choice
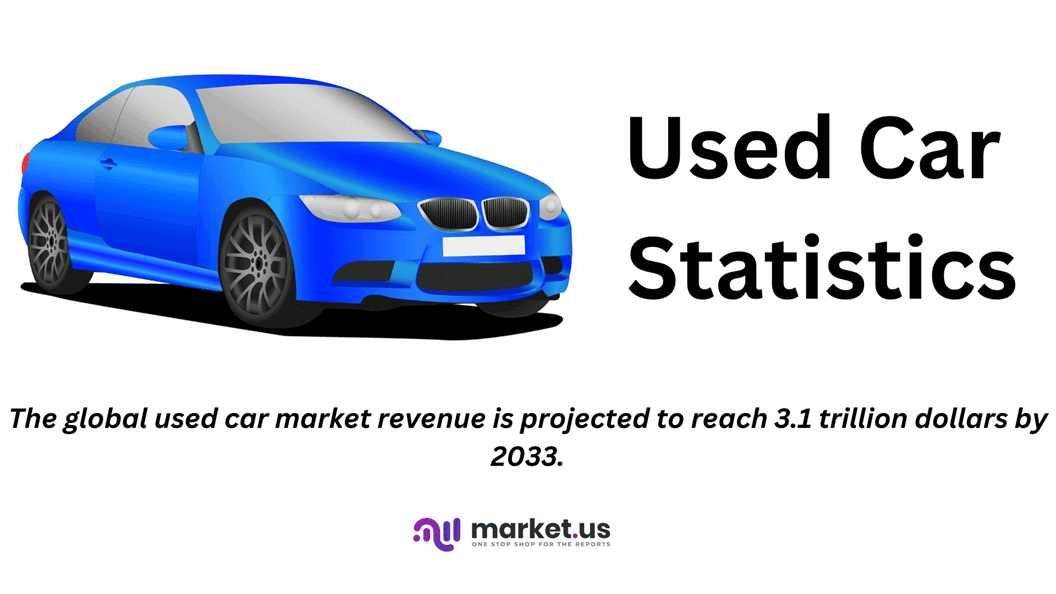
- The global used car market revenue is projected to reach 3.1 trillion dollars by 2033.
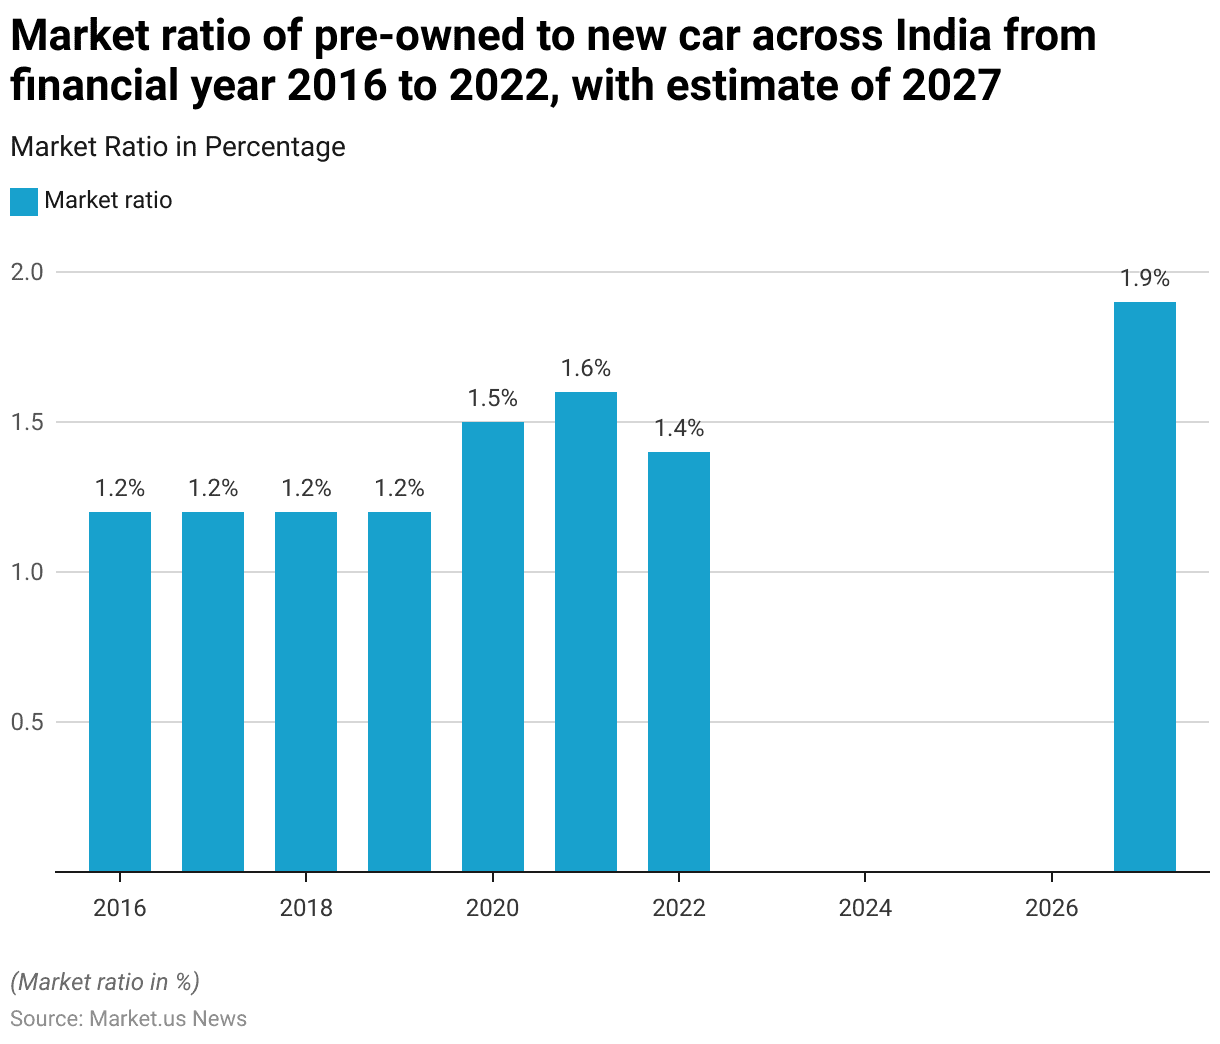
- It is projected that by 2027, the market ratio of pre-owned to new cars will rise to 1.9 in India.
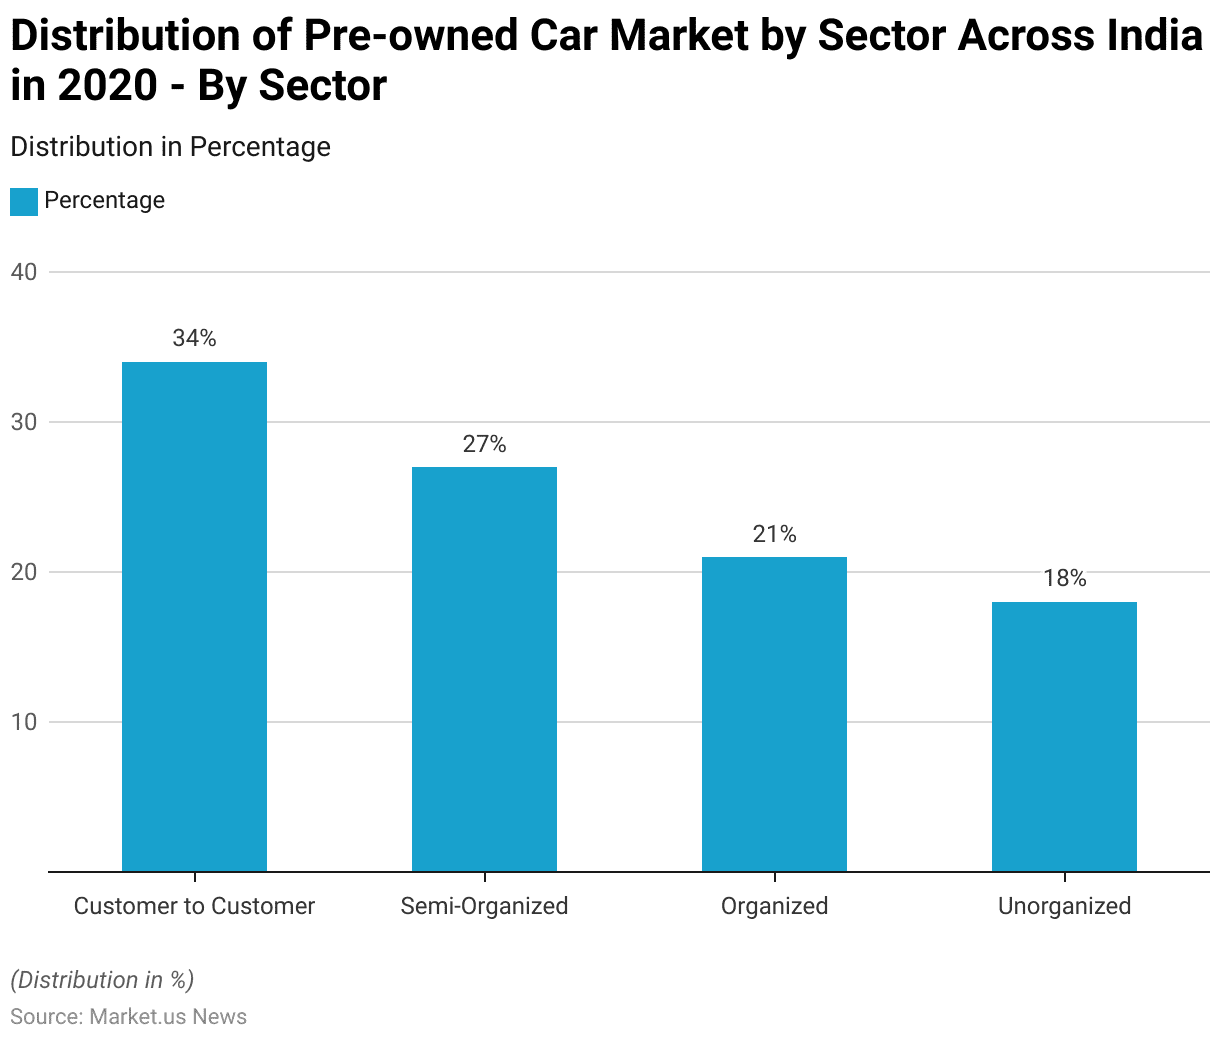
- In 2020, the distribution of the pre-owned car market across various sectors in India exhibited a diverse landscape. Customer-to-customer transactions accounted for the largest share at 34%. Indicating a significant portion of sales occurs directly between individual consumers.
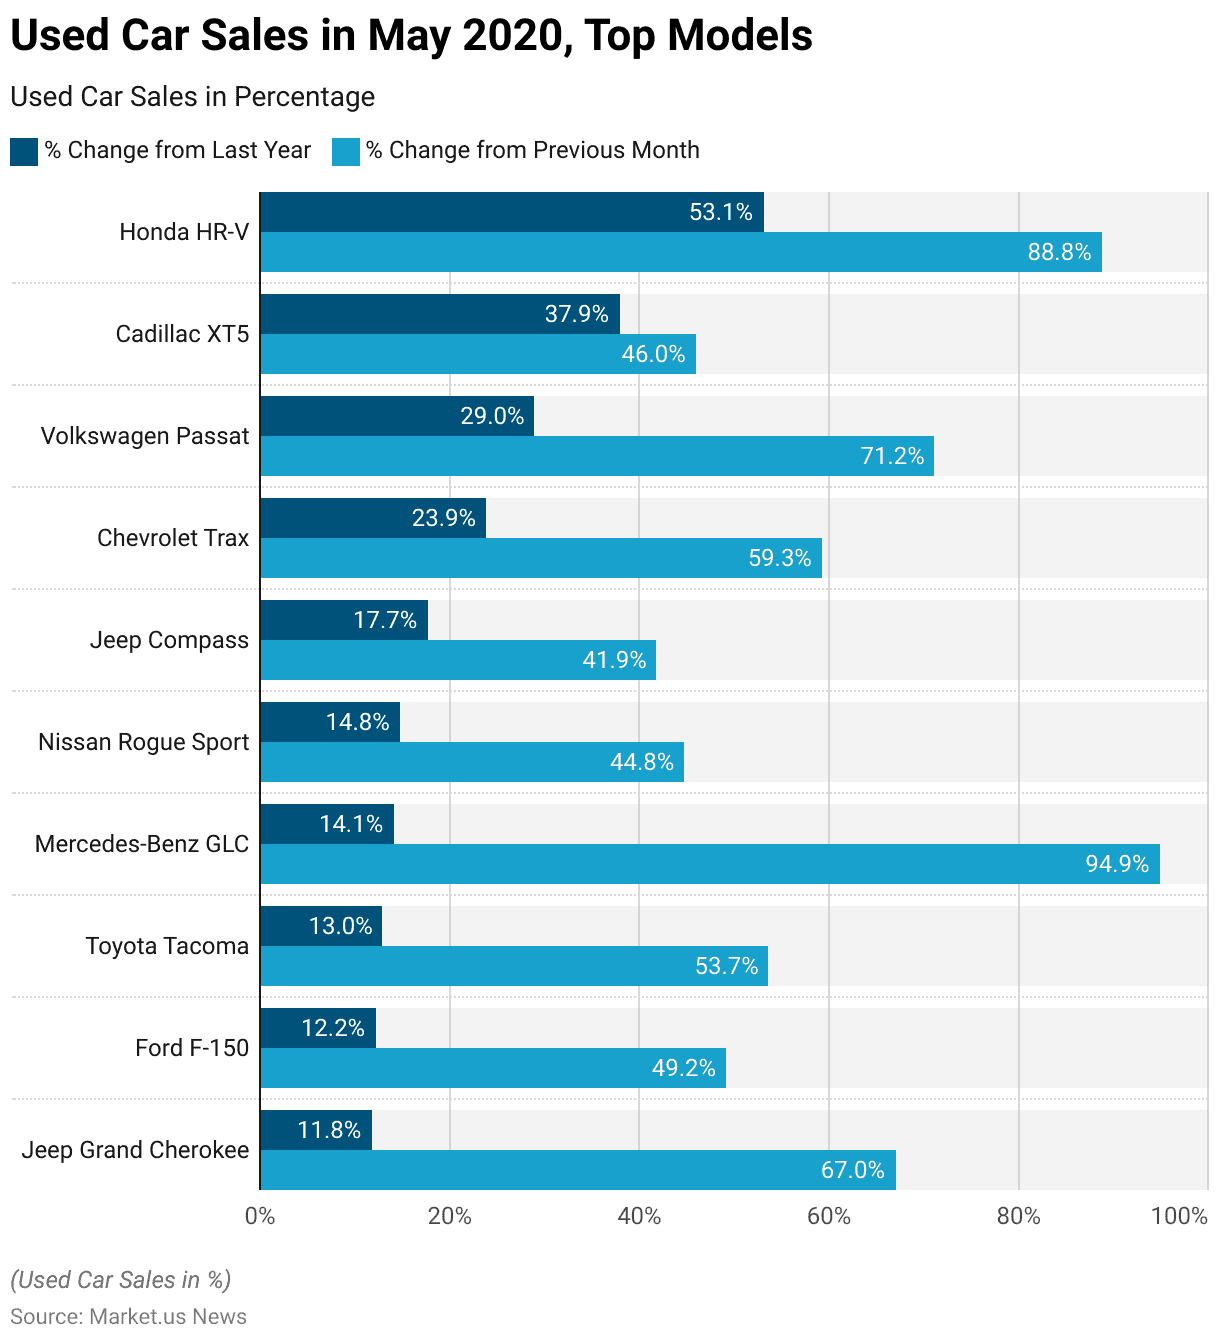
- In May 2020, the sales performance of used cars in the U.S. showed significant variations among the top models in the market. The Honda HR-V led the rankings with a remarkable year-over-year increase of 53.10% and an 88.80% rise from the previous month.
- In May 2020, the used car market in the U.S. displayed a diverse range of trends across different price points when compared to the previous year and the preceding month. Cars priced at $5,000 saw a positive trend. With a 7.10% increase year-over-year and a 43.70% rise from the previous month.
- The survey reveals that Great Britain leads among the countries studied. Approximately four-fifths of its population expressed openness to purchasing pre-owned cars, totaling 81%.
- In the United States, older consumers show a higher inclination toward buying second-hand vehicles. With 82% of individuals over 55 expressing openness to this option, compared to 56% of 18-24-year-olds.
Used Car Market Statistics
Global Used Car Market Size Statistics
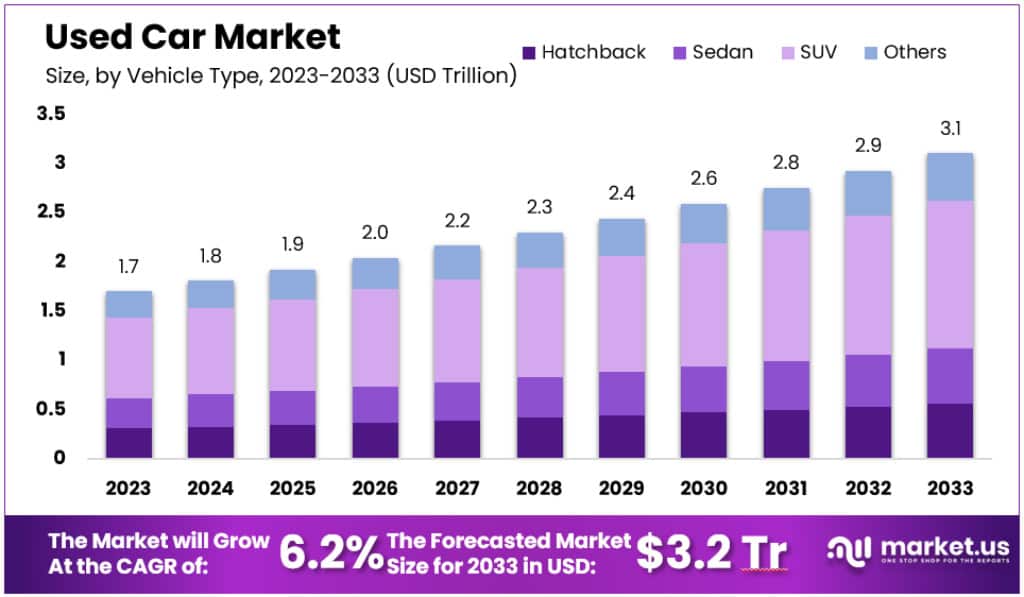
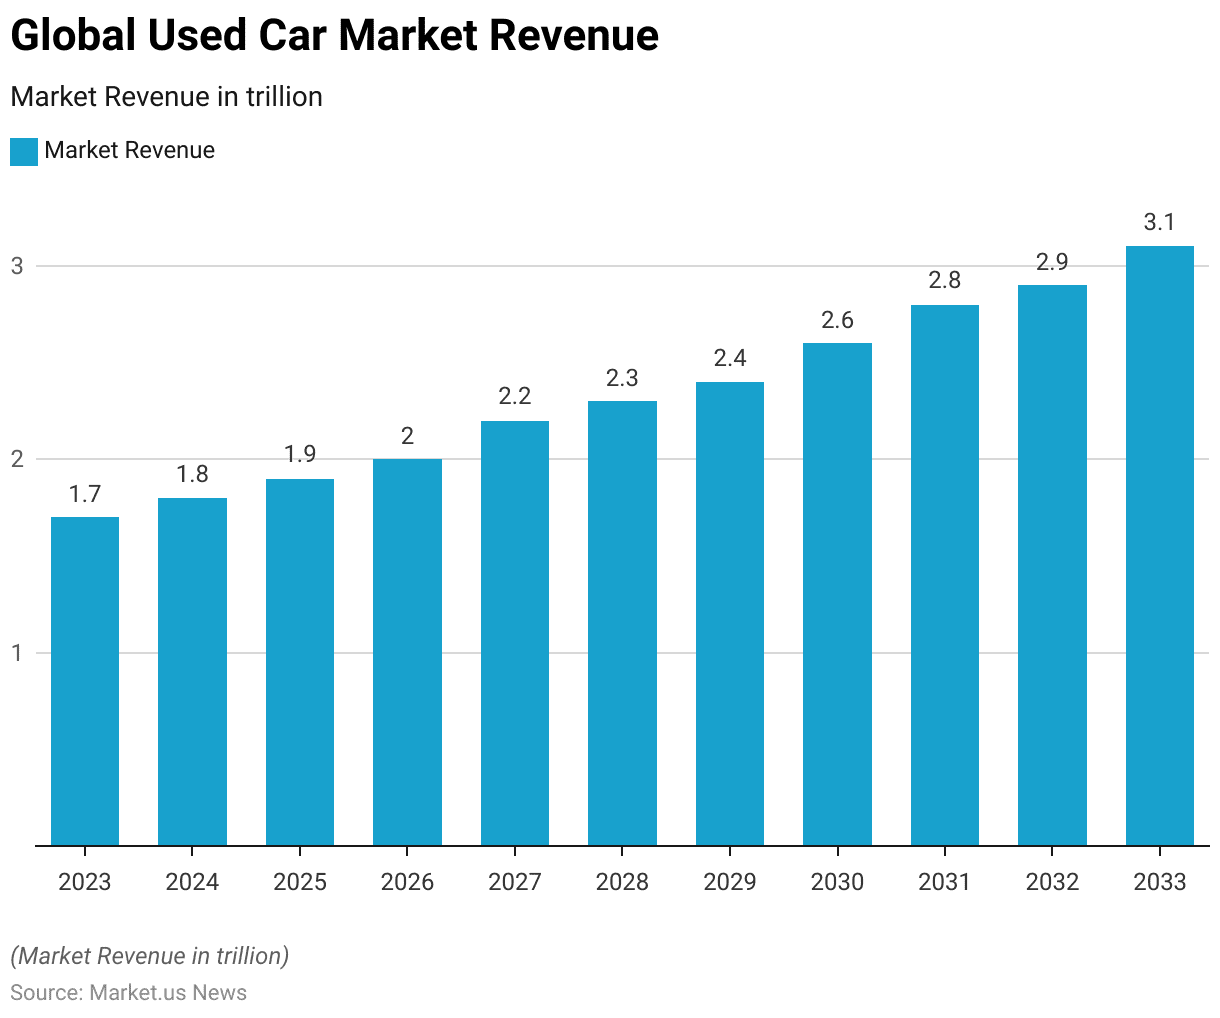
- The global used car market is projected to experience steady growth in revenue over the next decade at a CAGR of 6.2%.
- In 2023, the market revenue stands at 1.7 trillion dollars. It is anticipated to increase to 1.8 trillion dollars in 2024 and further to 1.9 trillion dollars in 2025.
- The upward trend continues, with the revenue reaching 2.0 trillion dollars in 2026 and 2.2 trillion dollars by 2027.
- By 2028, the market is expected to generate 2.3 trillion dollars, followed by 2.4 trillion dollars in 2029.
- The growth trajectory is set to steepen as the revenue is forecasted to hit 2.6 trillion dollars in 2030, 2.8 trillion dollars in 2031, 2.9 trillion dollars in 2032, and finally 3.1 trillion dollars by 2033.
- This data underscores a robust expansion in the global used car market over the coming years.
(Source: market.us)
Market Ratio of Pre-owned to New Car
- From the financial year 2016 to 2022, the market ratio of pre-owned to new cars in India exhibited a notable trend.
- Between 2016 and 2019, the ratio remained stable at 1.2. Indicating that for every new car sold, approximately 1.2 used cars were sold. This pattern of stability suggests a consistent consumer preference for pre-owned vehicles during these years.
- However, a significant change occurred in 2020, when the ratio increased to 1.5, reflecting a greater shift towards used cars.
- This trend further intensified in 2021, with the ratio reaching 1.6, possibly influenced by economic factors such as affordability and the value proposition that pre-owned vehicles offer.
- In 2022, the ratio slightly decreased to 1.4, yet it remained higher than the levels observed between 2016 and 2019.
- Looking ahead, it is projected that by 2027, the market ratio of pre-owned to new cars will rise to 1.9. This anticipated increase suggests a growing preference for used cars, potentially driven by evolving consumer behavior and economic considerations.
- Such a trend highlights the increasing significance of the pre-owned car market in India’s automotive sector.
(Source: Statista)
Distribution of Used Car Market by Sector Statistics
- In 2020, the distribution of the pre-owned car market across various sectors in India exhibited a diverse landscape.
- Customer-to-customer transactions accounted for the largest share at 34%. Indicating a significant portion of sales occurring directly between individual consumers.
- Semi-organized sectors followed closely, representing 27% of the market, suggesting a notable presence of dealerships and small-scale businesses facilitating pre-owned car transactions.
- The organized sector comprised 21% of the market, indicating the involvement of established dealerships and certified pre-owned programs.
- Meanwhile, the unorganized sector accounted for 18% of the market, reflecting a segment characterized by informal sales channels and individual sellers operating outside of established structures.
- This distribution underscores the varied nature of the pre-owned car market in India, with a mix of formal and informal channels catering to diverse consumer preferences and needs.
(Source: Car and Bike Indian Bluebook)
Used Car Sales Statistics
By Model
- In May 2020, the sales performance of used cars in the U.S. showed significant variations among the top models in the market.
- The Honda HR-V led the rankings with a remarkable year-over-year increase of 53.10% and an 88.80% rise from the previous month. Following closely, the Cadillac XT5 secured the second position, exhibiting a 37.90% increase compared to the same period last year and a 46.00% growth from the month before.
- The Volkswagen Passat ranked third, saw a 29.00% increase year-over-year and a substantial 71.20% surge from April 2020. The Chevrolet Trax came in fourth with a 23.90% year-over-year increase and a 59.30% rise from the previous month.
- The Jeep Compass, in the fifth spot, showed a 17.70% growth from last year and a 41.90% increase from the previous month. The Nissan Rogue Sport followed, with a 14.80% increase year-over-year and a 44.80% rise month-over-month.
- The Mercedes-Benz GLC experienced a 14.10% increase from last year and a notable 94.90% jump from April 2020. The Toyota Tacoma and Ford F-150 also showed steady increases, with year-over-year growth of 13.00% and 12.20%, respectively, accompanied by month-over-month rises of 53.70% and 49.20%.
- Lastly, the Jeep Grand Cherokee rounded out the top ten, posting an 11.80% increase compared to the previous year and a significant 67.00% rise from the previous month. These figures highlight the dynamic nature of the used car market during this period.
(Source: iSeeCars Study)
By Bodystyle
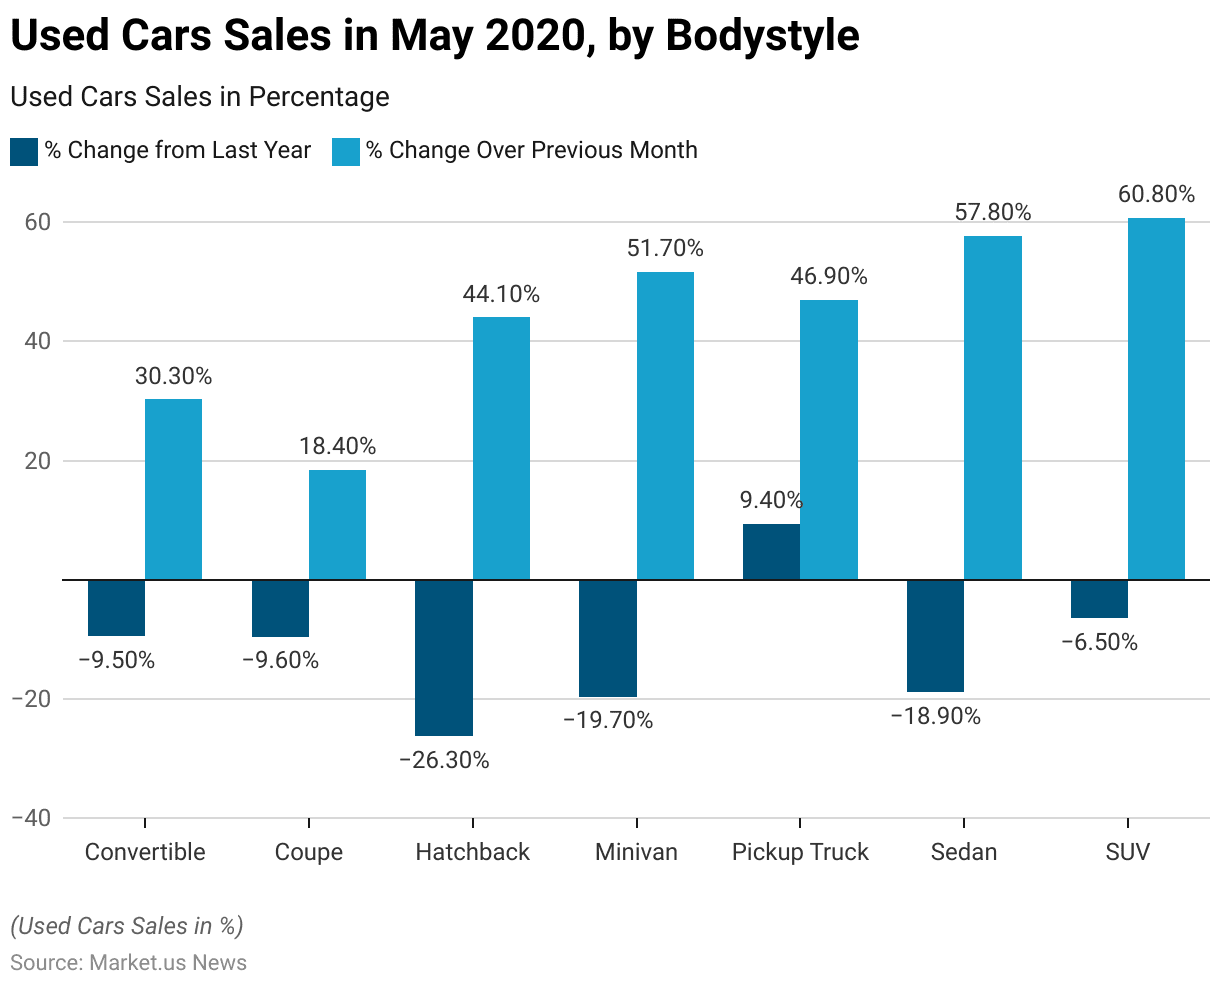
- In May 2020, in the U.S., the used car sales data by body style revealed diverse trends in performance compared to the previous year and the preceding month.
- Convertibles saw a decline of 9.50% from the previous year but experienced a rebound of 30.30% over the prior month.
- Similarly, coupes also faced a year-over-year decrease of 9.60%, though they showed a modest recovery with an 18.40% increase from April 2020.
- Hatchbacks reported a significant drop of 26.30% year-over-year, yet they managed a notable rise of 44.10% from the previous month.
- Minivans saw a decrease of 19.70% compared to last year but increased by 51.70% over the previous month. In contrast, pickup trucks displayed a positive trend with a 9.40% increase year-over-year and a 46.90% rise month-over-month.
- Sedans continued the pattern of declines with a decrease of 18.90% year-over-year but surged by 57.80% from April 2020.
- SUVs showed a smaller decline of 6.50% year-over-year but exhibited a strong recovery with a 60.80% increase over the previous month. These fluctuations underscore the varying dynamics within different segments of the used car market during May 2020.
(Source: iSeeCars Study)
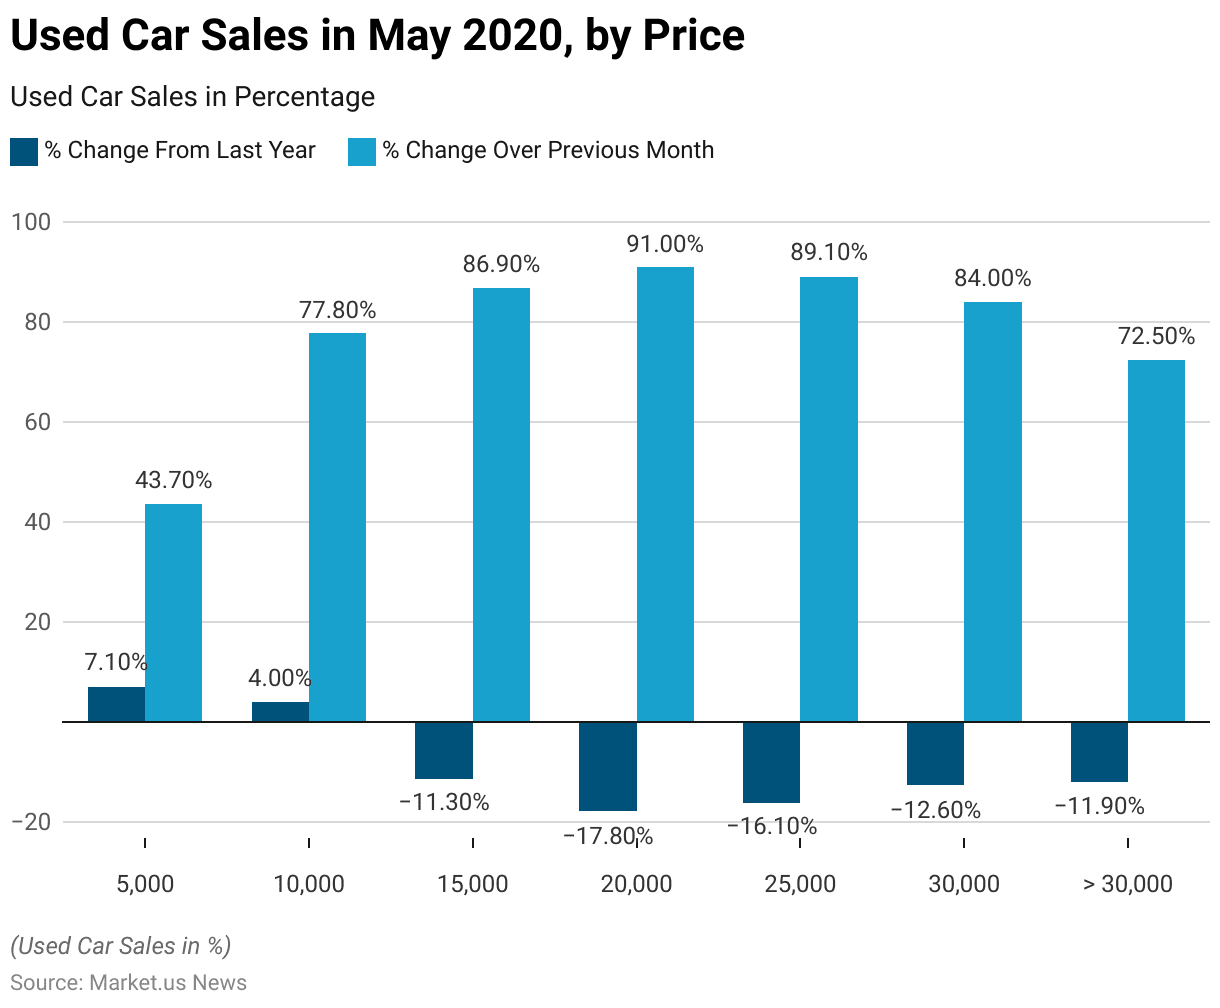
By Price Point
- In May 2020, the used car market in the U.S. displayed a diverse range of trends across different price points when compared to the previous year and the preceding month.
- Cars priced at $5,000 saw a positive trend, with a 7.10% increase year-over-year and a 43.70% rise from the previous month. Similarly, vehicles at the $10,000 price point also experienced growth, with a 4.00% increase compared to last year and a significant 77.80% rise over April 2020.
- However, cars in higher price brackets generally saw declines from the previous year but rebounded impressively from the previous month. Vehicles priced at $15,000 declined by 11.30% year-over-year yet surged by 86.90% month-over-month.
- Cars at the $20,000 mark recorded a decrease of 17.80% year-over-year, with a notable recovery of 91.00% from the previous month. Similarly, the $25,000 price point showed a 16.10% decrease from last year but an 89.10% increase from the prior month.
- Vehicles priced at $30,000 experienced a 12.60% year-over-year decline but saw an 84.00% increase over the previous month. Finally, cars priced above $30,000 noted an 11.90% decrease compared to last year, complemented by a 72.50% rise from the previous month.
- This pattern illustrates the nuanced shifts in the used car market, with significant monthly recoveries despite annual declines in the higher price segments.
(Source: iSeeCars Study)
Trends in Average Asking Price and Transaction Price of Used Car Statistics
- The average dealer’s asking price for used cars in Australia surged past the $40,000 mark. Reaching $40,005 in July 2022, according to data released by Cox Automotive Australia’s AutoRadar.
- This marks a substantial 24% increase from the average listing price of $32,073 recorded a year ago and a significant rise from the $26,658 average in July 2020.
- However, despite the higher listing prices, the average delisting (indicative sale) price in July was slightly lower at $35,529 compared to June’s $36,135.
- This resulted in a record gap between the dealer listing price and the indicative transaction price, standing at $4,476. Surpassing the previous high of $3,983 in May 2020 during the initial onset of the COVID-19 pandemic.
- In terms of volume, newly-added used vehicles in July 2022 totaled 44,127 units, a 4.8% decrease from June 2022. Compared to July 2021, the number of added used vehicles decreased by 4.6%.
- Meanwhile, active used vehicles listed for sale totaled 81,101 units in July 2022. Representing a 2.4% increase from the previous month and a 1.7% increase from July last year.
- On the auction side, the Manheim Used Vehicle Value Index for July 2022 stood at 167.4%, almost unchanged from June’s 167.0%.
- While slightly lower than May’s 171%, it remains higher than April’s 167% and significantly below the all-time high of 178% recorded in March. Throughout the year, the index has averaged 170%, notably higher than the 2021 average of 153%.
(Source: GoAutoMedia)
Demographics of Used Car Owners Statistics
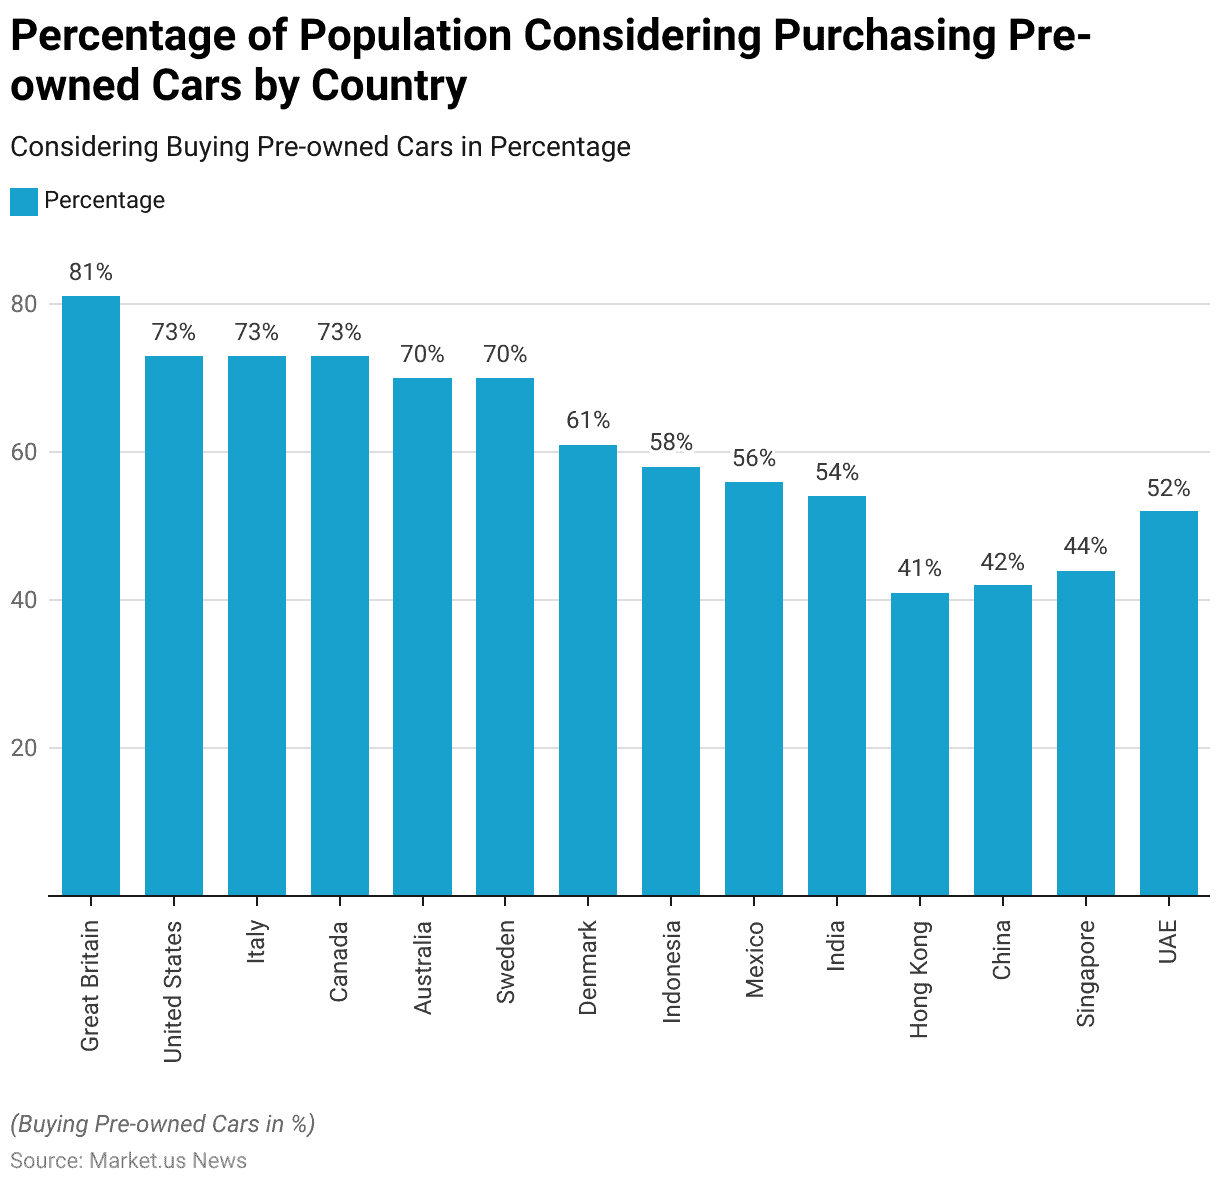
Percentage of Population Considering Purchasing Used Car by Country Statistics
- The survey reveals that Great Britain leads among the countries studied. Approximately four-fifths of its population expressed openness to purchasing pre-owned cars, totaling 81%.
- Following closely, around three-quarters of Americans, Italians, and Canadians, at 73% each. Also, show a willingness to consider buying used cars.
- In other European nations, the trend remains strong, with at least 60% of the population in every country expressing interest in second-hand cars.
- Additionally, about seven in ten Australians share a similar tendency. However, in the Nordic region, Swedes are notably more inclined (70%) compared to their Danish counterparts (61%) to consider purchasing used cars.
- Conversely, developing countries generally exhibit lower percentages of people considering purchasing second-hand cars. Though over half of consumers in Indonesia (58%), Mexico (56%), and India (54%) express interest.
- In contrast, consumers in Hong Kong (41%), China (42%), and Singapore (44%) are the least likely among all markets to consider buying pre-owned cars.
- Notably, the UAE, despite being classified as a developed country, also has a relatively low percentage, with only 52% of people considering purchasing second-hand cars.
(Source: YouGov)
Percentage of Consumers Considering Purchasing Used Cars by Age Group Statistics
- When examining age demographics, the data reveals interesting trends regarding the likelihood of purchasing pre-owned cars.
- In the United States, older consumers show a higher inclination toward buying second-hand vehicles. With 82% of individuals over 55 expressing openness to this option, compared to 56% of 18-24-year-olds.
- Conversely, in Great Britain, it’s the 35-44 age group that demonstrates the highest propensity for purchasing cars second-hand. With a striking 87% expressing interest, while only 62% of 18-24-year-olds share this sentiment.
- The data highlights a generational divide in consumer preferences for pre-owned cars. Older individuals show greater openness to this market segment compared to younger demographics.
(Source: YouGov)
Consumer Preferences for Used Car Statistics
- Despite a notable interest in both new and used cars, the majority of consumers express a preference for purchasing a new car for their next vehicle, with 77% indicating this inclination.
- Moreover, a significant proportion of consumers, also at 77%, are open to switching brands.
- Among those willing to switch brands, technology features are cited as the primary reason by 64% of respondents. Followed by a desire for something new, noted by 50% of consumers.
- The report is based on research conducted by Close Brothers Motor Finance. Indicates that 41% of consumers plan to choose a pre-owned car for their next vehicle acquisition, while 42% intend to purchase a brand-new one.
- Approximately 17% of respondents remain undecided about their next purchase.
- In comparison to data from 2017, there has been a 5% decrease in the proportion of individuals who express an intention to buy a new car.
- There’s a noticeable gender contrast in attitudes toward new and used cars. While half of men (49%) plan to buy a new car for their next vehicle purchase. Only a third (35%) of women share this preference.
- Conversely, almost half (47%) of women aim to purchase a used vehicle. Compared to just over a third (35%) of men.
(Source: Deloitte, Close Brothers Motor Finance)
Recent Developments
Mergers and Acquisitions Trends:
- The automotive M&A activity saw a slowdown in 2023, with deal volumes dropping by about 30% compared to 2022, and the average deal value decreasing by 22%.
- This is reflective of a cautious approach by dealmakers in the face of economic pressures such as inflation and supply chain disruptions.
Popular Market Segments:
- SUVs held the largest market share in the used car segment at 37.6% in 2022, driven by their versatility and consumer demand.
- Mid-sized vehicles are expected to see the fastest growth. Projected at a CAGR of 6.4%, attributed to their balance between space and manageability.
Technological Innovations and Online Trends:
- The introduction of platforms like Topmarq in 2022, which automates bidding and scheduling for sellers, is shifting more of the used car market to online platforms.
- This move is particularly focused on expanding in major metropolitan areas like Texas.
Electric and CNG Vehicles:
- There’s a growing interest in used vehicles powered by alternative fuels like Compressed Natural Gas (CNG). The CNG segment is expected to witness the fastest growth rate at a CAGR of 7.6% over the forecast period.
- This trend is driven by both environmental concerns and cost efficiency.
Key Industry Players:
- Major players in the US used car market include CarMax, CarBravo, and Carvana, among others.
- These companies dominate the market, offering a variety of purchasing options and catering to evolving consumer preferences.
Conclusion
Used Car Statistics: In conclusion, the market for used cars continues to demonstrate resilience and significance across various demographics and regions.
While preferences may vary between new and used vehicles, a substantial portion of consumers globally express openness to purchasing pre-owned cars. Factors such as affordability, value proposition, and technological advancements influence their decisions.
Furthermore, demographic differences, including age and gender, play a role in shaping these preferences. Highlighting the nuanced nature of consumer behavior in the automotive market.
As the automotive industry evolves, understanding these dynamics will be crucial for stakeholders to effectively meet the needs and preferences of consumers in the used car segment.
FAQs
Used cars are typically more affordable and depreciate at a slower rate compared to new cars.
Consider factors such as insurance, maintenance, and fuel costs in addition to the purchase price.
Consider the car’s mileage and age, as lower mileage and newer models may indicate better overall condition.
Consumers usually look for reviews and ratings online to learn about the reliability and performance of different makes and models.
Consumers mostly apply for an auto loan through a bank, credit union, or online lender to finance used car purchases.
Discuss your needs with our analyst
Please share your requirements with more details so our analyst can check if they can solve your problem(s)