

Table of Contents
- Introduction
- Editor’s Choice
- Swimwear Market Statistics
- Sports & Swimwear Market Statistics
- Women Swimwear Market Statistics
- Statistics of Swimwear Sales
- Swimwear Price Statistics
- Men’s Swimwear Preferences and Dynamics Statistics
- Women’s Swimwear Preferences and Dynamics
- Swimwear Preferences and Trends in Different Countries
- Swimwear Export Statistics
- Swimwear Import Statistics
- New Product Arrivals
- Challenges and Concerns
- Recent Developments
- Conclusion
- FAQs
Introduction
Swimwear Statistics: Swimwear encompasses various styles designed for swimming and beachwear. Key types include bikinis, one-piece swimsuits, tankinis, rash guards, swim trunks, and speedos or jammers.
Bikinis are two-piece suits, while one-piece provides full coverage. Tankinis combine a top and bottom for more coverage, and rash guards offer sun protection for water sports.
Swim trunks are popular for men, and speedos or jammers are tight-fitting options for competitive swimmers.
Additionally, cover-ups like sarongs or tunics are worn over swimwear for casual or sunbathing activities. Each style caters to different needs, preferences, and body types.
Editor’s Choice
- By 2033, the global swimwear market is projected to attain a value of USD 45.4 billion.
- In 2022, the global swimwear market was largely driven by the Asia-Pacific (APAC) region, which held the largest market share at 43.0%.
- In 2022, the global sports and swimwear market was highly competitive. Nike leading the market with a 7% share.
- As of 2018, the global market share of women’s swimwear was predominantly driven by bikinis, which held a significant 68% share of the market.
- In 2023, per-capita volume sales in the global sports and swimwear market varied significantly, with Hong Kong leading at 5.91 pieces.
- In 2022, swimwear discounts peaked at 37% in January and February. Remaining consistent through September, November, and December.
- In 2023, the United States led the global imports of men’s or boys’ swimwear. With a trade value of $200.27 million, importing 36.87 million items.

Swimwear Market Statistics
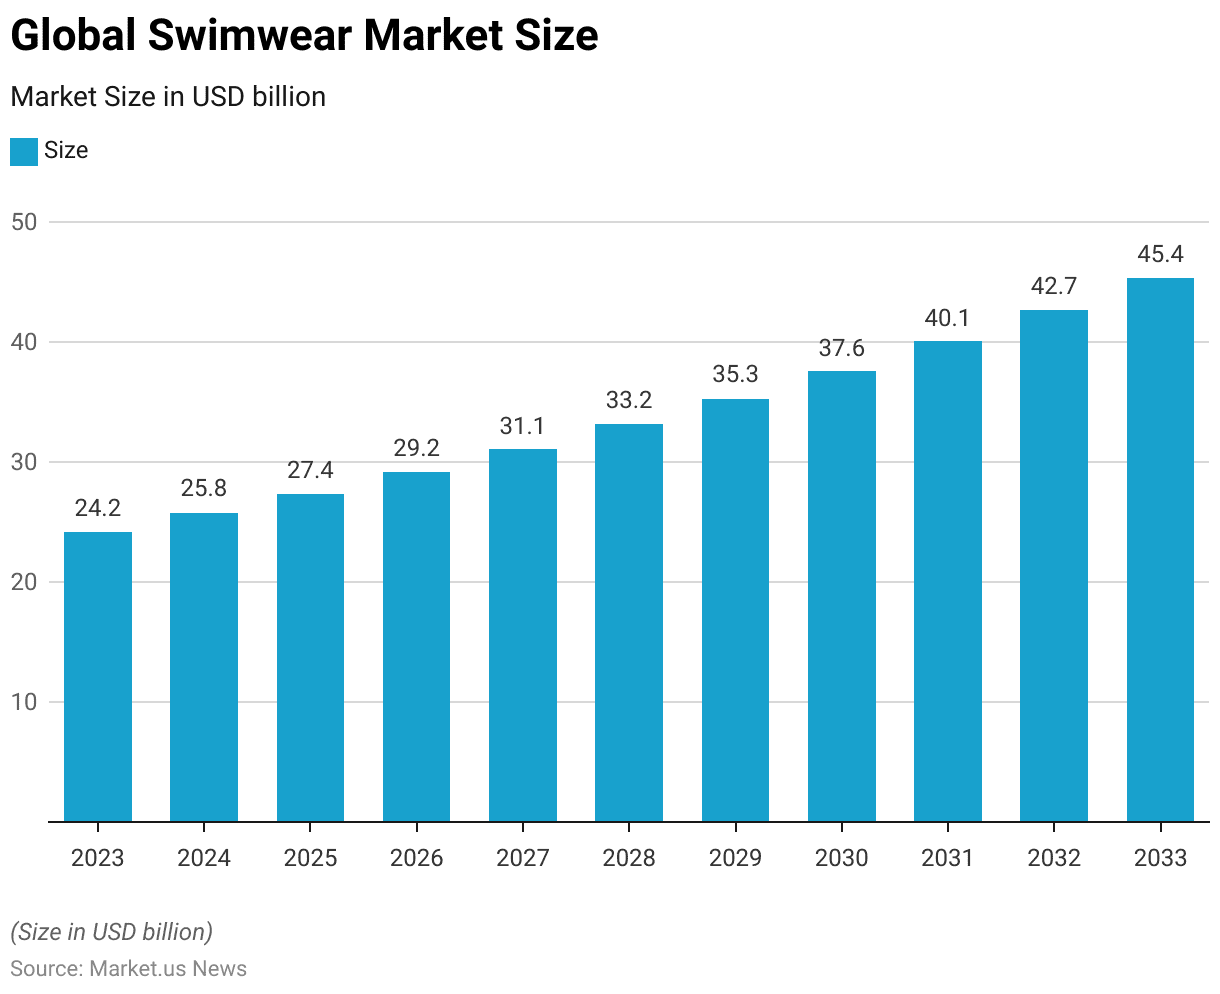
Global Swimwear Market Size Statistics
- The global swimwear market is projected to experience steady growth over the next decade at a CAGR of 6.5%.
- Starting with a market size of USD 24.2 billion in 2023, it is expected to reach USD 25.8 billion in 2024.
- This growth trajectory continues as the market size progresses to USD 27.4 billion in 2025 and USD 29.2 billion in 2026.
- By 2027, the market will expand further to USD 31.1 billion. With a continued upward trend, reaching USD 33.2 billion in 2028.
- The market is forecast to maintain this momentum, increasing to USD 35.3 billion in 2029, USD 37.6 billion in 2030, and USD 40.1 billion in 2031.
- Finally, by 2032, the global swimwear market is projected to attain a value of USD 42.7 billion. With a further rise to USD 45.4 billion in 2033.
(Source: market.us)
Competitive Landscape of Global Swimwear Market Statistics
- In 2022, the competitive landscape of the global swimwear market was dominated by several key players.
- Wacoal Holdings Corporation led the market with a 15% share. Followed by Pentland Group PLC with 12%.
- Nike Inc. and Adidas AG each held a significant share of 11% and 10%, respectively.
- Swimwear Anywhere Inc. (TYR Sports Inc.) and Arena SpA (Berkshire Hathaway) both accounted for 10% of the market.
- Other players, such as La Jolla Group, with a 6% share, and Tennor Holding BV (La Perla), with 8%, also contributed to the market’s composition.
- Additionally, TJ Swim held a 9% market share. While other key players combined for the remaining 10%.
(Source: market.us)
Global Swimwear Market Share – By Region Statistics
- In 2022, the global swimwear market was largely driven by the Asia-Pacific (APAC) region, which held the largest market share at 43.0%.
- North America followed with a 26.5% share. While Europe accounted for 20.0% of the market.
- South America contributed 5.3%, and the Middle East and Africa (MEA) region made up 5.2% of the global market share.
(Source: market.us)
Sports & Swimwear Market Statistics
Global Sports & Swimwear Market Revenue Statistics
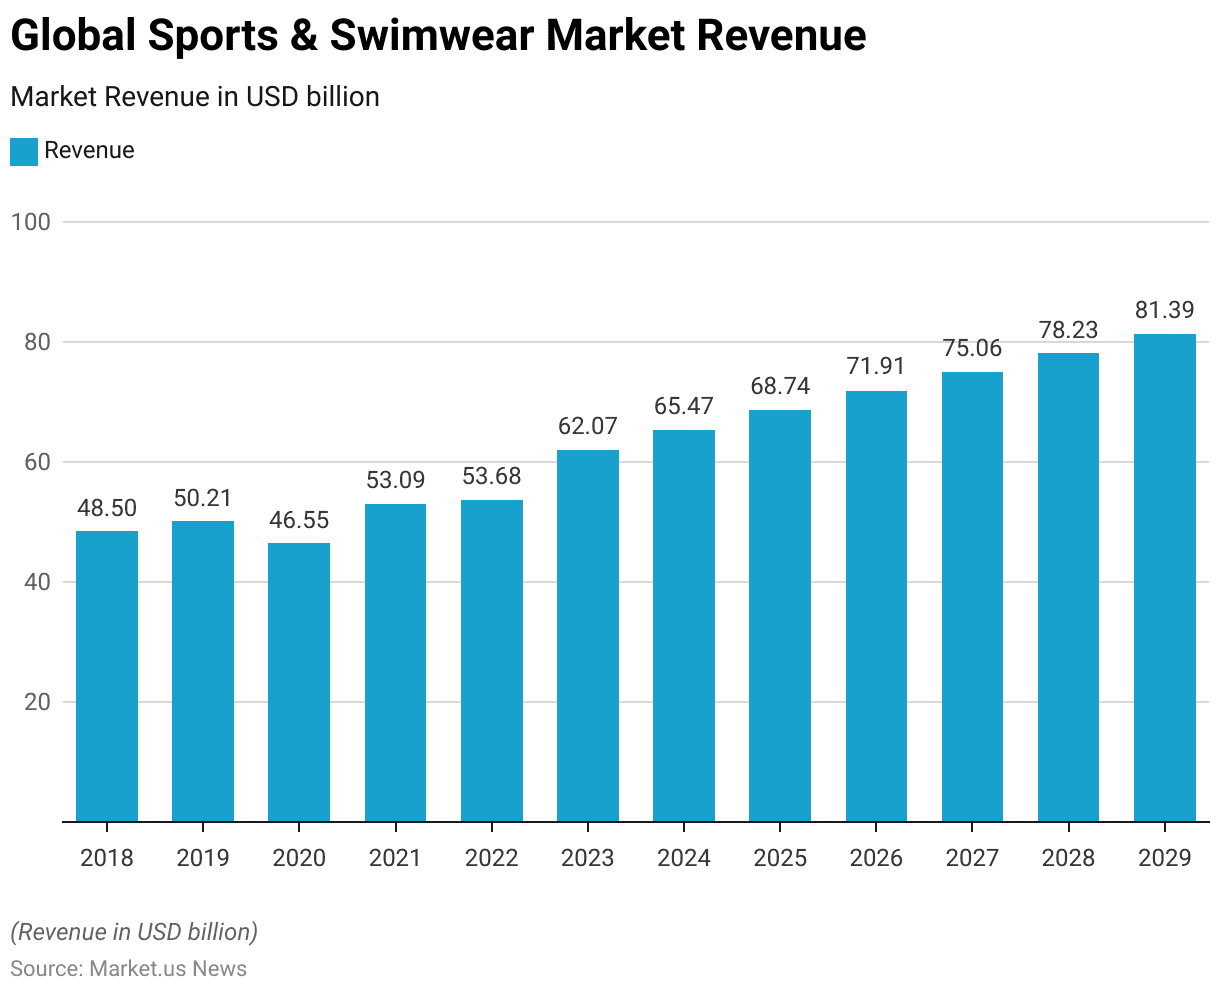
- The Global Sports & Swimwear Market has demonstrated steady growth over the past decade.
- In 2018, the market generated a revenue of USD 48.50 billion, which increased to USD 50.21 billion in 2019.
- Despite a slight decline in 2020, with revenue falling to USD 46.55 billion, the market rebounded in 2021, reaching USD 53.09 billion.
- This upward trend continued into 2022, with revenue increasing to USD 53.68 billion.
- In 2023, the market saw a significant surge. Achieving a revenue of USD 62.07 billion, and is expected to continue its growth, reaching USD 65.47 billion in 2024.
- By 2025, the market is projected to reach USD 68.74 billion, followed by further growth to USD 71.91 billion in 2026.
- In the subsequent years, the market is anticipated to maintain its growth trajectory. Reaching USD 75.06 billion in 2027, USD 78.23 billion in 2028, and USD 81.39 billion by 2029.
- This data indicates a consistent upward trend. Reflecting strong demand and expansion within the sports and swimwear sector.
(Source: Statista)
Global Sports & Swimwear Market Revenue – By Segment Statistics
2018-2022
- The Global Sports & Swimwear Market revenue by segment for men has shown a consistent upward trend across the years.
- In 2018, the revenue from performance apparel, sports-inspired apparel, and swimwear for men was USD 23.18 billion, USD 20.01 billion, and USD 5.31 billion, respectively.
- In 2019, performance apparel and sports-inspired apparel saw slight increases, reaching USD 23.70 billion and USD 21.23 billion, while swimwear for men slightly decreased to USD 5.28 billion.
- The year 2020 experienced a decline in all three segments, with performance apparel at USD 21.79 billion, sports-inspired apparel at USD 20.11 billion, and swimwear at USD 4.65 billion.
- However, 2021 marked a recovery, with performance apparel reaching USD 24.60 billion, sports-inspired apparel USD 23.33 billion, and swimwear USD 5.16 billion.
- By 2022, these segments had continued to grow, with performance apparel and sports-inspired apparel at USD 24.72 billion and USD 23.80 billion, respectively, and swimwear stabilizing at USD 5.16 billion.
2023-2029
- The market saw a significant boost in 2023, with performance apparel reaching USD 28.48 billion, sports-inspired apparel USD 27.71 billion, and swimwear USD 5.88 billion.
- Projections indicate further growth, with performance apparel expected to reach USD 29.88 billion in 2024, sports-inspired apparel USD 29.50 billion, and swimwear USD 6.09 billion.
- By 2025, performance apparel and sports-inspired apparel are expected to grow to USD 31.22 billion and USD 31.24 billion, respectively, while swimwear will increase to USD 6.28 billion.
- This trend will continue through 2029, with performance apparel and sports-inspired apparel reaching USD 36.39 billion and USD 37.94 billion, respectively, and swimwear for men reaching USD 7.06 billion.
- This data highlights the strong growth trajectory across all three segments of the men’s sports and swimwear market.
(Source: Statista)
Sports & Swimwear Market Average Revenue Per Capita – By Segment Statistics
2018-2022
- The average revenue per capita for each segment of the men’s sports and swimwear market has displayed a consistent upward trend from 2018 to 2022.
- In 2018, the average revenue per capita for performance apparel, sports-inspired apparel, and swimwear stood at USD 3.15, USD 2.72, and USD 0.72, respectively.
- In 2019, performance apparel and sports-inspired apparel saw slight increases to USD 3.19 and USD 2.86, while swimwear declined slightly to USD 0.71.
- The year 2020 saw a decrease across all segments, with performance apparel at USD 2.90, sports-inspired apparel at USD 2.68, and swimwear at USD 0.62.
- However, 2021 marked a recovery, with performance apparel reaching USD 3.25, sports-inspired apparel at USD 3.08, and swimwear at USD 0.68.
- This upward trend continued through 2022, with performance apparel and sports-inspired apparel at USD 3.24 and USD 3.12, respectively, while swimwear remained at USD 0.68.
2023-2029
- In 2023, significant growth occurred, with performance apparel reaching USD 3.71, sports-inspired apparel at USD 3.61, and swimwear at USD 0.77.
- Projections for 2024 show continued growth, with performance apparel at USD 3.86, sports-inspired apparel at USD 3.81, and swimwear at USD 0.79.
- By 2025, all segments are expected to see further increases, with performance apparel at USD 4.00, sports-inspired apparel at USD 4.00, and swimwear at USD 0.80.
- This growth trajectory is anticipated to continue, with performance apparel reaching USD 4.51, sports-inspired apparel at USD 4.71, and swimwear by USD 0.88 by 2029.
- The data indicates a sustained upward movement in average revenue per capita across all segments within the men’s sports and swimwear market.
(Source: Statista)
Global Sports & Swimwear Market Share – By Sales Channel Statistics
2017-2021
- The Global Sports & Swimwear Market share by sales channel has evolved significantly from 2017 to 2020.
- In 2017, offline sales dominated the market, accounting for 90.5% of total sales, while online sales made up just 9.5%.
- The following year, offline sales slightly decreased to 90.1%, with online sales growing to 9.9%.
- In 2019, the shift toward online sales continued, reaching 10.9%, as offline sales dropped to 89.1%.
- The onset of the COVID-19 pandemic in 2020 caused a notable increase in online sales, which rose to 15.2%, while offline sales fell to 84.8%.
- This trend continued into 2021, with offline sales at 83.1% and online sales at 16.9%.
2022-2027
- In 2022, offline sales slightly rebounded to 84.4%, with online sales at 15.6%.
- By 2023, offline sales grew slightly to 85.2%, while online sales decreased to 14.8%.
- Looking ahead, in 2024, the market is expected to maintain this trend, with offline sales at 84% and online sales reaching 16%.
- Projections for 2025 and 2026 suggest a continued shift, with offline sales at 82.6% and 82.5%, respectively, while online sales will increase to 17.4% and 17.5%.
- By 2027, online sales are expected to account for 17.9%, marking a continued but gradual shift toward e-commerce in the sports and swimwear sector.
(Source: Statista)
Competitive Landscape of the Sports & Swimwear Market Worldwide Statistics
- In 2022, the global sports and swimwear market was highly competitive, with Nike leading the market with a 7% share.
- FILA and Under Armour both held a 3% share, while Adidas accounted for 2%.
- Other significant players, such as Anta, Calzedonia, Old Navy, Puma, Tigora, and Xtep, each held a 2% share.
- The remaining 73% of the market was comprised of various other brands.
- This distribution highlights Nike’s dominance in the market, while a diverse range of smaller brands contributed to the overall market share.
(Source: Statista)
Revenue of the Sports & Swimwear Market Worldwide – By Country Statistics
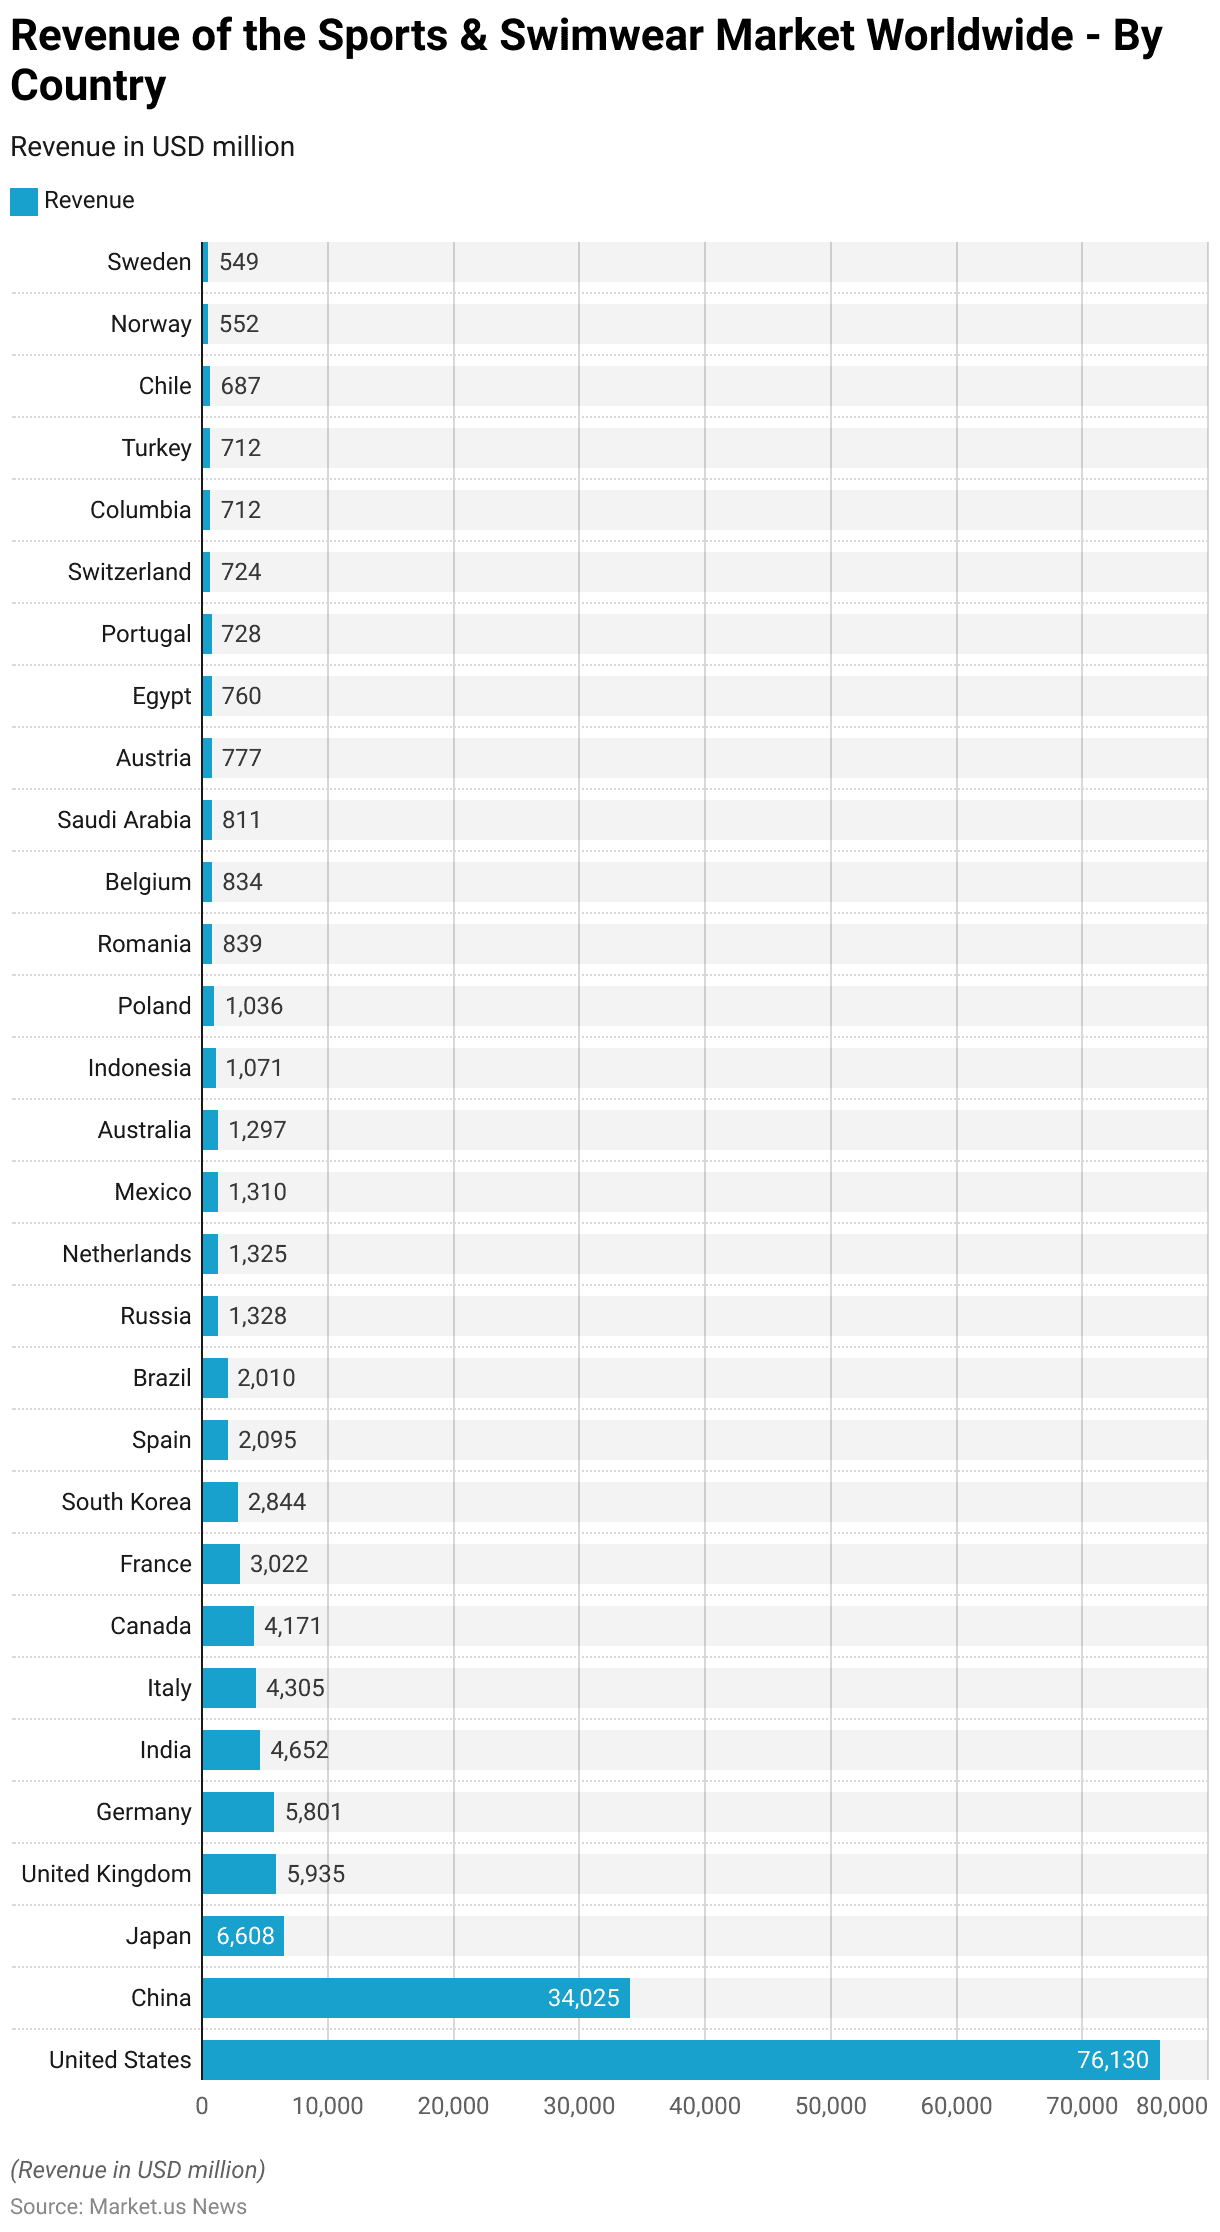
- In 2023, the revenue of the global sports and swimwear market showed significant variations across countries.
- The United States led the market with a substantial revenue of USD 76,130 million, followed by China at USD 34,025 million.
- Japan ranked third with USD 6,608 million, while the United Kingdom and Germany generated USD 5,935 million and USD 5,801 million, respectively.
- Other key markets included India at USD 4,652 million, Italy at USD 4,305 million, and Canada at USD 4,171 million.
- France earned USD 3,022 million, while South Korea’s revenue reached USD 2,844 million.
- Spain and Brazil followed closely with revenues of USD 2,095 million and USD 2,010 million, respectively.
- Russia, the Netherlands, and Mexico reported revenues of USD 1,328 million, USD 1,325 million, and USD 1,310 million, respectively.
- Australia earned USD 1,297 million, while Indonesia’s revenue stood at USD 1,071 million.
- Poland and Romania generated USD 1,036 million and USD 839 million, respectively, followed by Belgium at USD 834 million and Saudi Arabia at USD 811 million.
- Austria earned USD 777 million, while Egypt and Portugal generated USD 760 million and USD 728 million, respectively.
- Switzerland, Colombia, and Turkey reported similar revenues of USD 724 million, USD 712 million, and USD 712 million, respectively, while Chile earned USD 687 million.
- Smaller markets like Norway and Sweden generated USD 552 million and USD 549 million, respectively.
- This data highlights the diverse market dynamics and revenue generation across key regions in the global sports and swimwear sector in 2023.
(Source: Statista)
Women Swimwear Market Statistics
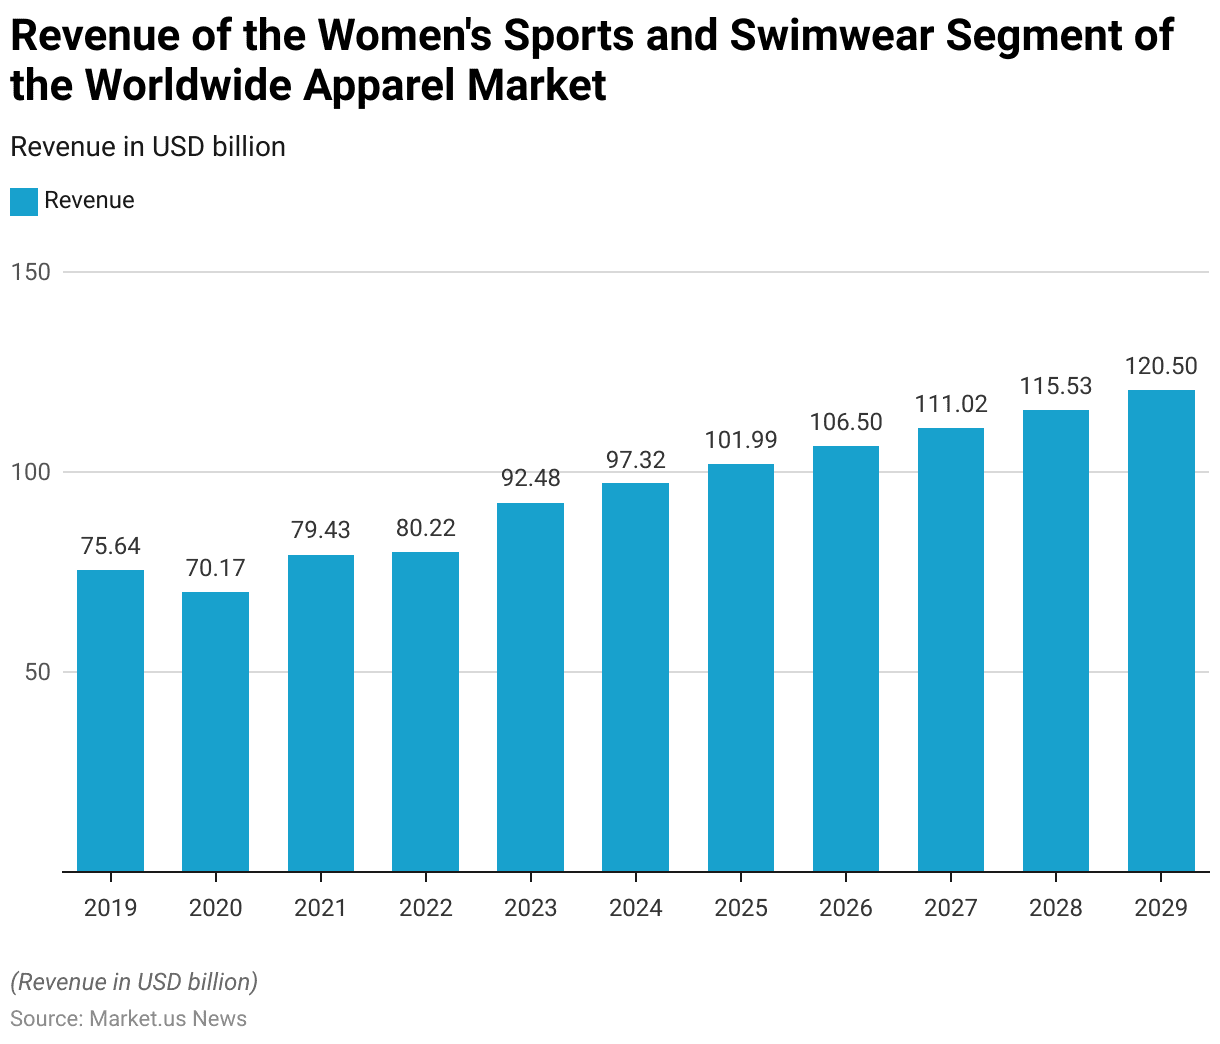
Revenue of the Women’s Sports and Swimwear Segment of the Worldwide Apparel Market
- The revenue of the women’s sports and swimwear segment of the worldwide apparel market has experienced steady growth from 2019 to 2029.
- In 2019, the market generated USD 75.64 billion, but in 2020, it saw a decline to USD 70.17 billion, likely due to the impact of the COVID-19 pandemic.
- The market quickly recovered in 2021, reaching USD 79.43 billion, and continued its upward trajectory in 2022, with a revenue of USD 80.22 billion.
- In 2023, the market saw a significant surge, reaching USD 92.48 billion.
- Projections indicate continued growth, with the market expected to reach USD 97.32 billion in 2024.
- By 2025, revenue is anticipated to rise further to USD 101.99 billion, and this positive trend will continue into 2026, with an estimated revenue of USD 106.5 billion.
- The growth will persist through 2027, with revenue projected at USD 111.02 billion, followed by USD 115.53 billion in 2028.
- By 2029, the women’s sports and swimwear segment is expected to generate USD 120.5 billion, reflecting a robust and sustained growth trend throughout the forecast period.
(Source: Statista)
Market Share of Women’s Swimwear Worldwide – By Type Statistics
- As of 2018, the global market share of women’s swimwear was predominantly driven by bikinis, which held a significant 68% share of the market.
- Swimsuits followed, accounting for 28% of the market share, while swimshorts represented a smaller segment, comprising 4% of the total market.
- This distribution highlights the dominant preference for bikinis among women, with swimsuits also maintaining a notable presence and swimshorts capturing a smaller portion of the market.
(Source: Statista)
Luxury Segment Share of the Women’s Swim Market Worldwide
- The luxury segment of the women’s swimwear market experienced notable growth between 2016 and 2018.
- In 2016, luxury swimwear accounted for 9% of the global market share.
- By 2018, this share had increased significantly to 16%, reflecting rising demand for high-end swimwear and a shift towards premium offerings in the market.
- This growth indicates a growing consumer preference for luxury swimwear options over the period.
(Source: Statista)
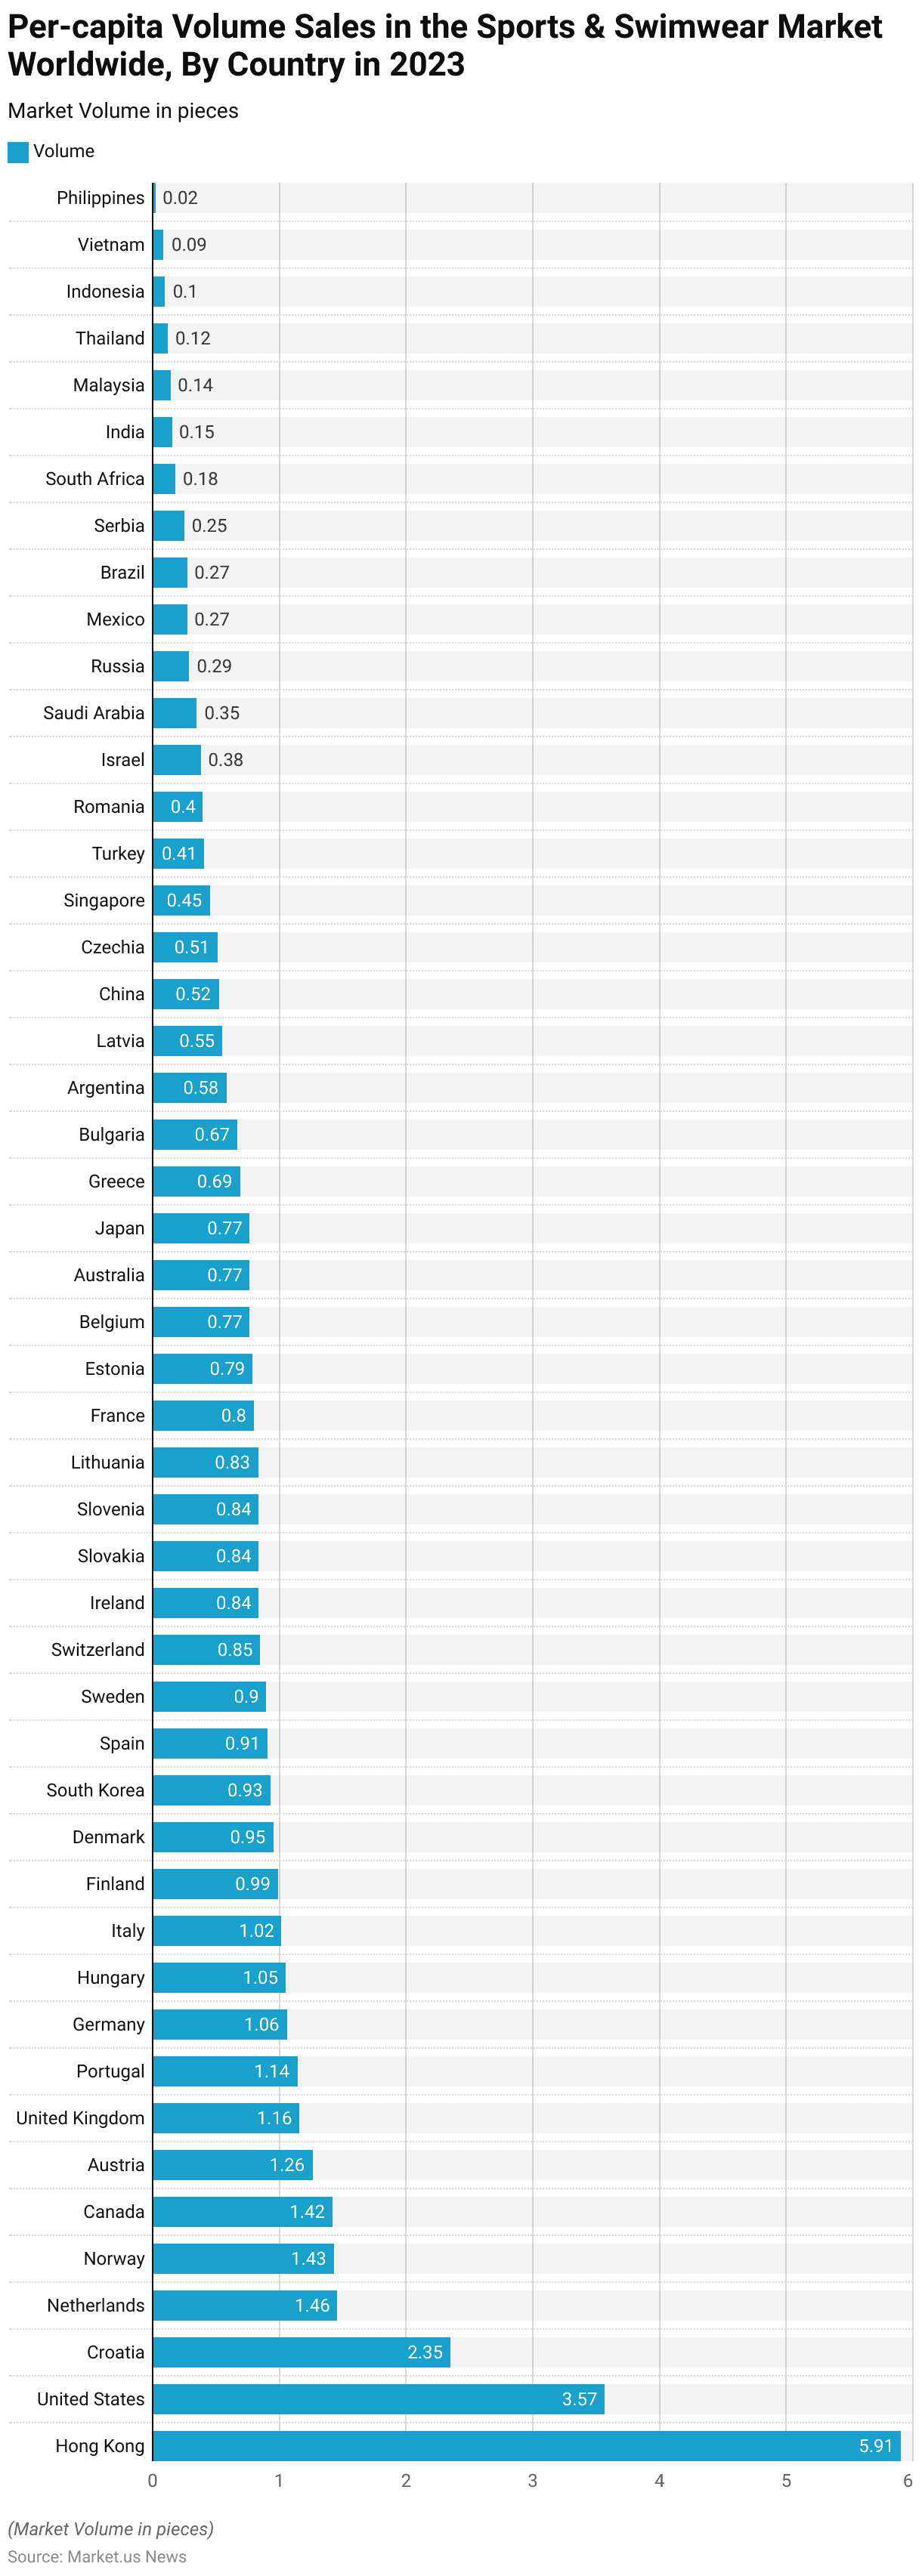
Statistics of Swimwear Sales
- In 2023, per-capita volume sales in the global sports and swimwear market varied significantly across countries.
- Hong Kong led with the highest per-capita volume at 5.91 pieces, followed by the United States at 3.57 pieces.
- Croatia and the Netherlands had per-capita volumes of 2.35 and 1.46 pieces, respectively.
- Other countries with notable volumes include Norway (1.43 pieces), Canada (1.42 pieces), and Austria (1.26 pieces).
- The United Kingdom and Portugal had volumes of 1.16 and 1.14 pieces, respectively, while Germany and Hungary recorded 1.06 and 1.05 pieces.
- Italy (1.02 pieces), Finland (0.99 pieces), and Denmark (0.95 pieces) also showed solid per-capita sales.
- In comparison, countries such as South Korea (0.93 pieces), Spain (0.91 pieces), and Sweden (0.90 pieces) had somewhat lower sales volumes.
- As the per-capita volumes decreased further, France (0.80 pieces), Estonia (0.79 pieces), and Belgium (0.77 pieces) were among the countries with lower numbers, with Australia, Japan, and Greece recording 0.77, 0.77, and 0.69 pieces, respectively.
- On the lower end of the scale, India (0.15 pieces), Thailand (0.12 pieces), and Indonesia (0.10 pieces) had the smallest per-capita volumes, with the Philippines at just 0.02 pieces.
- This distribution highlights a significant disparity in the demand for sports and swimwear products across different regions.
(Source: Statista)
Swimwear Price Statistics
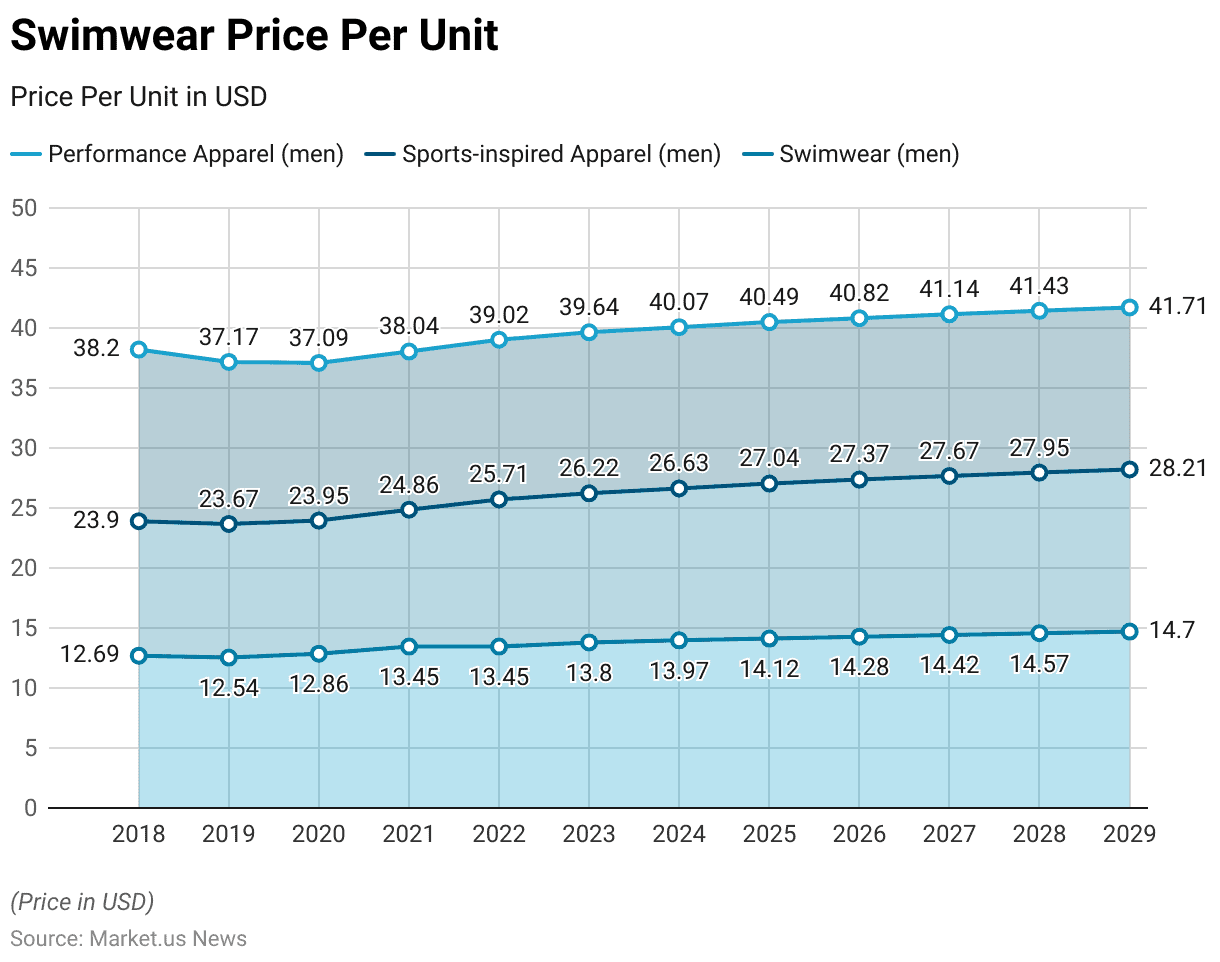
Swimwear Price Per Unit Statistics
- The price per unit of swimwear for men has shown a steady upward trajectory from 2018 to 2029, reflecting gradual price increases across the years.
- In 2018, the price for men’s swimwear was recorded at USD 12.69.
- This figure slightly decreased to USD 12.54 in 2019 but then experienced a moderate increase to USD 12.86 in 2020.
- By 2021, swimwear prices saw a more notable rise to USD 13.45, which remained constant through 2022.
- In 2023, the price increased again, reaching USD 13.80, and continued to rise in 2024 to USD 13.97.
- Moving forward, the trend of gradual increases persisted, with the price forecasted to reach USD 14.12 in 2025, USD 14.28 in 2026, and USD 14.42 in 2027.
- By 2028, the price is projected to further increase to USD 14.57, and by 2029, it is expected to hit USD 14.70.
- This consistent price growth indicates a gradual escalation in the cost of men’s swimwear, possibly driven by factors such as inflation, rising production costs, or enhanced product quality.
(Source: Statista)
Average Product Discount of Swimwear Worldwide Statistics
- In 2022, the average product discount on swimwear worldwide showed a consistent pattern throughout the year.
- Discounts were highest in January and February, at 37%, and remained at this level in September, November, and December.
- March, June, and July saw slightly lower discounts, averaging 33%, while April, May, and October experienced discounts of 32%, 30%, and 36%, respectively.
- Throughout the year, the discount levels remained relatively stable, with most months reflecting a consistent discount rate of around 37%, indicating a seasonal pricing strategy in the swimwear market.
(Source: Statista)
Men’s Swimwear Preferences and Dynamics Statistics
Men’s Criteria for the Selection of a Swimsuit
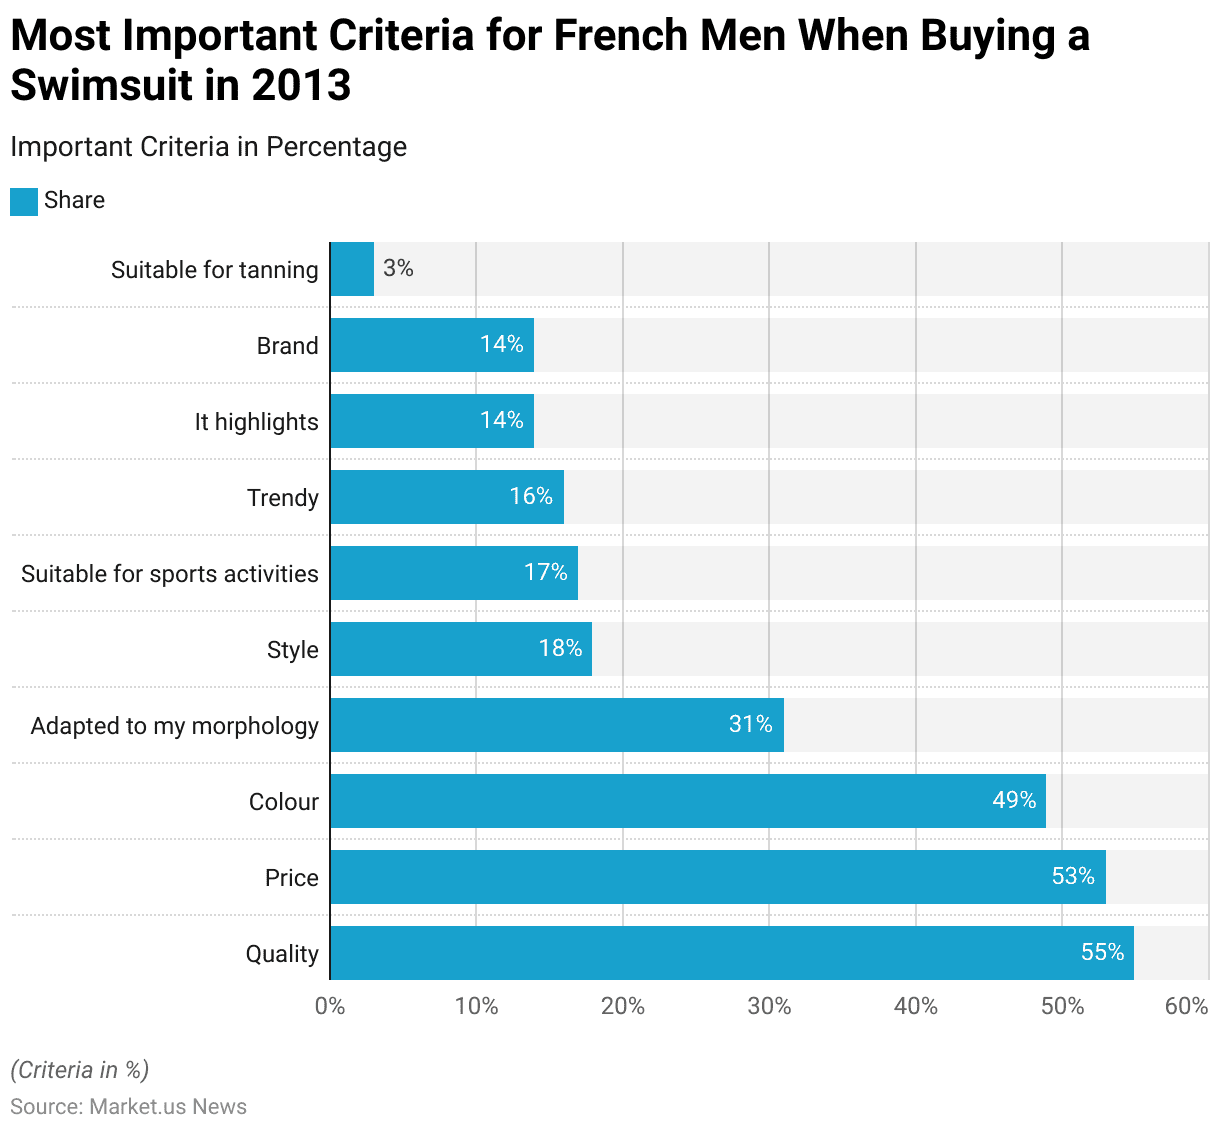
- In 2013, when purchasing a swimsuit, the most important criteria for French men were quality and price, with 55% and 53% of respondents, respectively, highlighting these factors.
- Color followed closely behind, being a priority for 49% of men.
- Additionally, 31% of men considered whether the swimsuit was adapted to their morphology, while 18% prioritized style.
- A smaller portion, 17%, looked for swimsuits suitable for sports activities, and 16% valued trendy designs.
- Swimsuits that accentuated the physique were important for 14% of respondents, with the same percentage (14%) mentioning brand as a deciding factor.
- Only 3% of men considered whether the swimsuit was suitable for tanning when making their purchase decision.
(Source: Statista)
The Frequency at Which Men Purchase Swimwear – By Age Statistics
- In 2017, the frequency of swimwear purchases among men in the United States varied significantly by age group.
- For those aged 16 to 25 years, 3% purchased swimwear at least once a month, 13% at least once every six months, and 39% at least once a year. A smaller percentage, 24%, bought swimwear at least once every two years, while 12% purchased it every five years, 4% less often, and 4% never.
- Among men aged 26 to 35 years, 4% bought swimwear at least once a month, 13% at least once every six months, and 26% at least once per year. Additionally, 32% bought swimwear at least once every two years, 13% every five years, 6% less often, and 5% never.
- For the 36 to 50-year-olds, 10% bought swimwear at least once every six months, 32% at least once a year, and 31% at least once every two years. Only 9% purchased swimwear every five years, 9% less often, and 10% never.
- Among men aged 51 and older, 3% bought swimwear at least once every six months, 12% at least once a year, and 26% at least once every two years.
- A significant proportion, 22%, purchased it once every five years, 24% less often, and 13% never.
(Source: Statista)
Frequency at Which Men Purchase Swimwear – By Ethnicity Statistics
- In 2017, the frequency of swimwear purchases among men in the United States varied by ethnicity.
- Black or African American men typically purchased swimwear less frequently, with 16% buying at least once every six months, 16% at least once per year, and 20% at least once every two years. Only 0% of this group bought swimwear monthly, and 28% reported never purchasing it.
- Hispanic American or Latino men showed a more consistent purchasing pattern, with 19% buying at least once every six months and 42% at least once per year. A smaller group, 6%, bought swimwear at least once every five years, while 3% purchased less frequently, and no respondents reported never buying swimwear.
- White or Caucasian men purchased swimwear primarily at least once per year (25%), with 7% purchasing at least once every six months. 29% bought swimwear at least once every two years, 16% bought it at least once every five years, while 8% never purchased swimwear.
- Among Asian men, 8% bought swimwear at least once every six months, 22% at least once per year, and 24% at least once every two years. Less frequent purchases were noted among 16%, with 22% purchasing swimwear less often and 8% never buying it.
(Source: Statista)
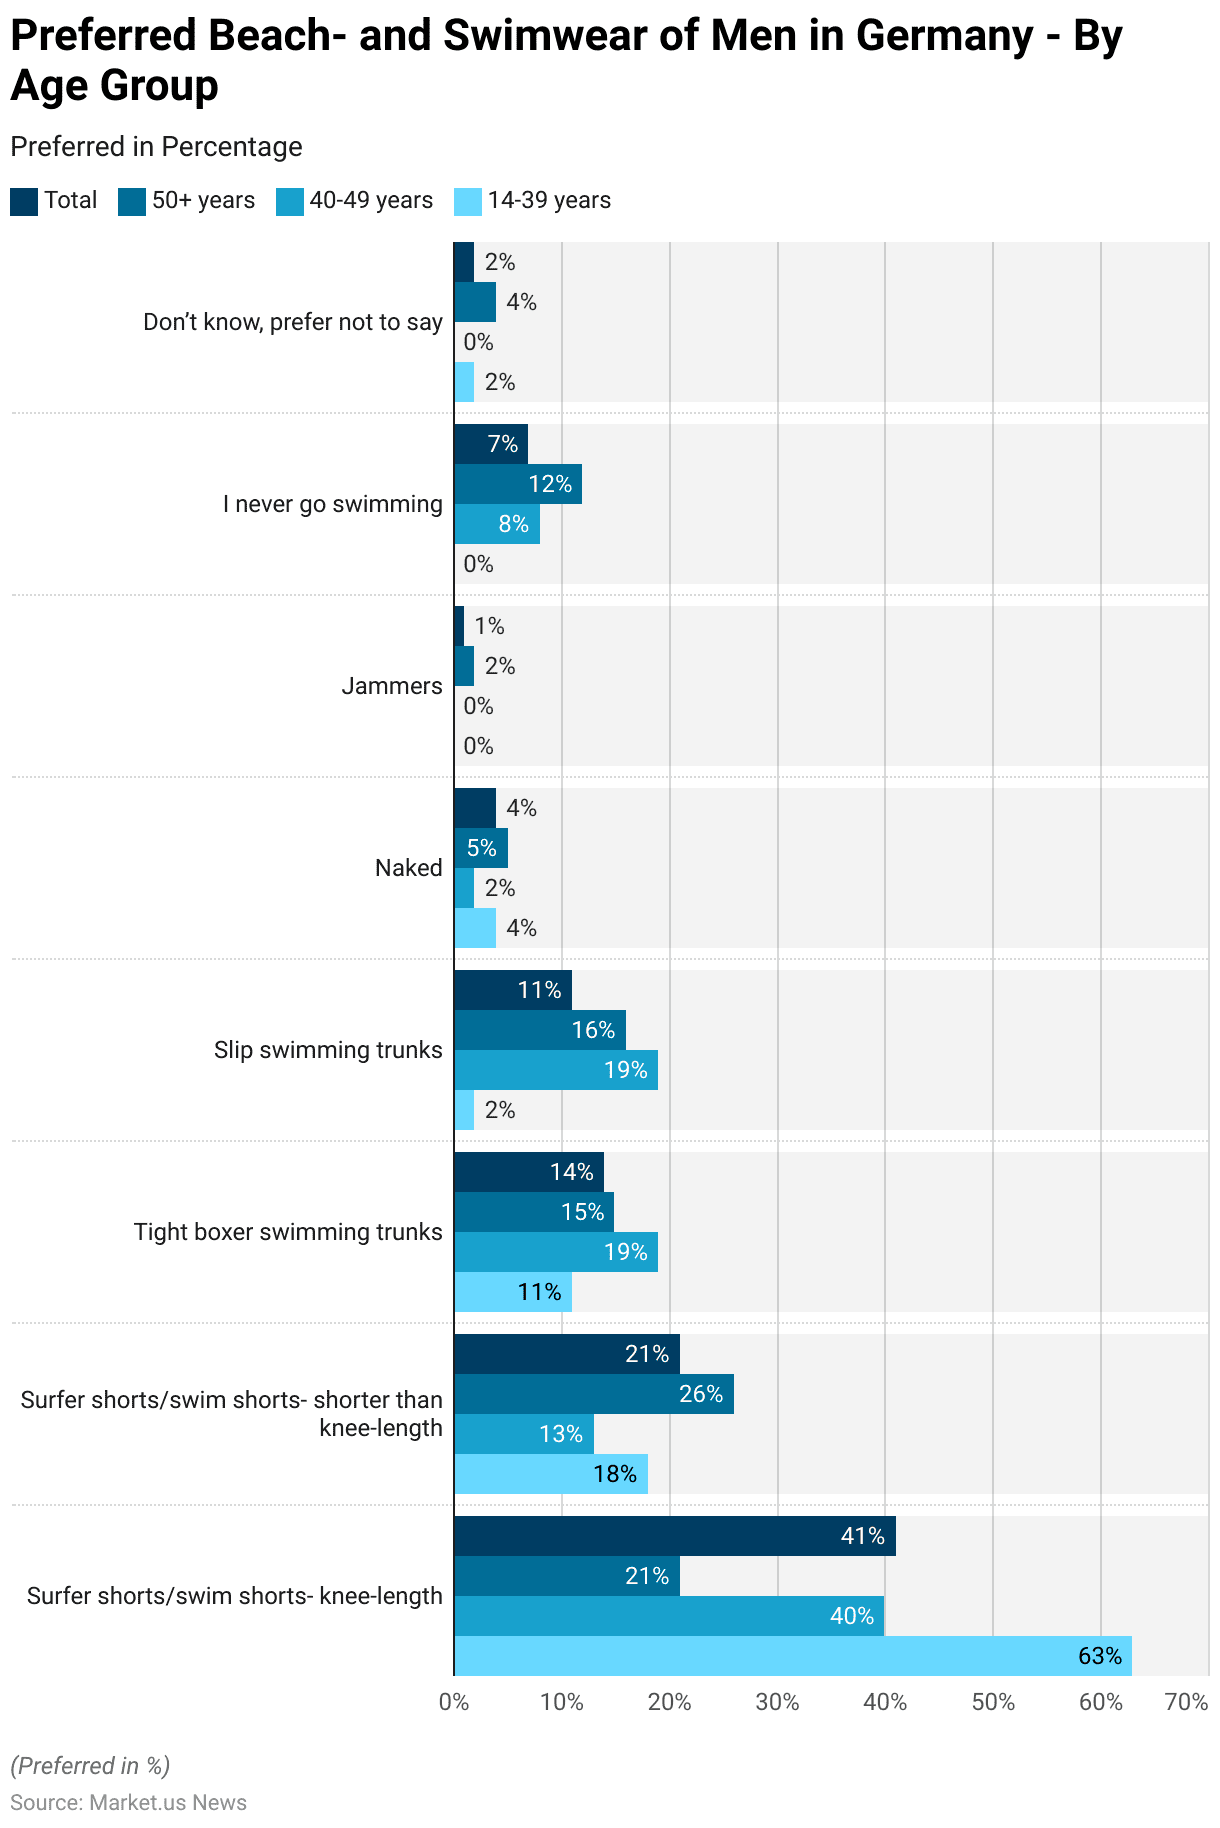
Preferred Beach- and Swimwear of Men – By Age Group Statistics
- In 2013, men’s beach- and swimwear preferences in Germany varied significantly by age group.
- Overall, 41% of men preferred surfer shorts or knee-length swim shorts, with this style particularly favored by younger men, as 63% of those aged 14-39 years chose them. In contrast, only 21% of men aged 50+ years preferred knee-length shorts.
- A further 21% of all men preferred surfer shorts or swim shorts that were shorter than knee-length, with this style more popular among men aged 50+ years (26%) than younger age groups (18% of men aged 14-39 years).
- Tight boxer swimming trunks were preferred by 14% of men overall, with a higher proportion (19%) of those aged 40-49 years opting for this style.
- Slip swimming trunks were chosen by 11% of men, particularly 19% of those aged 40-49 years, but only 2% of younger men.
- A small portion of men, 4%, chose to swim naked, with a higher percentage (5%) of men aged 50+ years selecting this option.
- Jammers were the least popular choice, selected by just 1% of men overall, including 2% of men aged 50+ years.
- Additionally, 7% of men reported never going swimming, with a notable 12% of men aged 50+ years falling into this category. In comparison, 2% of men either didn’t know or preferred not to disclose their preferences.
(Source: Statista)
Men’s Swimwear Usage – By Expenditure Statistics
- In 2020, the usage of men’s swimwear in France varied based on expenditure.
- The majority of users, approximately 1,432, spent between 5 to 19 euros on swimwear.
- This was followed by 1,025 users spending 20 to 29 euros and 545 users who allocated 30 to 49 euros.
- A smaller segment, 280 individuals, spent between 50 to 99 euros, while only 128 people opted for swimwear costing less than 5 euros.
- At the higher end of the spectrum, just 18.6 individuals in every 1,000 spent 100 euros or more, indicating that most consumers preferred mid-range pricing for men’s swimwear.
(Source: Statista)
Women’s Swimwear Preferences and Dynamics
Preferred Beach- and Swimwear of Women – By Age Group Statistics
- In 2013, the preferred types of beach and swimwear for women in Germany varied by age group.
- Overall, the most popular choice was the swimsuit, preferred by 44% of women, with a notable difference across age groups: 60% of women aged 50 and above preferred swimsuits, compared to only 26% of women aged 14-39.
- The bikini was the second most popular option, chosen by 26% of all women, and was especially favored by 57% of women in the 14-39 age range, while just 5% of women over 50 chose it.
- Tankinis were preferred by 9% of women overall, with a higher preference among women aged 40-49 (17%).
- A smaller proportion, 5%, combined a pareo with a swimsuit, and 3% chose surfer shorts or swim shorts with a bikini top.
- Other choices included going naked (2%), pairing a pareo with a bikini (2%), or going topless (0%).
- A burkini was chosen by 1% of women in the 14-39 age group.
- Additionally, 7% of women overall stated they never went swimming, with a higher percentage (12%) among women aged 50 and older.
(Source: Statista)
Frequency at Which Women Purchase Swimwear – By Age Statistics
- In 2017, the frequency with which women in the United States purchased swimwear varied by age group.
- Among women aged 16 to 25 years, 52% purchased swimwear at least once per year, while 15% did so every two years and 9% less frequently.
- A smaller proportion, 2%, bought swimwear at least once every month.
- In the 26 to 35 years age group, 42% purchased swimwear annually, 25% did so every two years, and 11% bought swimwear once every five years.
- Monthly purchases were less common, at 4%.
- Women aged 36 to 50 years showed similar purchasing habits, with 31% buying swimwear once a year and 27% every two years.
- Additionally, 15% purchased swimwear once every five years, while 13% bought it less often.
- Among women aged 51 years and older, 23% bought swimwear every two years, and 22% made a purchase annually.
- Only 1% bought swimwear monthly, while 23% purchased it less often, and 15% reported never buying swimwear.
(Source: Statista)
Frequency at Which Women Purchase Swimwear – By Ethnicity Statistics
- In 2017, the frequency at which women in the United States purchased swimwear varied across ethnicities.
- Among Black or African American women, 3% made purchases at least once a month, 7% at least once in six months, and 33% at least once per year.
- A significant portion, 20%, purchased swimwear at least once every two years, while 20% bought it less frequently, and 13% never purchased swimwear.
- Hispanic American or Latino women showed a slightly higher purchasing frequency, with 4% buying swimwear at least once a month, 12% at least once in six months, and 40% at least once per year.
- Additionally, 16% purchased swimwear at least once every two years, while 12% bought it less often, and 12% never purchased it.
- White or Caucasian women had 1% purchasing swimwear at least once a month, 6% at least once in six months, and 35% at least once per year.
- Around 24% bought swimwear at least once every two years, with 13% purchasing less often and 8% never making a purchase.
- Asian women had the highest proportion (5%) purchasing swimwear at least once a month, while 5% bought it at least once in six months and 25% at least once per year.
- Furthermore, 20% purchased swimwear at least once every two years, while 25% bought it less often, and 15% never purchased swimwear.
(Source: Statista)
Women’s Swimwear Usage – By Expenditure Statistics
- In 2023, the distribution of women’s swimwear users in France varied significantly by expenditure.
- The largest group, consisting of 1,721,000 people, spent less than 20 euros on swimwear.
- A similar number, 1,236,000 individuals, spent between 20 and 29 euros, while 1,237,000 people spent between 30 and 49 euros.
- The number of people spending between 50 and 99 euros decreased to 569,000, and only 97,200 people spent 100 euros or more on women’s swimwear.
(Source: Statista)
Women’s Swimwear Usage – By Number of Purchased Items Statistics
- From 2014 to 2020, the number of people using women’s swimwear in France varied by the number of purchased items.
- In 2014, 5,481,000 individuals bought one item, 2,086,000 purchased two, and 591,000 bought three or more.
- The trend saw a slight decline in 2015, with 5,211,000 purchasing one item, 1,900,000 buying two, and 523,000 acquiring three or more.
- In 2016, the numbers were 5,135,000 for one item, 2,032,000 for two, and 587,000 for three or more.
- By 2017, 4,760,000 people bought one item, 1,982,000 purchased two, and 435,000 bought three or more.
- The numbers continued to decrease in 2018, with 4,092,000 purchasing one item, 1,659,000 two, and 510,000 three or more.
- In 2019, 4,060,000 bought one, 1,511,000 two, and 527,000 three or more.
- By 2020, 3,706,000 individuals bought one item, 1,606,000 purchased two, and 462,000 acquired three or more items.
(Source: Statista)
Swimwear Preferences and Trends in Different Countries
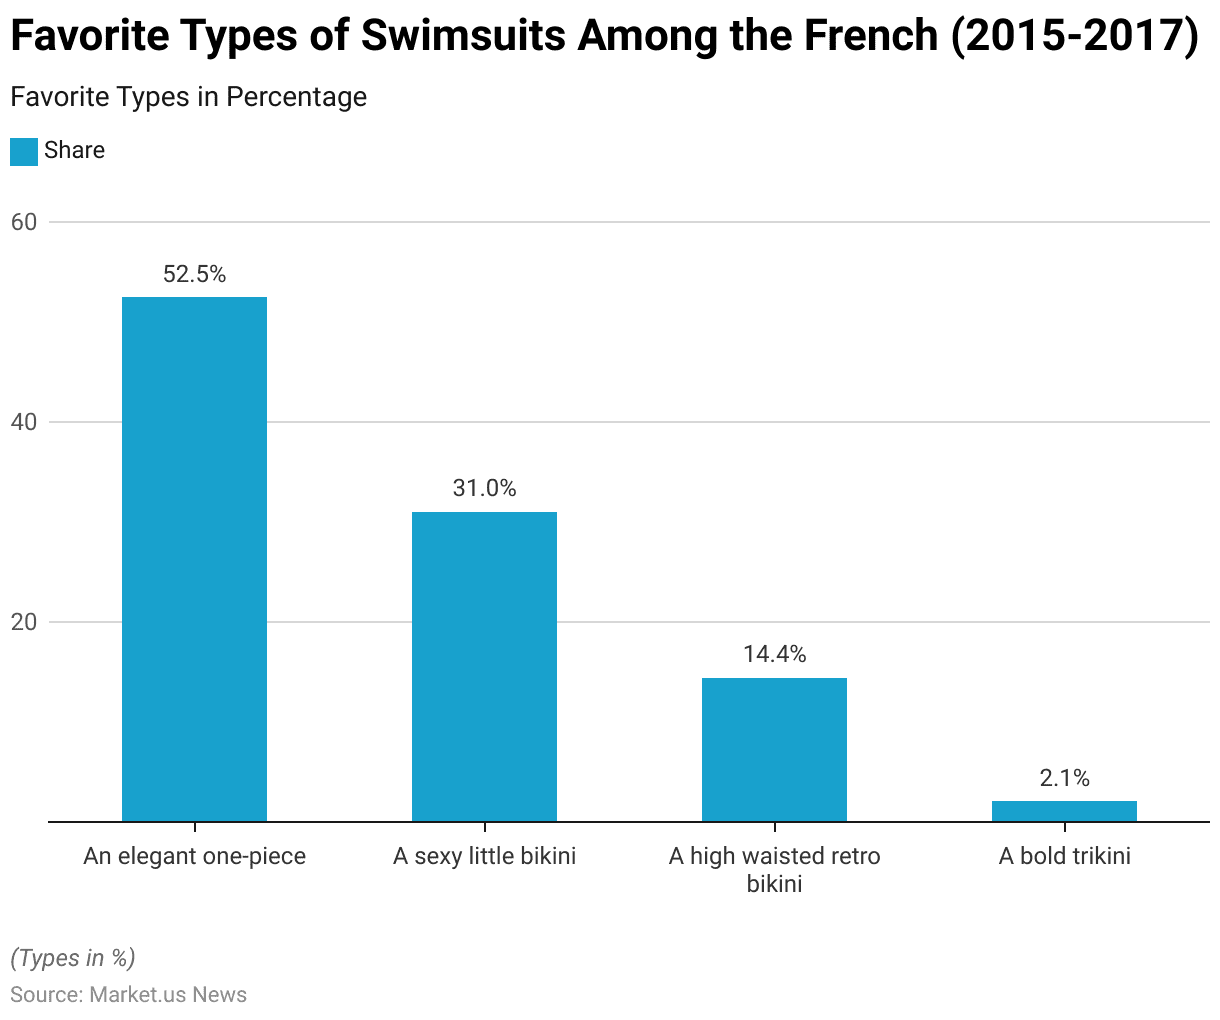
Favourite Types of Swimsuits Among the French
- Between 2015 and 2017, the favorite types of swimsuits among the French varied in terms of popularity.
- The most favored option was the elegant one-piece swimsuit, preferred by 52.5% of respondents.
- Following this, 31% of individuals favored a sexy little bikini, while 14.4% preferred the high-waisted retro bikini.
- The bold trikini was the least popular, with only 2.1% of respondents selecting it as their favorite type of swimsuit.
(Source: Statista)
Most Popular Swimwear and Sportswear Brands in Germany
- From 2015 to 2018, the number of customers purchasing from the most popular swimwear and sportswear brands in Germany showed varying trends.
- Adidas maintained its position as the leading brand, with the number of customers growing from 11.29 million in 2015 to 12.28 million in 2018.
- Nike experienced some fluctuation, increasing from 7.48 million in 2015 to 8.76 million in 2017 before slightly declining to 8.56 million in 2018.
- Puma’s customer base grew steadily, from 4.78 million in 2015 to 5.58 million in 2018.
- Reebok also saw an upward trend, with customers increasing from 2.98 million in 2015 to 4.05 million in 2018.
- Espirit, on the other hand, showed stable performance, with its customer base growing slightly from 2.91 million in 2015 to 2.97 million in 2018.
(Source: Statista)
Frequency at Which Shoppers Purchase Swimwear for Others in the United States
- In 2017, the frequency with which shoppers in the U.S. purchased swimwear for others varied significantly.
- A small percentage, 2%, made such purchases at least once a month, while 10% bought swimwear for others at least once every six months.
- The largest share, 38%, purchased swimwear for others at least once per year.
- Meanwhile, 12% made these purchases at least once every two years, and 5% did so less often.
- Notably, 23% of respondents indicated that they never purchased swimwear for others.
(Source: Statista)
Swimwear Export Statistics
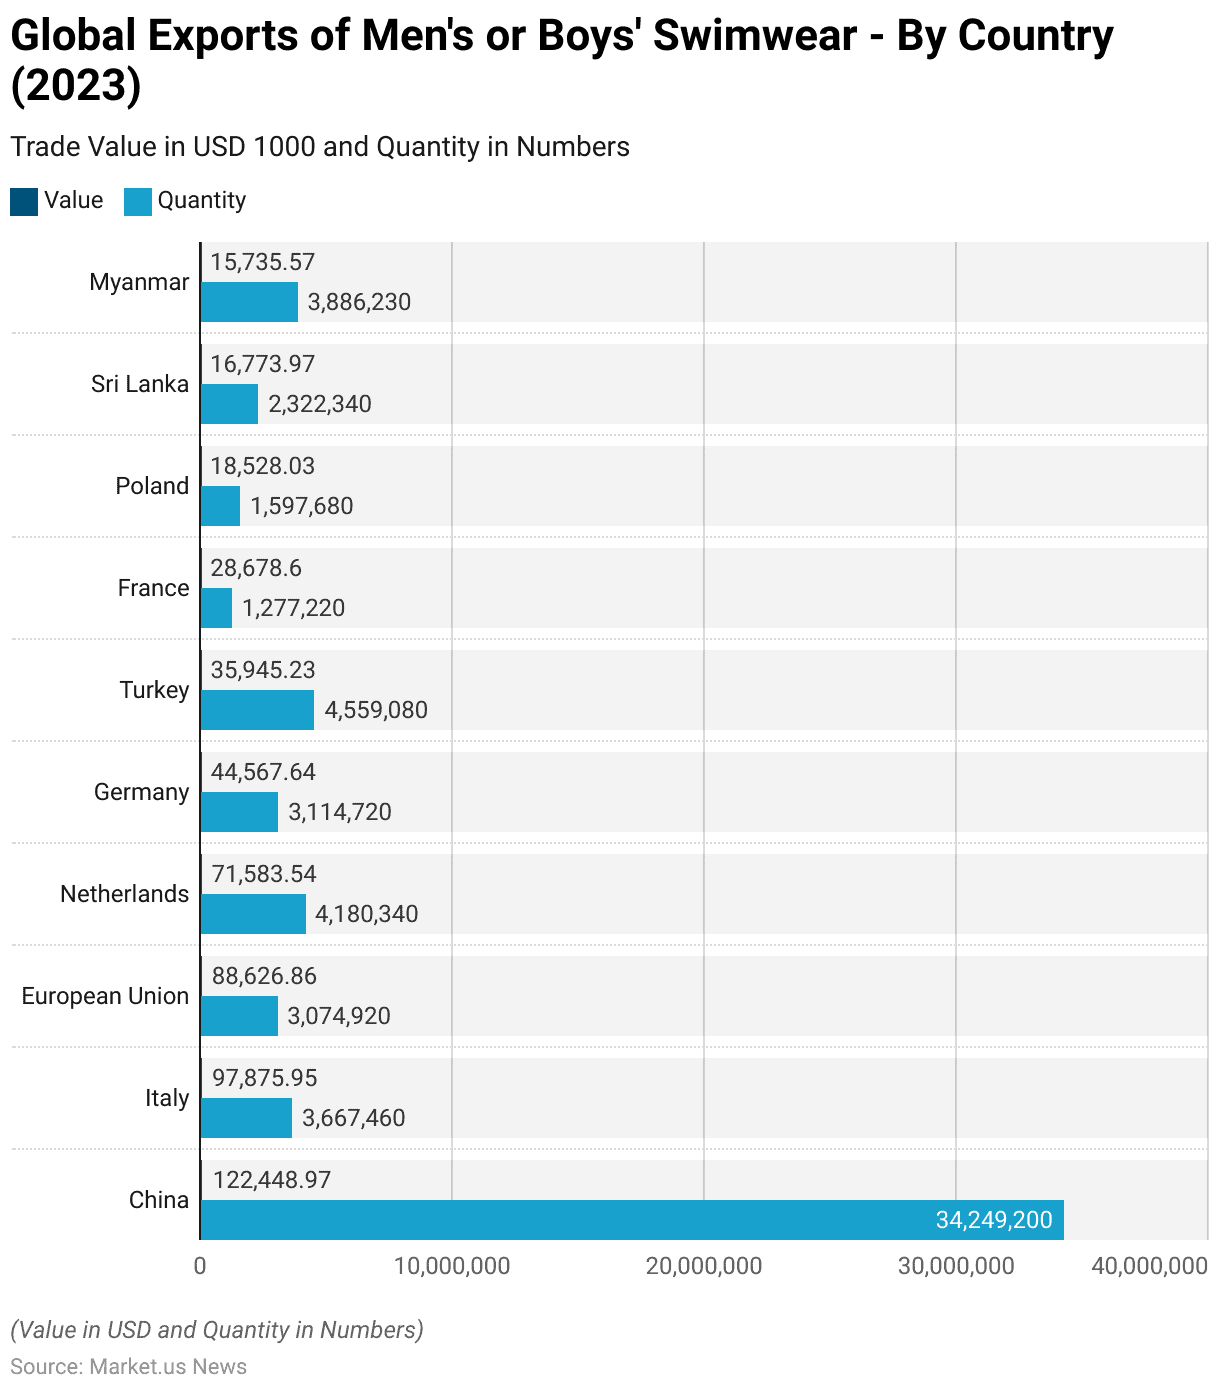
Global Exports of Men’s or Boys’ Swimwear – By Country Statistics
- In 2023, the global export of men’s or boys’ swimwear saw significant contributions from several countries.
- China led the export market with a total trade value of USD 122.45 million, accounting for 34,249,200 units.
- Italy followed with a trade value of USD 97.88 million, exporting 3,667,460 units.
- The European Union’s exports amounted to USD 88.63 million, representing 3,074,920 units.
- The Netherlands exported men’s or boys’ swimwear worth USD 71.58 million, with a quantity of 4,180,340 units.
- Germany’s export value stood at USD 44.57 million, with 3,114,720 units shipped globally.
- Turkey exported USD 35.95 million worth of swimwear, corresponding to 4,559,080 units.
- France’s exports were valued at USD 28.68 million, with 1,277,220 units.
- Poland’s export trade reached USD 18.53 million, accounting for 1,597,680 units.
- Sri Lanka exported swimwear worth USD 16.77 million, totaling 2,322,340 units, while Myanmar’s exports were valued at USD 15.74 million, with 3,886,230 units shipped worldwide.
(Source: WITS)
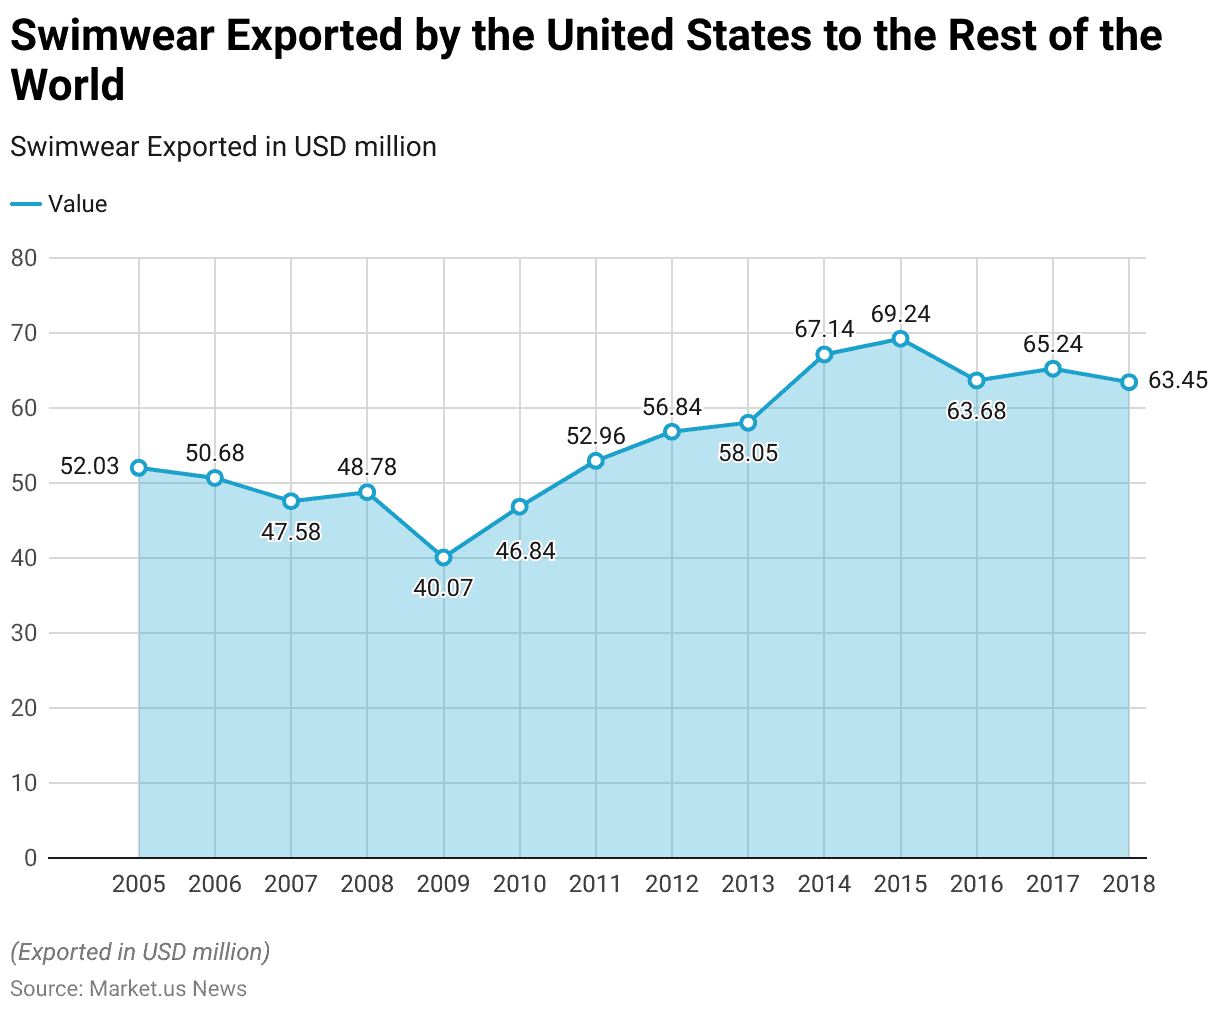
Swimwear Exported by the United States to the Rest of the World Statistics
- From 2005 to 2018, the United States saw fluctuations in the export value of swimwear to the rest of the world.
- In 2005, the export value stood at approximately $52.03 million, and it decreased to $50.68 million in 2006.
- Over the next few years, the export value remained relatively stable, ranging from $47.58 million in 2007 to $48.78 million in 2008.
- A dip was noted in 2009, with exports falling to $40.07 million.
- However, exports rebounded in 2010, reaching $46.84 million, and continued an upward trend in the following years, peaking at $69.24 million in 2015.
- The export value then decreased slightly in 2016 to $63.68 million before rising again to $65.24 million in 2017.
- By 2018, the export value was $63.45 million.
- This data reflects the overall stability and occasional fluctuations in the swimwear export market for the U.S. over 14 years.
(Source: Statista)
Export value of Swimwear for Men or Boys from Spain to Different Countries of the World
- In 2016, Spain’s export value of swimwear for men or boys varied significantly across different countries.
- Italy was the leading destination, with exports valued at approximately $63,008,620.
- Croatia followed with $20,166,190 in exports, while France received $15,466,640 worth of swimwear.
- Portugal and Germany had export values of $11,133,570 and $11,028,570, respectively.
- Belgium’s export value was recorded at $8,685,220, and the United Kingdom received $6,983,390 worth of Spanish swimwear.
- Denmark also accounted for a significant share, with $6,794,240 in exports.
- Smaller markets included Indonesia, with exports valued at $1,852,920, and Bulgaria, with a value of $1,185,280.
- These figures reflect Spain’s diverse swimwear export market in 2016.
(Source: Statista)
Swimwear Import Statistics
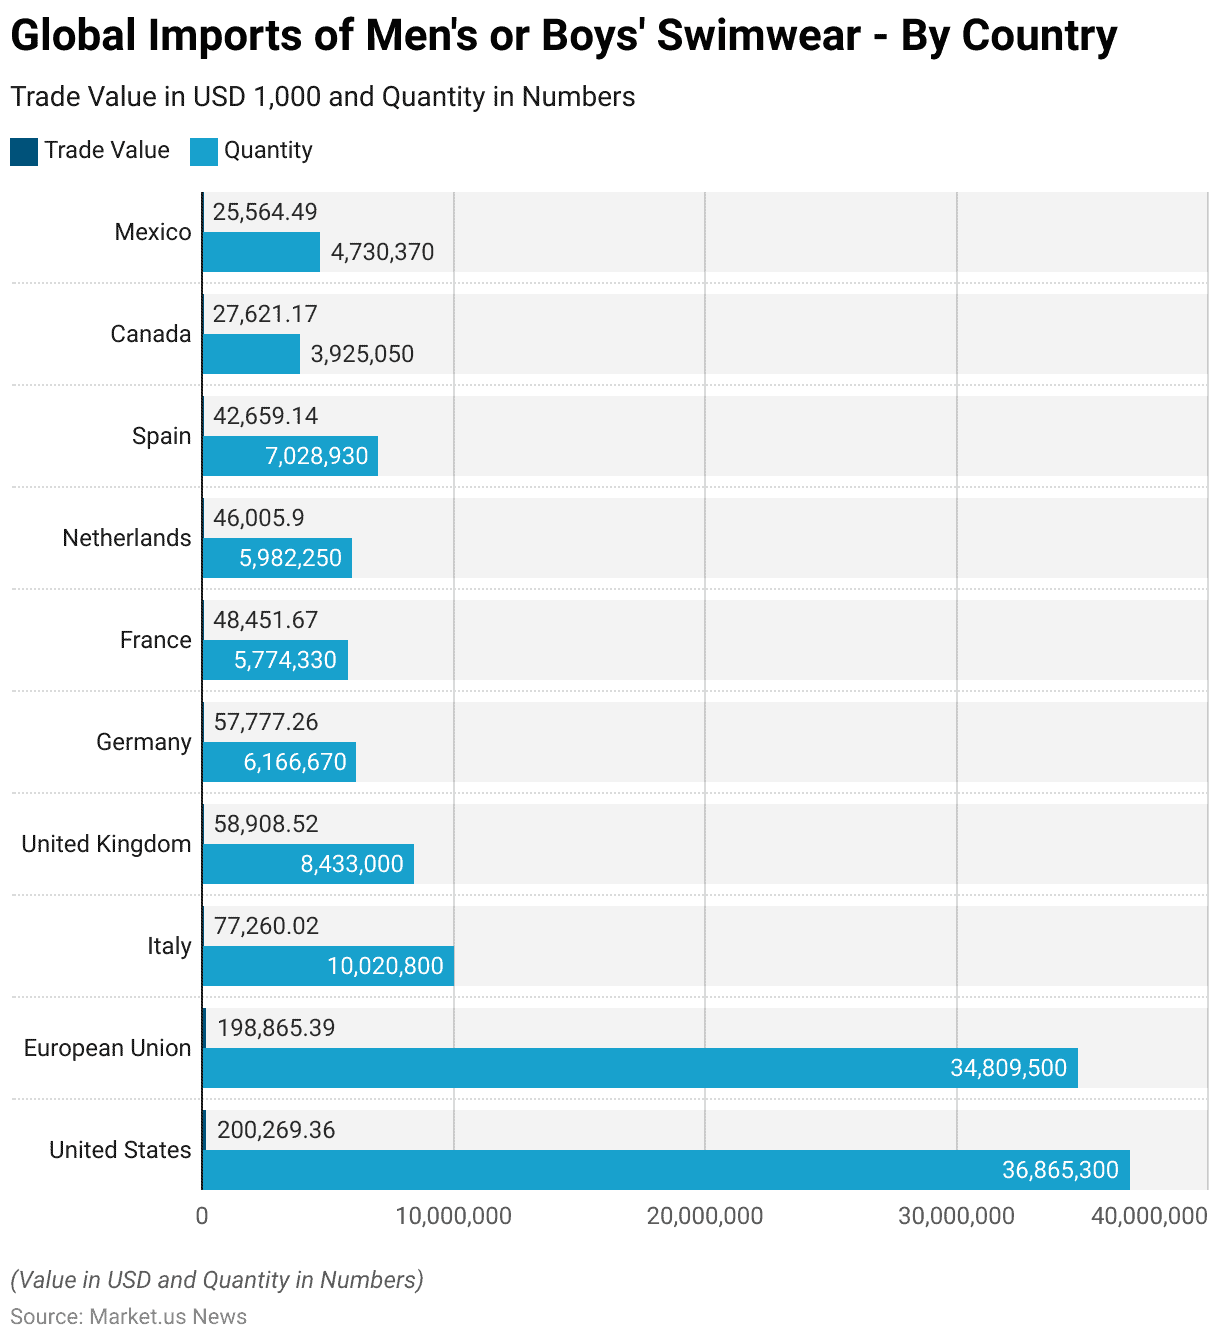
Global Imports of Men’s or Boys’ Swimwear – By Country
- In 2023, the United States led the global imports of men’s or boys’ swimwear, with a trade value of $200.27 million, importing 36.87 million items.
- The European Union followed closely, with imports valued at $198.87 million and a total of 34.81 million items.
- Italy ranked third with a trade value of $77.26 million, importing 10.02 million items.
- The United Kingdom imported $58.91 million worth of swimwear, totaling 8.43 million items, while Germany’s imports were valued at $57.78 million, corresponding to 6.17 million items.
- France imported $48.45 million in swimwear, with a total of 5.77 million items.
- The Netherlands imported swimwear worth $46.01 million, totaling 5.98 million items, followed by Spain, with $42.66 million in imports and 7.03 million items.
- Canada imported $27.62 million worth of swimwear, amounting to 3.93 million items, while Mexico’s imports were valued at $25.56 million, totaling 4.73 million items.
(Source: WITS)
Import Value of Swimsuits for Men or Boys to Spain from The Different Countries of the World
- In 2016, Spain’s imports of men’s or boys’ swimwear were primarily sourced from Portugal, with an import value of $23.22 million.
- Italy followed with $9.80 million in swimwear imports, while Mexico contributed $7.57 million.
- The United Kingdom accounted for $6.38 million in imports, and Greece added $6.22 million.
- France’s imports totaled $4.72 million, followed by Croatia with $2.55 million.
- Belgium supplied $2.04 million worth of swimwear, while Hungary’s contribution was valued at $1.37 million.
- Germany’s imports were notably lower, amounting to just $89,090.
(Source: Statista)
Women’s and Girls’ Swimwear Spanish Imports Value – By Country
- In 2023, Spain’s imports of women’s and girls’ swimwear were predominantly sourced from Tunisia, with an import value of $6.72 million.
- China followed with $3.34 million, while Vietnam contributed $1.70 million.
- Italy imported $1.67 million worth of swimwear, and France added $1.49 million to the total.
- Bangladesh’s contribution stood at $1.05 million, followed by Morocco with $960,840.
- Belgium accounted for $675,950, while Pakistan’s imports were valued at $619,910.
- Germany’s share was comparatively smaller, amounting to $556,280.
(Source: Statista)
New Product Arrivals
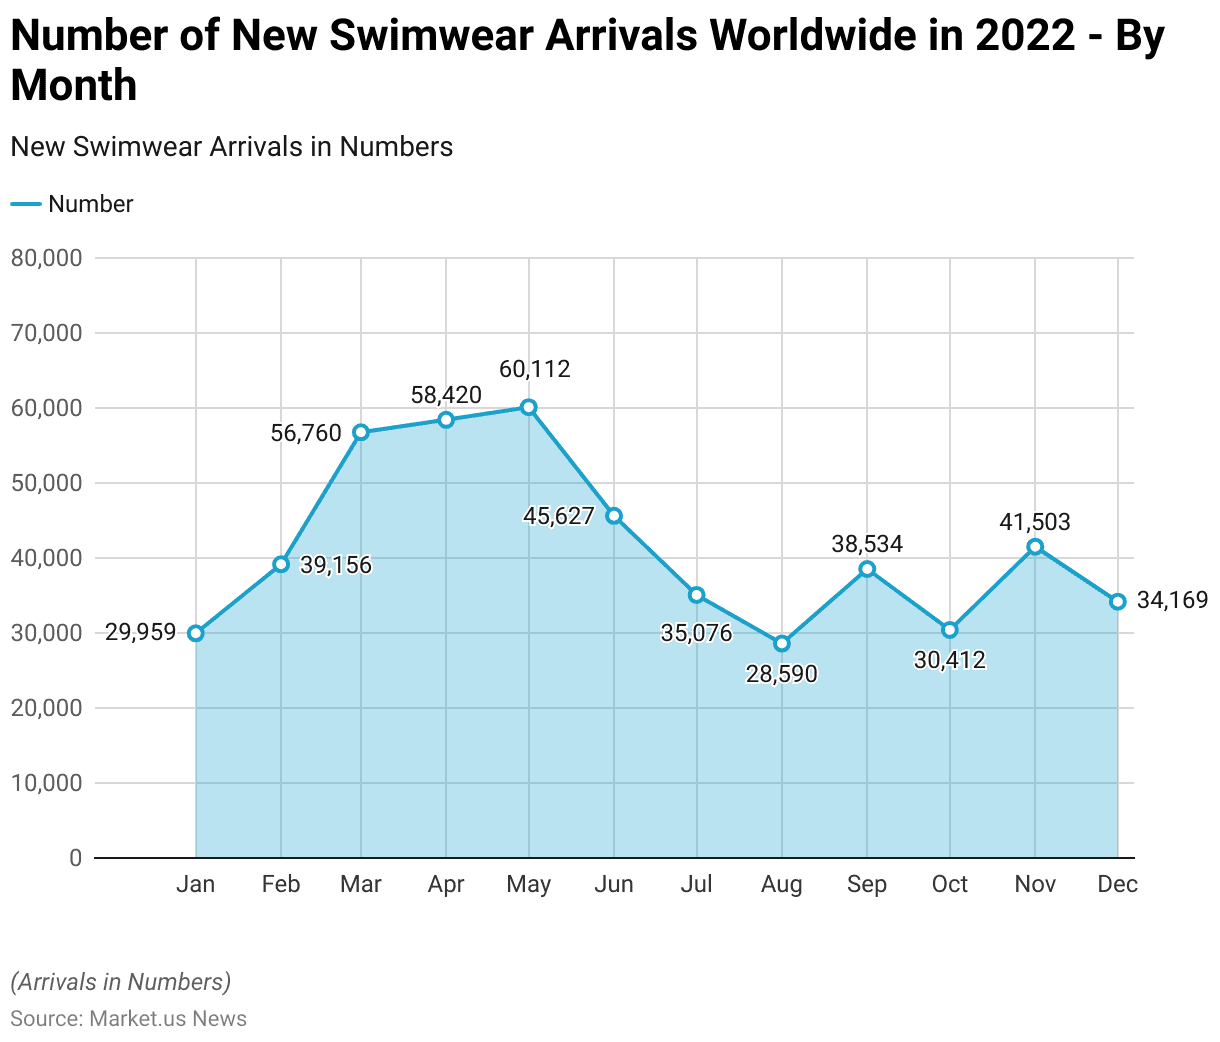
- In 2022, the global swimwear market saw a varied number of new styles arriving each month.
- January started with 29,959 new arrivals, while February saw an increase to 39,156.
- March and April experienced significant growth, with 56,760 and 58,420 new styles, respectively.
- May recorded the highest number, with 60,112 new swimwear designs entering the market.
- Later on, the numbers began to decline slightly, with June at 45,627, followed by 35,076 in July.
- August saw 28,590 new arrivals, and September had 38,534.
- October recorded 30,412 new items, and November experienced a rise to 41,503.
- The year closed with 34,169 new swimwear styles in December.
(Source: Statista)
Challenges and Concerns
- In 2021, Italy experienced significant beach pollution affecting various regions.
- Sicily had the longest stretch of beaches unsuitable for swimming, with 42.48 kilometers.
- Calabria followed with 23.47 kilometers, while Campania had 12.33 kilometers of polluted beaches.
- Sardinia reported 3.02 kilometers, and Abruzzo had 2.34 kilometers of beach affected by pollution.
- Marche had 1.54 kilometers, and Lazio recorded 1.03 kilometers of unsuitable beach areas.
- Tuscany had 1 kilometer of beach pollution, and Molise had a small stretch of 0.15 kilometers.
- Several regions, including Apulia, Emilia-Romagna, Friuli-Venezia Giulia, Veneto, Basilicata, and Liguria, reported no beaches unsuitable for swimming due to pollution.
(Source: Statista)
Recent Developments
Acquisitions and Mergers:
- Authentic Brands Group Acquires Speedo (2023): Authentic Brands Group (ABG) acquired the global licensing rights for Speedo, a leading swimwear brand, from Pentland Group in a deal valued at $1.5 billion. This acquisition is aimed at expanding ABG’s portfolio in the activewear and swimwear sector, capitalizing on the growing demand for athleisure and swimwear, particularly in North America and Europe.
- Lululemon Acquires Swimsuit Brand (2024): Lululemon, a major player in the athleisure space, acquired the swimwear brand ActiveSwim for an undisclosed amount. This acquisition is part of Lululemon’s broader strategy to diversify into new product categories and increase its presence in the swimwear market.
Product Launches:
- Speedo’s Sustainable Swimwear Collection (2023): Speedo launched its new eco-friendly swimwear line, EcoSplash, made with 100% recycled materials such as ocean plastics. This line is part of Speedo’s commitment to reducing its carbon footprint and responding to growing consumer demand for sustainable fashion. The line saw a 20% increase in sales during its first quarter of release.
- Aerie’s Swimwear Expansion (2024): Aerie, an American intimate and swimwear brand, expanded its swimwear range by adding new sizes and sustainable fabrics. The brand introduced the All Size Swim collection, which includes plus-size options and products made from recycled ocean plastic. Aerie reported a 35% year-over-year increase in swimwear sales following the launch.
Funding and Investments:
- Swimwear Startup, WaveFit, Raises $15 Million (2024): WaveFit, an emerging swimwear brand focused on performance and style, raised $15 million in Series B funding. The brand plans to use the investment to expand its product offerings, enhance its sustainable material sourcing, and scale operations globally. WaveFit aims to capture a larger share of the market by offering innovative designs and eco-conscious options.
- Tide Swimwear’s $5 Million Series A Funding (2024): Tide Swimwear, a startup known for creating innovative, adjustable swimwear for diverse body types, raised $5 million in Series A funding. The funds will be used to develop new designs and enhance its marketing efforts, particularly through digital channels. Tide Swimwear aims to capture the growing demand for customizable swimwear solutions, which are becoming increasingly popular among health-conscious and body-positive consumers.
Conclusion
Swimwear Statistics – The global swimwear market shows diverse consumption and trade patterns, with countries like the U.S. and France reflecting different consumer preferences based on age and spending habits.
Major exporters like China, Italy, and the European Union lead the market, while the U.S. remains a top importer. Spain also imports strongly from countries like Portugal and Italy.
The introduction of new swimwear styles each month indicates a dynamic market, though challenges such as pollution affecting beaches in Italy may influence future demand. Overall, the market is expected to grow, driven by evolving trends and sustainable options.
FAQs
Seasonal trends, consumer preferences, fashion trends, environmental concerns, and price points influence sales. Demographics like age and ethnicity also play a role in purchasing behavior.
China, Italy, and the European Union are the leading exporters of swimwear worldwide. These regions supply a significant portion of the global market.
One-piece swimsuits, particularly elegant designs, dominate the market, with bikinis and retro-style swimwear also being popular choices.
Purchase frequency varies by region and demographic. In the U.S., many women purchase swimwear annually, while younger age groups tend to buy it more frequently.
Yes, as consumers become more environmentally conscious, there is an increasing demand for sustainable materials in swimwear, such as recycled fabrics.
Discuss your needs with our analyst
Please share your requirements with more details so our analyst can check if they can solve your problem(s)