
Table of Contents
Introduction
Sweetener Statistics: Sweeteners are substances used to add sweetness to food and beverages. They come in various types, including natural sweeteners like stevia and honey, artificial sweeteners such as aspartame and sucralose, and sugar alcohols like xylitol and sorbitol.
These sweeteners are widely used in different products like soft drinks, baked goods, medications, and personal care items.
While natural sweeteners are derived from plants, artificial sweeteners are chemically produced, and sugar alcohols offer reduced calorie options.
Regulations govern their use and labeling to ensure consumer safety and awareness. Understanding sweeteners is crucial for product formulation and compliance with industry standards.
Editor’s Choice
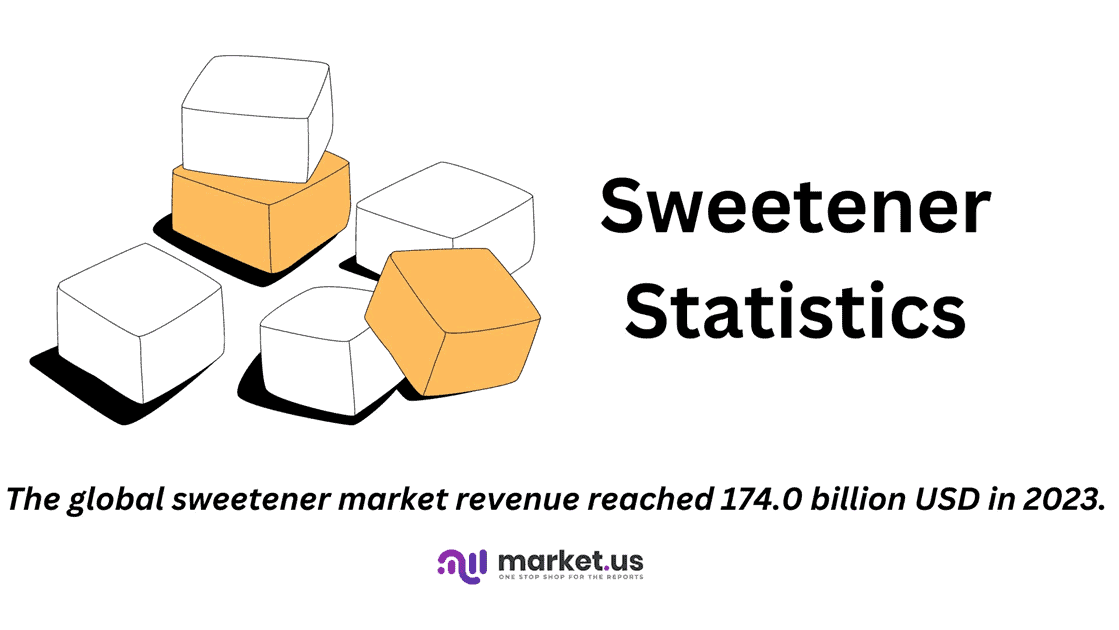
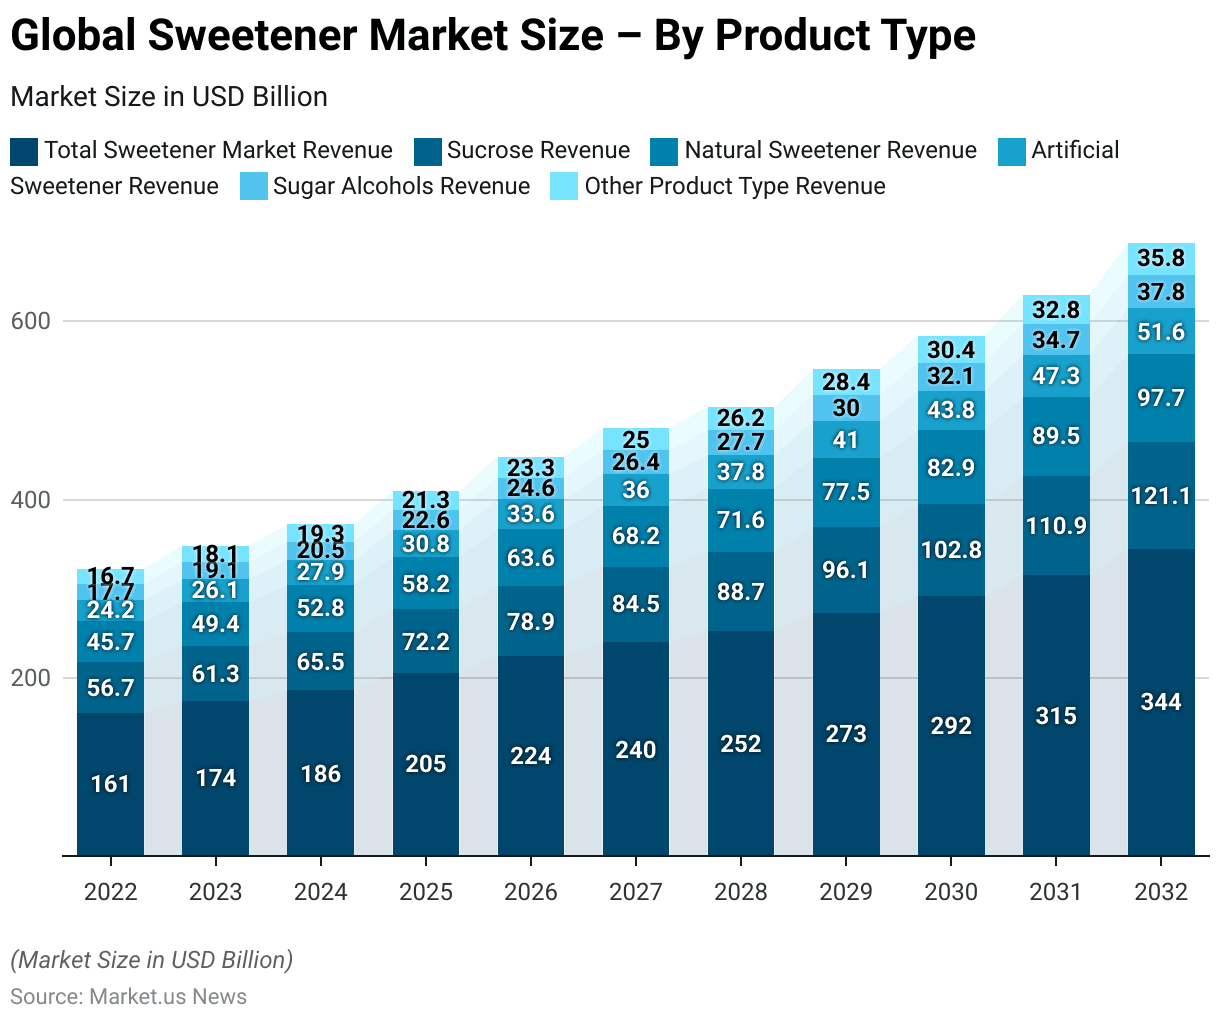
- The global sweetener market revenue reached 174.0 billion USD in 2023.
- Sucrose dominated the market in 2022 with revenues of USD 56.67 billion. Followed by natural sweeteners at USD 45.72 billion and artificial sweeteners at USD 24.15 billion.
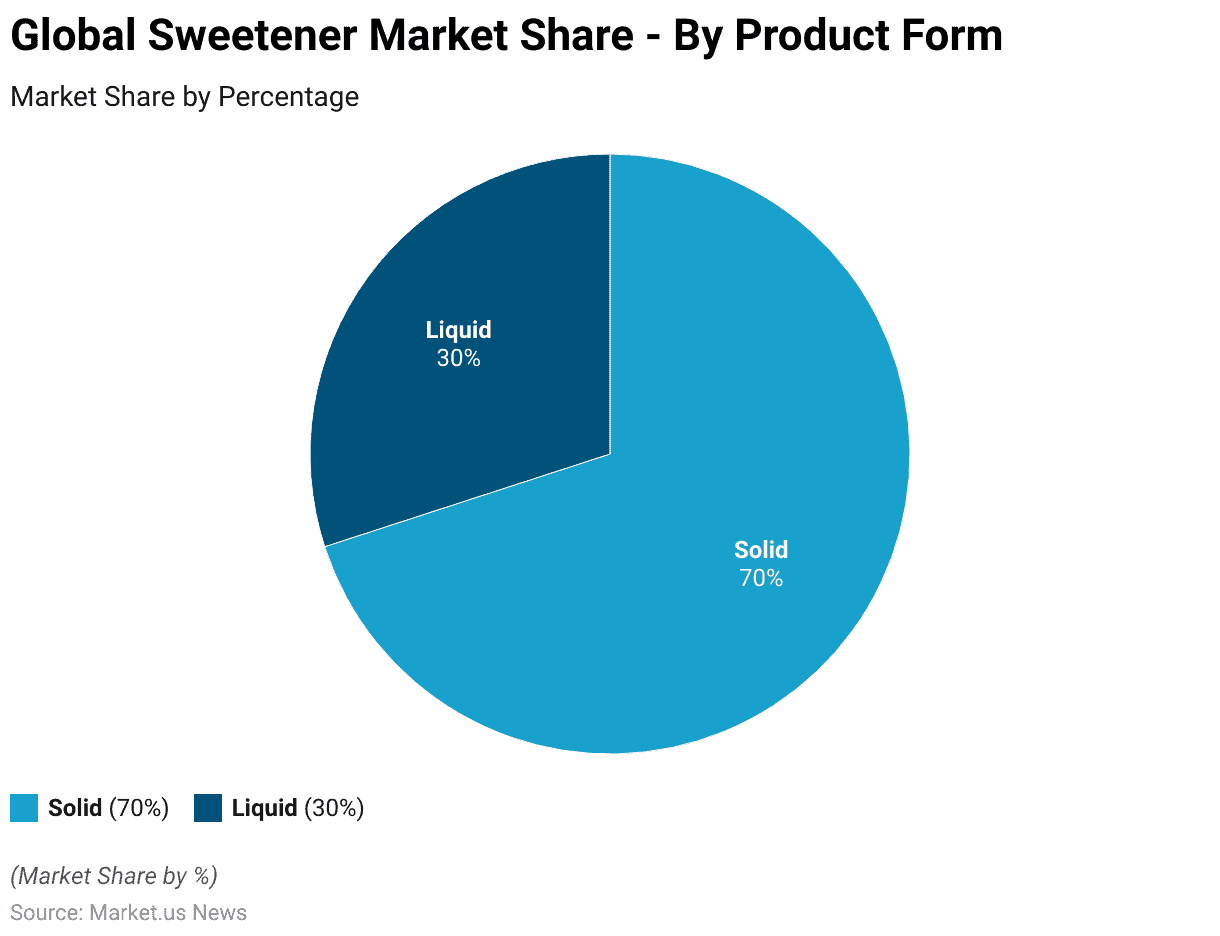
- As of the latest data available, solid sweeteners dominate the market with a substantial market share of 70%.
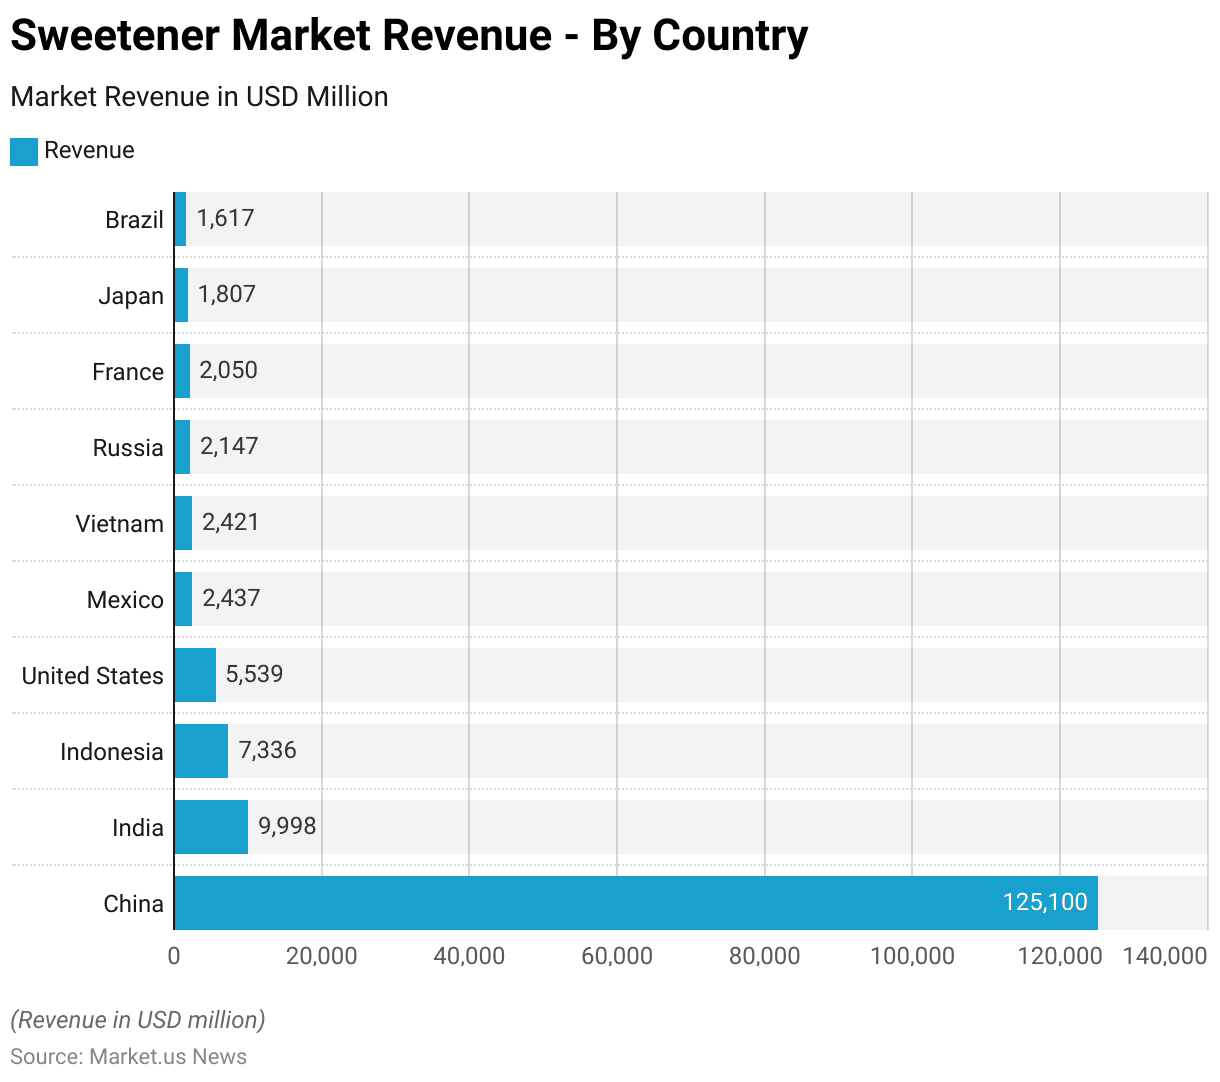
- China, boasting a substantial revenue of USD 125.1 billion, underscores its prominent position in the sweetener industry.
- Advantame stands out as the sweetest among the listed sweeteners, being approximately 20,000 times sweeter than sugar.
- In the United States, the usage of various sugar substitutes among consumers varies. Splenda is the most commonly used, cited by 51.4 million consumers.
- On a scale of 1 to 10, indicating the likelihood of consumption of foods and beverages containing various sweeteners, respondents ranked honey highest with a score of 7.1.
Global Sweetener Market Overview
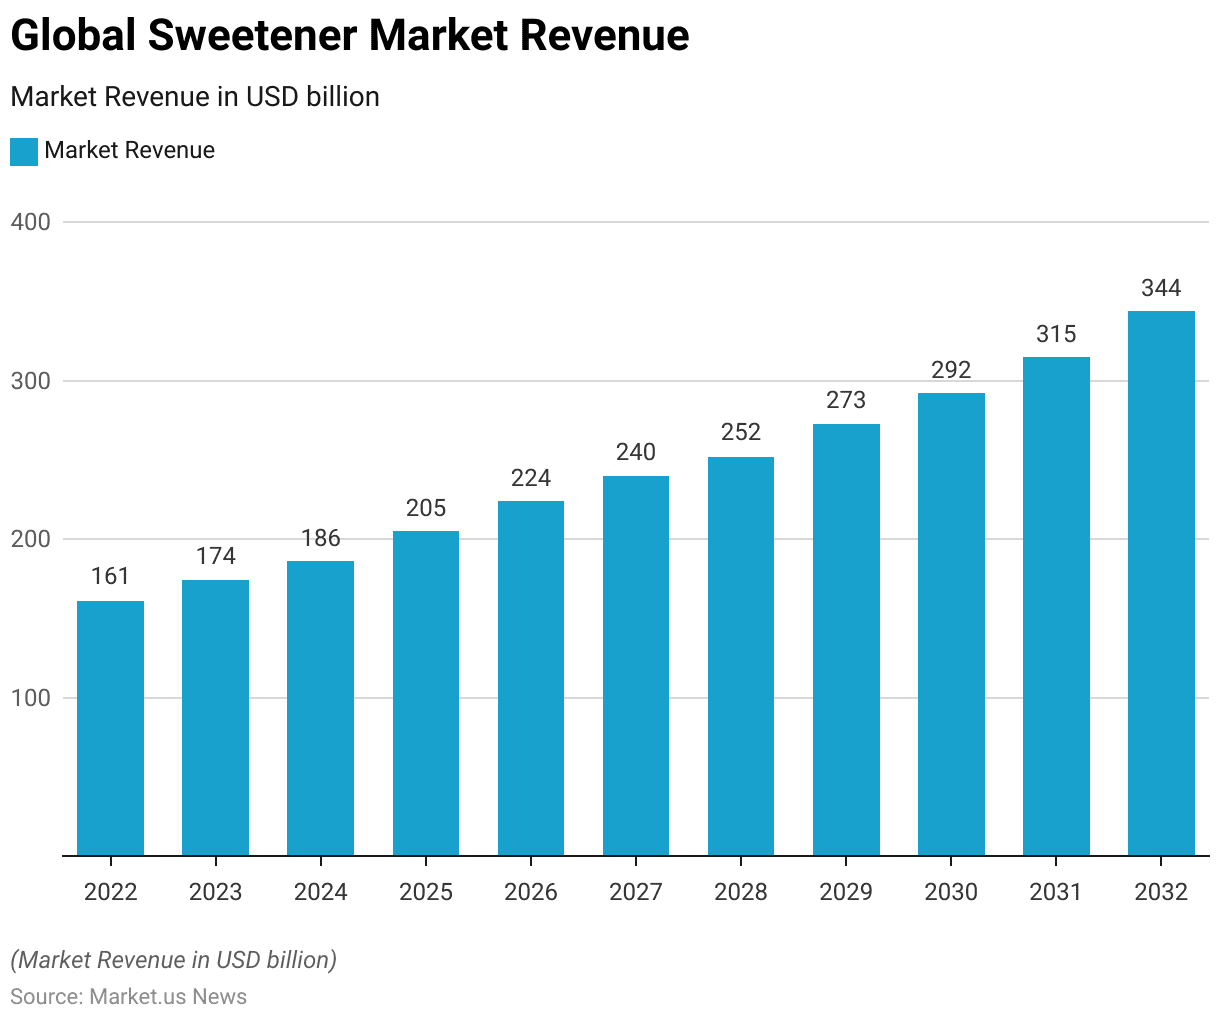
Global Sweetener Market Size Statistics
- The global sweetener market has demonstrated steady revenue growth over the past decade at a CAGR of 8.13%. With a clear upward trajectory projected for the foreseeable future.
- Starting at 161.0 billion USD in 2022, the market saw incremental increases. Reaching 174.0 billion USD in 2023 and further climbing to 186.0 billion USD in 2024.
- The growth trend continued with revenues of 205.0 billion USD in 2025 and 224.0 billion USD in 2026.
- Looking ahead, the market is expected to maintain its upward momentum. With projected revenues of 240.0 billion USD in 2027, 252.0 billion USD in 2028, and 273.0 billion USD in 2029.
- By 2030, the market is forecasted to reach 292.0 billion USD. Followed by significant growth to 315.0 billion USD in 2031 and 344.0 billion USD in 2032.
- This consistent growth trajectory underscores the increasing demand for sweeteners across various industries worldwide.
(Source: Market.us)
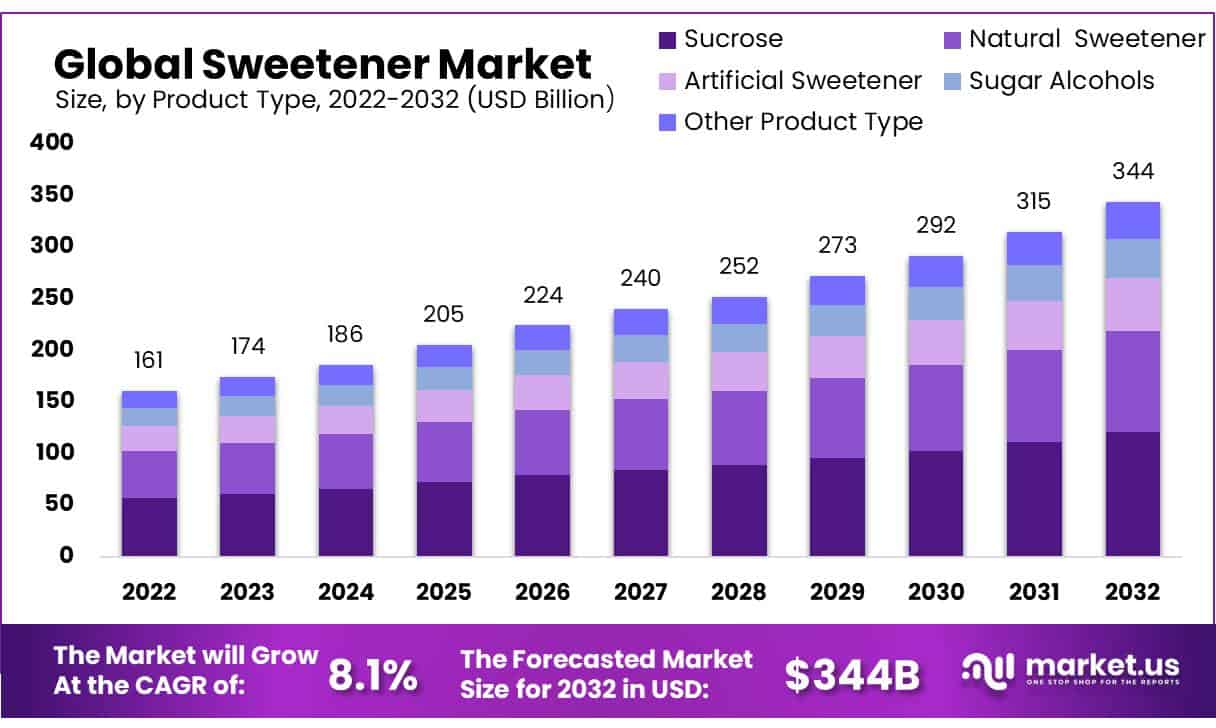
Product Type By Global Sweetener Market Size Statistics
- The global sweetener market demonstrates a consistent upward trajectory, with substantial growth projected over the next decade.
- In 2022, the total sweetener market revenue stood at USD 161.0 billion, comprising various product types.
- Sucrose dominated the market with revenues of USD 56.67 billion. Followed by natural sweeteners at USD 45.72 billion and artificial sweeteners at USD 24.15 billion.
- Additionally, sugar alcohols accounted for USD 17.71 billion, while other product types contributed USD 16.74 billion. By 2032, the market is forecasted to reach USD 344.0 billion, indicating a robust expansion.
- Sucrose is anticipated to maintain its leading position, with revenues expected to reach USD 121.09 billion. Followed by natural sweeteners at USD 97.70 billion and artificial sweeteners at USD 51.60 billion.
- Sugar alcohols and other product types are also poised for significant growth. With revenues projected to reach USD 37.84 billion and USD 35.78 billion, respectively.
- This growth trajectory underscores the evolving consumer preferences toward healthier alternatives and the continued innovation within the sweetener industry.
(Source: Market.us)
Product Form By Global Sweetener Market Share Statistics
- In the sweetener market, product form plays a crucial role in shaping consumer choices and industry trends.
- As of the latest data available, solid sweeteners dominate the market with a substantial market share of 70%. Solid sweeteners are preferred for their convenience, ease of storage, and versatile usage in various food and beverage applications.
- In contrast, liquid sweeteners hold a smaller but significant share of 30%. Liquid sweeteners offer advantages such as easy blending, precise dispensing, and suitability for certain recipes and manufacturing processes.
- Together, solid and liquid sweeteners cater to diverse consumer preferences and contribute to the overall growth and innovation within the sweetener industry.
(Source: Market.us)
Distribution Channel By Global Sweetener Market Share Statistics
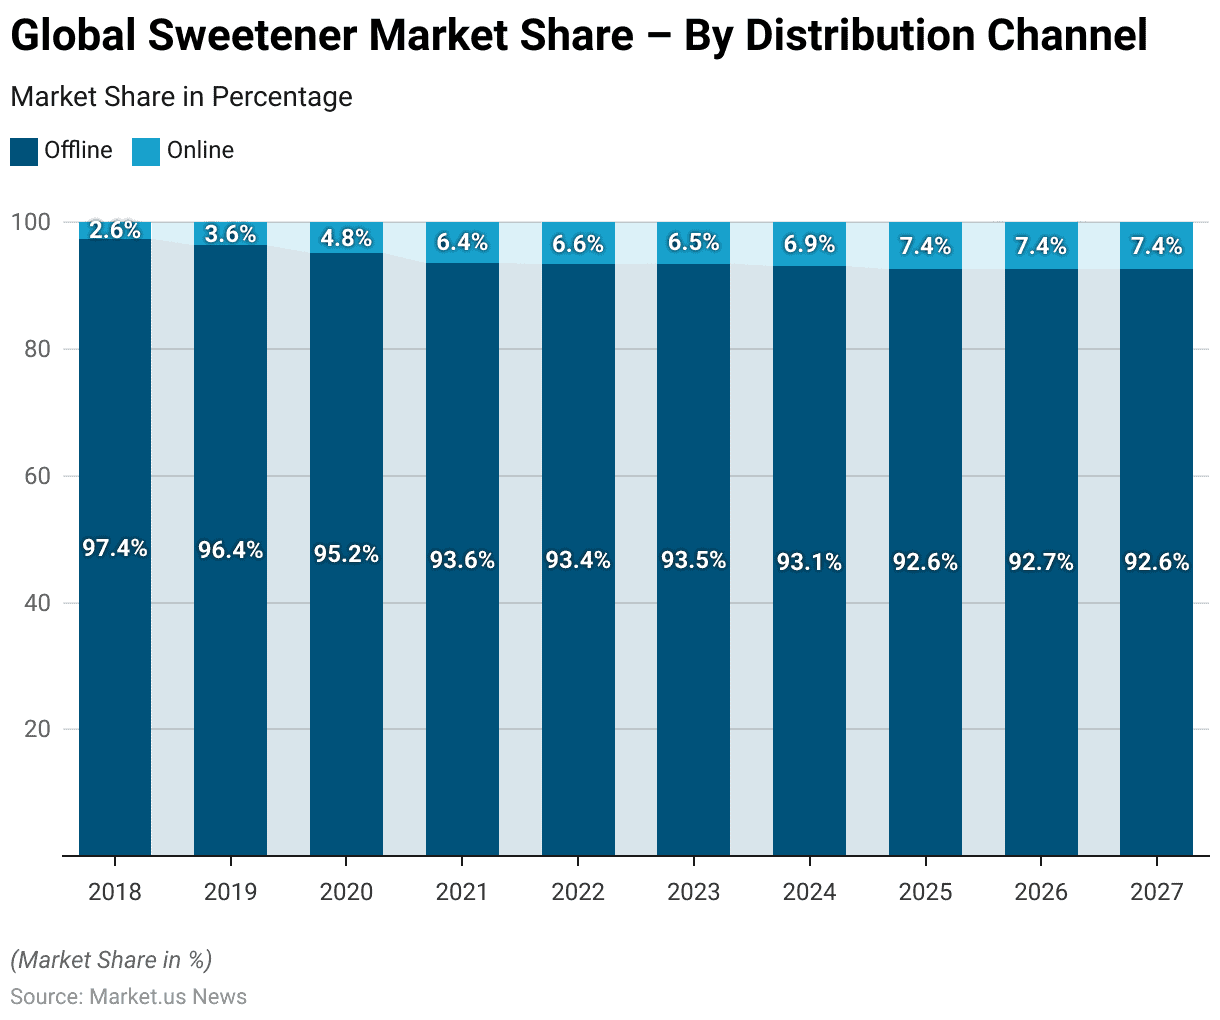
- The distribution channels for the global sweetener market have shown a consistent trend over the past decade, with a gradual shift towards online platforms.
- In 2018, offline channels dominated with a share of 97.4%, while online channels accounted for a mere 2.6%.
- However, the online segment has steadily gained traction, reaching 6.9% by 2024. Conversely, offline channels have experienced a decline, albeit marginal, dropping to 93.1% in the same year.
- Looking ahead, projections indicate a continued but slow decline in offline sales. With a corresponding rise in online market share, potentially reaching 7.4% by 2027.
- This shift reflects evolving consumer preferences toward convenient online shopping experiences. Although offline channels continue to hold a significant majority of the market.
(Source: Statista)
Regional Analysis of the Global Sweetener Market Statistics
- The global sweetener market demonstrates varying revenue distributions across key countries.
- Leading the pack is China, boasting a substantial revenue of USD 125.1 billion, underscoring its prominent position in the industry.
- Following closely behind is India, with a noteworthy revenue of USD 9.998 billion, showcasing its significant contribution to the market.
- Indonesia emerges as another formidable player, with a revenue of USD 7.336 billion. Reflecting its growing presence in the sweetener sector.
- The United States, with a revenue of USD 5.539 billion. Maintains a solid foothold in the market, indicative of its enduring demand for sweetening agents.
- Mexico and Vietnam follow suit, each contributing USD 2.437 billion and USD 2.421 billion, respectively, to the overall revenue pool.
- Meanwhile, Russia, France, Japan, and Brazil round out the list with revenues ranging from USD 2.147 billion to USD 1.617 billion. Highlighting their significant but slightly lesser impact on the global sweetener market.
- This diverse landscape underscores the dynamic nature of the sweetener industry, with various countries playing pivotal roles in shaping its trajectory.
(Source: Statista)
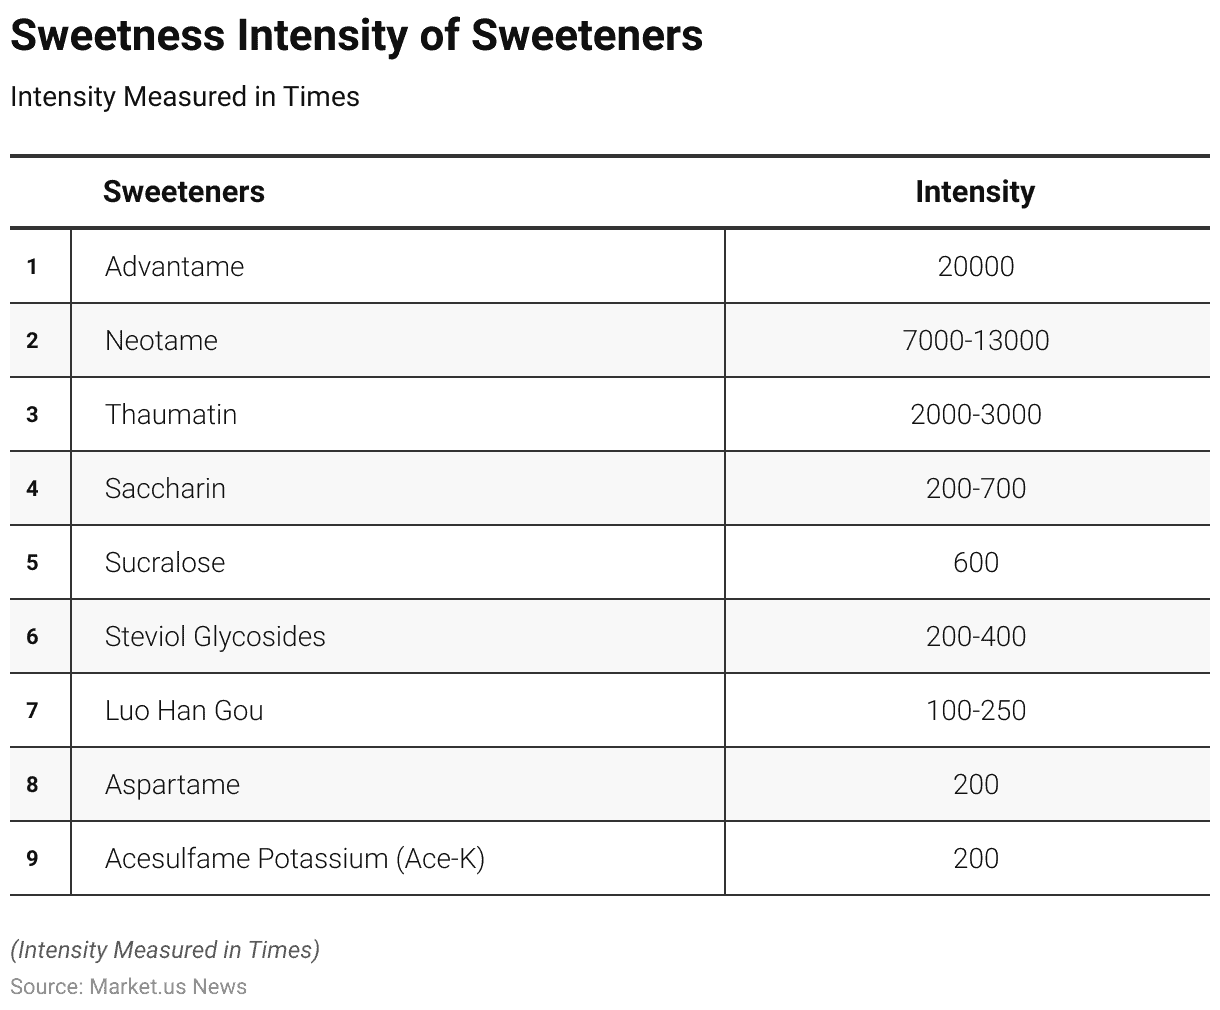
Sweetness Intensity of Sweeteners
- Sweeteners vary in their sweetness intensity compared to table sugar, measured in times sweeter.
- Advantame stands out as the sweetest among the listed sweeteners, being approximately 20,000 times sweeter than sugar.
- Neotame follows with a range of 7,000 to 13,000 times sweeter, while thaumatin falls between 2,000 to 3,000 times sweeter.
- Saccharin ranges from 200 to 700 times sweeter, while sucralose is approximately 600 times sweeter.
- Steviol glycosides exhibit a sweetness intensity of 200 to 400 times sweeter, while Luo Han Gou ranges from 100 to 250 times sweeter.
- Aspartame and acesulfame potassium (Ace-K) both share a sweetness intensity of 200 times sweeter than sugar.
- These variations in sweetness intensity influence the usage and formulation of sweeteners in various food and beverage products, catering to different consumer preferences and dietary sugar needs.
(Source: Food and Drug Administration)
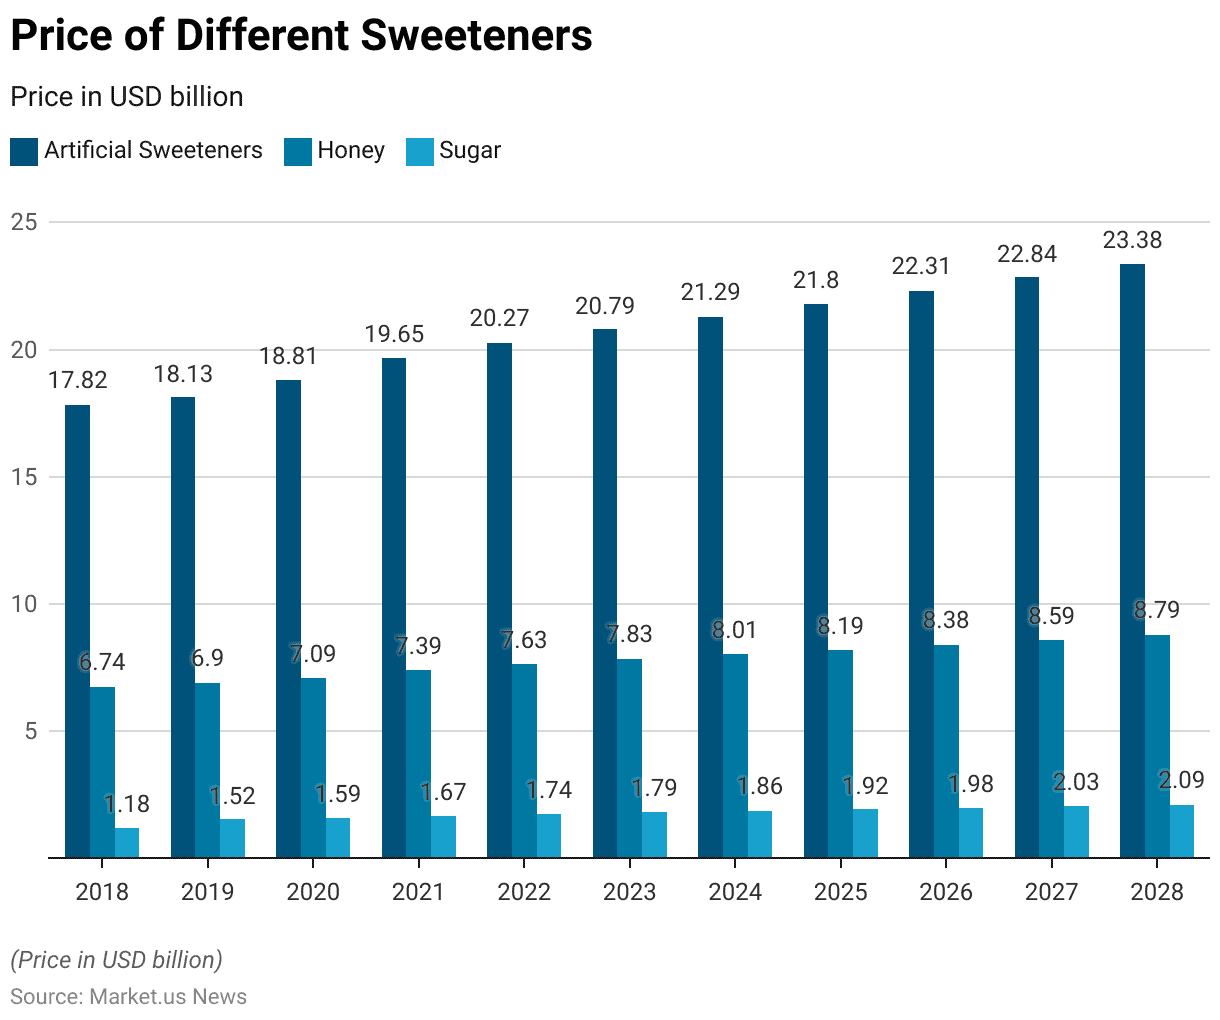
Price of Sweeteners
- The price per unit of sweeteners, measured in USD, demonstrates varying trends across different types over the years.
- Artificial sweeteners exhibited a steady increase from 17.82 USD in 2018 to 22.84 USD in 2027, reflecting a consistent upward trajectory.
- Similarly, honey saw a gradual rise in price from 6.74 USD in 2018 to 8.59 USD in 2027.
- In contrast, sugar displayed a comparatively stable pattern, with minimal fluctuations, starting at 1.18 USD in 2018 and reaching 2.03 USD in 2027.
- These figures indicate the evolving market dynamics and consumer preferences, with artificial sweeteners and honey experiencing more pronounced shifts in pricing compared to the relatively steady trajectory observed for sugar.
(Source: Statista)
Well-known Low-Calorie Sweetener Statistics
- Low-calorie sweeteners, also known as artificial sweeteners, offer a sugar-free alternative for individuals seeking to reduce calorie intake or manage blood sugar levels.
- Common brand names include Equal®, NutraSweet®, and Sugar Twin® for aspartame, Sunett® and Sweet One® for Acesulfame-K, and Sweet’N Low®, Sweet Twin®, and Necta Sweet® for saccharin.
- These sweeteners are significantly sweeter than sugar, with aspartame, Acesulfame-K, and saccharin being approximately 200 times sweeter, sucralose 600 times sweeter, and neotame 7,000 to 13,000 times sweeter.
- Advantame, with no specific brand names, is the sweetest, being approximately 20,000 times sweeter than sugar.
- The acceptable daily intake, represented by the maximum number of tabletop sweetener packets per day, varies for each sweetener, ranging from 23 packets for aspartame, Acesulfame-K, and sucralose to 45 packets for saccharin and 4,920 packets for advantage.
- These parameters inform consumer choices and regulatory guidelines regarding the usage of low-calorie sweeteners in food and beverage products.
(Source: Harvard T.H. Chan School of Public Health)
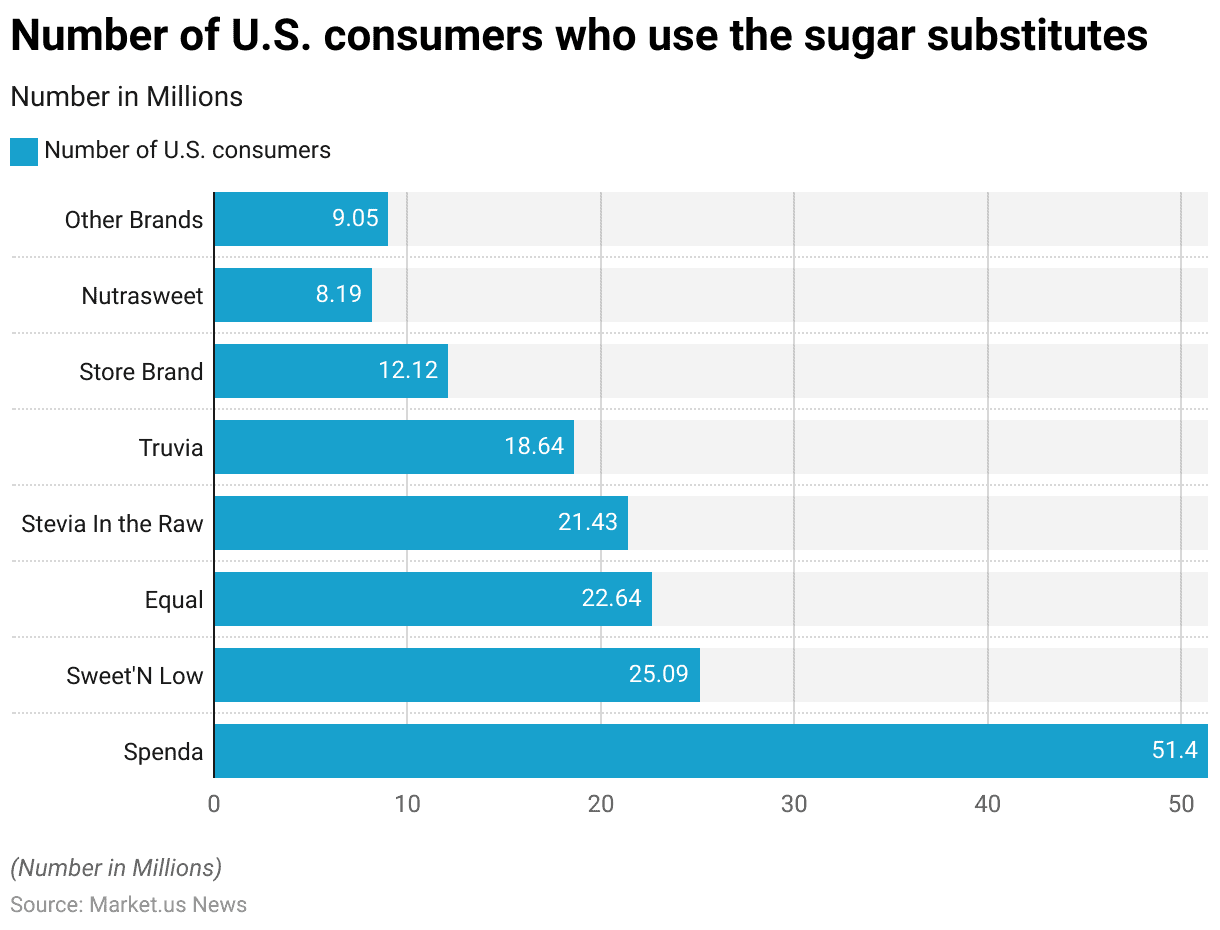
Popular Sugar Substitutes
- In the United States, the usage of various sugar substitutes among consumers varies, with Splenda being the most commonly used, cited by 51.4 million consumers.
- Following closely behind is Sweet’N Low, preferred by 25.09 million consumers, and Equal, favored by 22.64 million consumers.
- Stevia In the Raw and Truvia are also popular choices, with 21.43 million and 18.64 million consumers, respectively.
- Store brands represent a significant portion of the market, with 12.12 million consumers opting for these alternatives.
- 8.19 million consumers utilize Nutrasweet, while other brands collectively account for 9.05 million consumers.
- These figures reflect the diverse preferences among U.S. consumers when it comes to selecting sugar substitutes, influenced by factors such as taste, availability, and perceived health benefits.
(Source: Statista)
Consumer Preferences
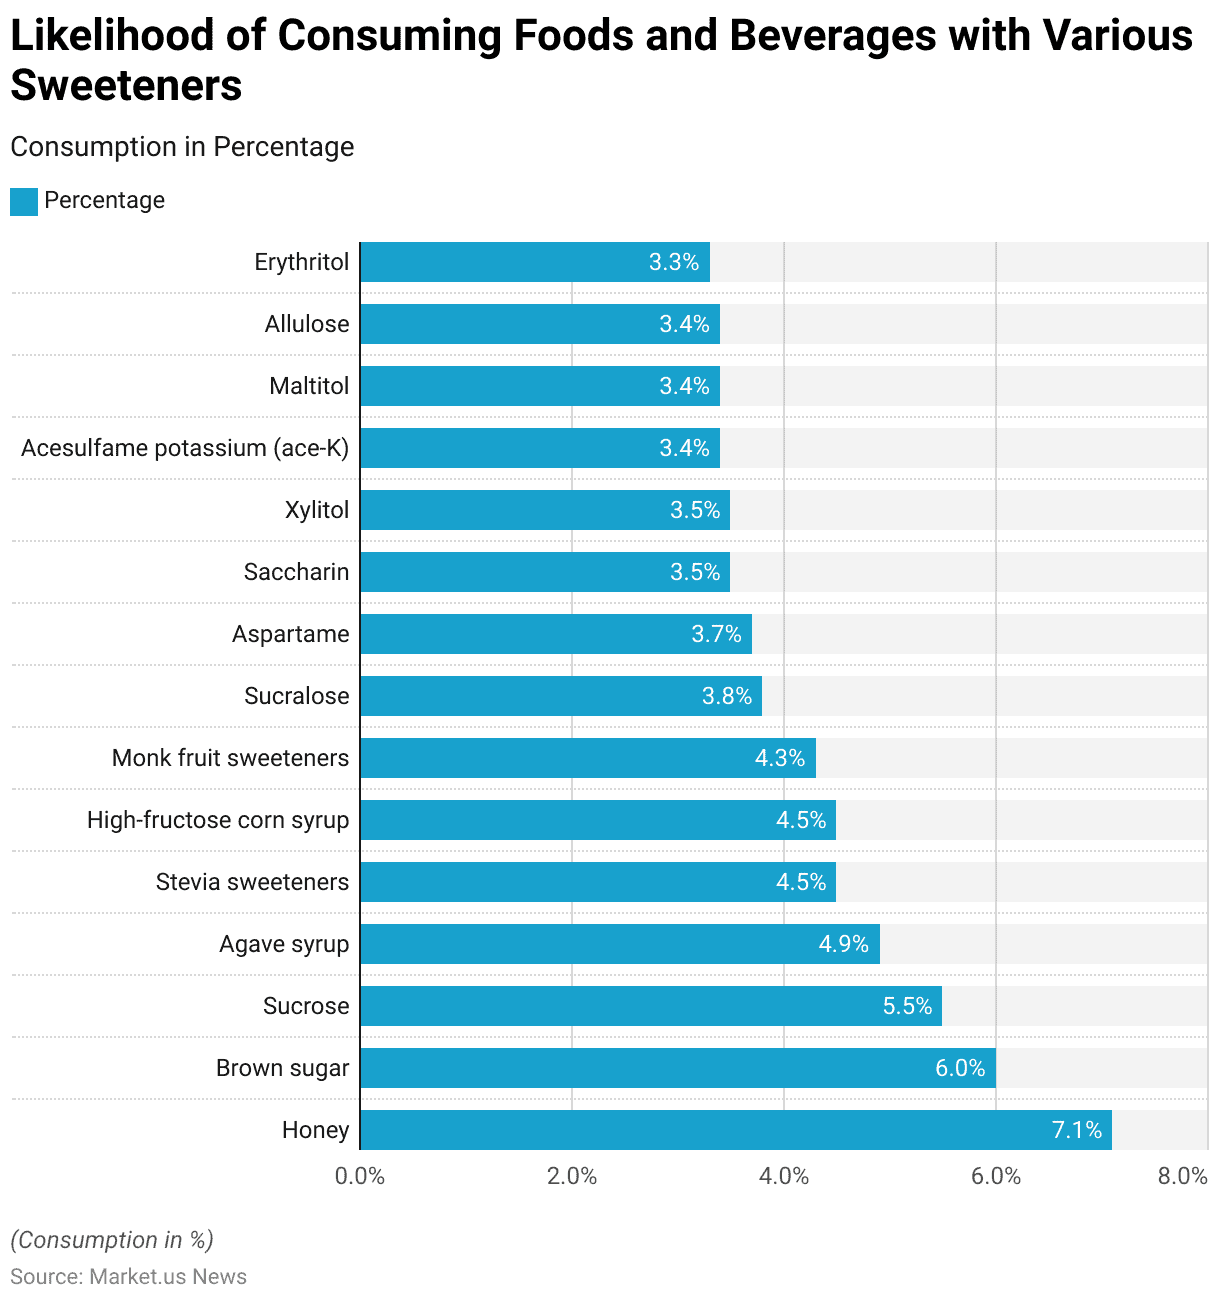
Likelihood of Consuming Foods and Beverages with Various Sweetener Statistics
- On a scale of 1 to 10, indicating the likelihood of consumption of foods and beverages containing various sweeteners, respondents ranked honey highest with a score of 7.1, followed by brown sugar at 6 and sucrose at 5.5.
- Agave syrup received a rating of 4.9, while stevia sweeteners and high-fructose corn syrup both scored 4.5. Monk fruit sweeteners were slightly lower at 4.3.
- Artificial sweeteners such as sucralose, aspartame, and saccharin garnered scores of 3.8, 3.7, and 3.5, respectively, indicating a lower likelihood of consumption compared to natural sweeteners.
- Xylitol, acesulfame potassium (ace-K), maltitol, and allulose all received ratings of 3.4, while erythritol was slightly lower at 3.3.
- These rankings provide insight into consumer preferences and attitudes towards different sweeteners, with natural options generally receiving higher scores than artificial alternatives.
(Source: International Food Information Council)
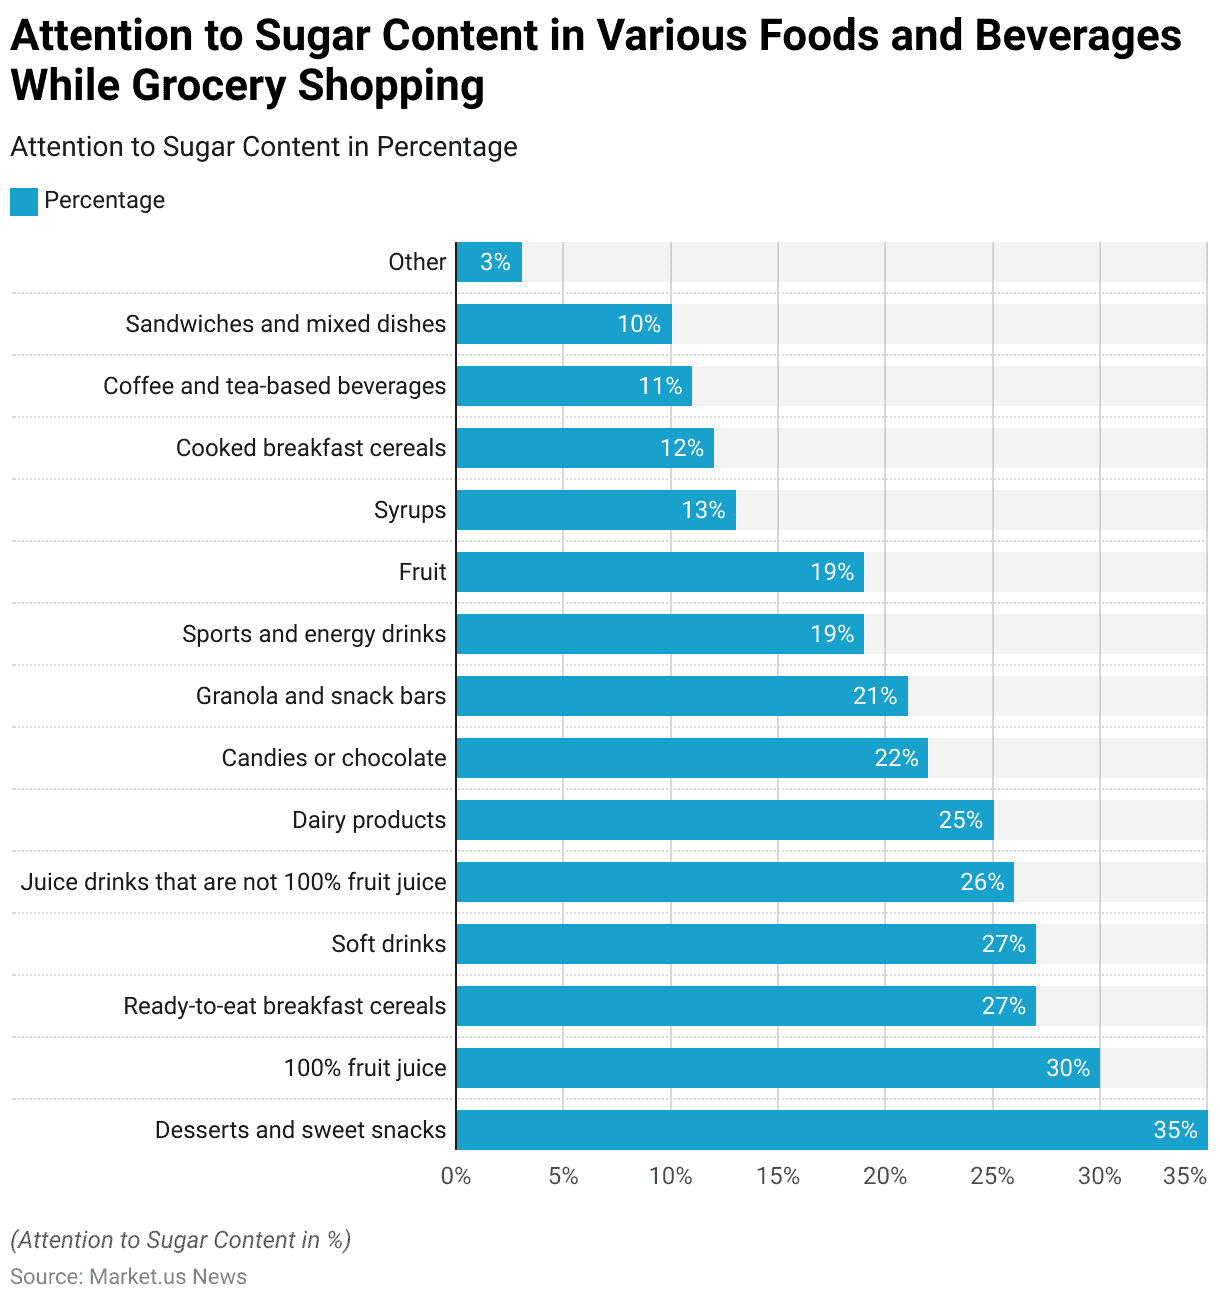
Attention to Sugar Content in Various Foods and Beverages While Grocery Shopping
- When grocery shopping, consumers pay the most attention to the sugar content in certain types of foods and beverages.
- Among these, desserts and sweet snacks are the top priority for 35% of shoppers, followed closely by 100% fruit juice at 30%.
- Ready-to-eat breakfast cereals and soft drinks tie for the next spot, with 27% of shoppers focusing on their sugar content.
- Additionally, juice drinks that are not 100% fruit juice and dairy products are also significant considerations, with 26% and 25% of shoppers, respectively, paying attention to their sugar content.
- Candies or chocolate, granola and snack bars, sports and energy drinks, and fruits are also areas of concern for a considerable portion of shoppers, ranging from 19% to 22%.
- Syrups, cooked breakfast cereals, coffee, and tea-based beverages, sandwiches and mixed dishes, and other items are of relatively lower concern but still noted by a smaller percentage of shoppers, according to the survey data.
(Source: International Food Information Council)
Trust in Information Sources about Health Effects of Sugar and Low-Calorie Sweetener Statistics
- Trust in various sources that provide information about the health effects of consuming sugar and low-calorie sweeteners varies among different demographics.
- Health-focused websites are generally trusted by 18% of respondents, while registered dietitians featured in the media are considered trustworthy by 13%.
- Fitness professionals also hold credibility for 13% of respondents, similar to friends and family.
- Meanwhile, the website or social media accounts of a food or beverage brand are trusted by 8% of respondents, and bloggers or social media influencers without medical or nutrition degrees are trusted by 6%.
- When considering respondents who are parents or caregivers of children under 18 years old, trust in registered dietitians in the media increases to 20%, and fitness professionals to 25%.
- Conversely, trust in health-focused websites decreases slightly to 16%, and trust in friends and family decreases to 11%.
- For respondents not in this demographic category, trust in health-focused websites, registered dietitians in the media, and fitness professionals decreases to 13%, 10%, and 8%, respectively.
- Trust in friends and family remains relatively stable at 11%, while trust in the website or social media accounts of a food or beverage brand decreases to 5%, and trust in bloggers or social media influencers without medical or nutrition degrees decreases to 4%.
(Source: International Food Information Council)
Regulatory Aspects of Sweetener Statistics
- The FDA has regulated aspartame as a food additive since 1974, initially approving it for use as a tabletop sweetener, in chewing gum, and certain food bases such as cold breakfast cereals.
- Over time, the FDA expanded its approval to include additional uses, with the most recent approval in 1996 allowing aspartame to be used as a general-purpose sweetener.
- Similarly, the FDA has evaluated numerous notices regarding the Generally Recognized as Safe (GRAS) status of high-purity steviol glycosides, including Stevioside, Rebaudioside A (Reb A), Rebaudioside D, and mixtures containing these components.
- The FDA allows the use of sugar alcohols as sugar substitutes, which vary in sweetness from 25% to 100% compared to sugar.
- The FDA bans the use of cyclamates and their salts in the United States. Additionally, whole-leaf and crude extracts of stevia are under an Import Alert by the FDA.
(Source: FDA)
Recent Developments
Acquisitions and Mergers:
- Acme Sweeteners acquired Sweet Solutions Inc. for $50 million, consolidating its market presence and expanding its product portfolio.
- Splenda Corporation merged with SugarCo, creating a formidable entity with combined revenues projected to exceed $1.5 billion by the end of the fiscal year.
New Product Launches:
- SteviaX introduced a new line of zero-calorie sweeteners targeting health-conscious consumers, anticipating a 20% increase in market share within the next quarter.
- SweetBliss launched a natural sweetener derived from monk fruit, tapping into the growing demand for alternative sweeteners with a projected 30% sales growth in the first year.
Funding Rounds:
- Truvia Enterprises secured $30 million in Series B funding led by a Venture Capital Firm, fueling expansion efforts into new geographical markets and product diversification.
- PureSweet Inc. raised $15 million in a seed round led by Angel Investors Group to accelerate research and development for innovative sugar substitutes, aiming for a 50% reduction in production costs within two years.
Consumer Trends:
- Health-conscious consumer preferences continued to drive the demand for natural sweeteners, with sales of stevia-based products increasing by 15% compared to the previous year.
- Low-calorie and zero-calorie sweeteners remained popular choices among diabetic food and weight-conscious individuals, contributing to the steady growth of the segment by 8% year-on-year.
Regulatory Landscape:
- Regulatory bodies implemented stricter regulations on the use of artificial sweeteners in food and beverage products, prompting manufacturers to focus on natural alternatives to meet consumer demands for cleaner labels and healthier options.
Conclusion
Sweetener Statistics – In conclusion, the sweetener market presents a diverse array of options, ranging from natural alternatives like honey and stevia to artificial substitutes such as aspartame and sucralose.
These sweeteners cater to various consumer preferences and dietary needs. Offering alternatives for those seeking to reduce sugar intake or manage health conditions like diabetes.
The regulatory landscape, overseen by entities like the FDA, plays a crucial role in ensuring the safety and labeling accuracy of sweetener products.
As consumer awareness of health and wellness continues to grow. The demand for low-calorie and natural sweeteners is expected to drive innovation and market growth in the coming years.
However, it’s essential to remain vigilant about potential health concerns associated with certain sweeteners and to make informed choices based on individual dietary requirements and preferences.
FAQs
Sweeteners are substances used to add sweetness to foods and beverages. They can be natural, such as honey and stevia, or artificial, like aspartame and sucralose.
Most sweeteners approved for use by regulatory agencies like the FDA are considered safe when consumed in moderation. However, some individuals may have sensitivities or allergies to certain sweeteners.
The calorie content of sweeteners varies. Natural sweeteners like honey and maple syrup contain calories. Many artificial sweeteners have little to no calories and are often used in low-calorie or sugar-free products.
Yes, many sweeteners can be used in cooking and baking as substitutes for sugar. However, the sweetness level and properties of each sweetener may differ, so adjustments may be needed in recipes.
Some studies have raised concerns about the health effects of certain artificial sweeteners. However regulatory agencies have deemed them safe for consumption within recommended limits. It’s essential to consult with healthcare professionals if you have specific health concerns.
Discuss your needs with our analyst
Please share your requirements with more details so our analyst can check if they can solve your problem(s)