
Introduction
According to Laptop Statistics, Laptops are essential devices in today’s computing landscape, combining portability with robust functionality.
Key components include the processor, memory (RAM), and storage options like SSDs or HDDs. Which are crucial for performance and data storage.
Displays vary in size and resolution, often featuring touch capabilities for enhanced interaction. Battery life supports mobility, while ports facilitate connectivity with peripherals and external displays.
Laptops are categorized into ultraportables for maximum mobility, gaming laptops for high-performance needs, and business laptops prioritizing durability and security.
Current trends highlight advancements in performance, security features, and sustainability. Reflecting ongoing innovations in design and functionality for diverse user requirements.
Editor’s Choice
- The global laptop market revenue reached USD 170.0 billion in 2023.
- By 2032, the market is expected to reach USD 247.7 billion. With traditional laptops generating USD 166.0 billion and 2-in-1 laptops USD 81.7 billion.
- The distribution of market shares in the global laptop market by screen size reveals distinct consumer preferences. Laptops with screen sizes up to 10.9 inches hold an 18% market share.
- The global laptop market is dominated by several key manufacturers, each holding a significant market share. Apple leads with a 17% market share.
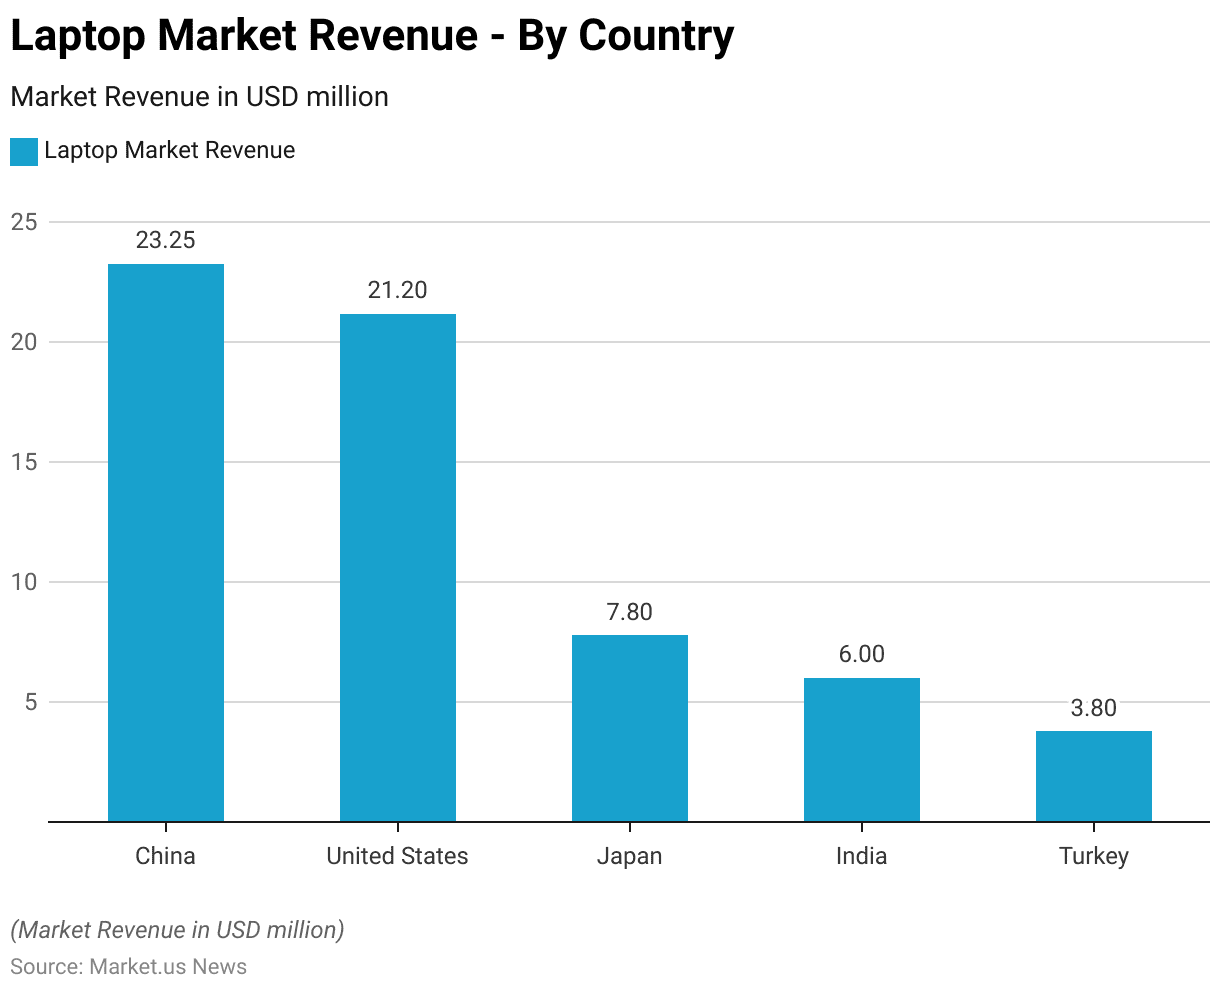
- The laptop market revenue across various countries highlights the significant contributions from several key markets. China leads with a revenue of USD 23.25 million.
- Among individuals below 30 years, 29% prefer Lenovo, 38.10% opt for HCL, 11.40% choose Dell, 17.60% select HP, and 3.80% go for other brands.
- In India, stringent import restrictions have been imposed to boost local manufacturing. They are requiring firms to obtain government permission before importing laptops. However, basic customs duties remain zero due to commitments under the Information Technology Agreement 1997.

Laptop Market Overview
Global Laptop Market Size
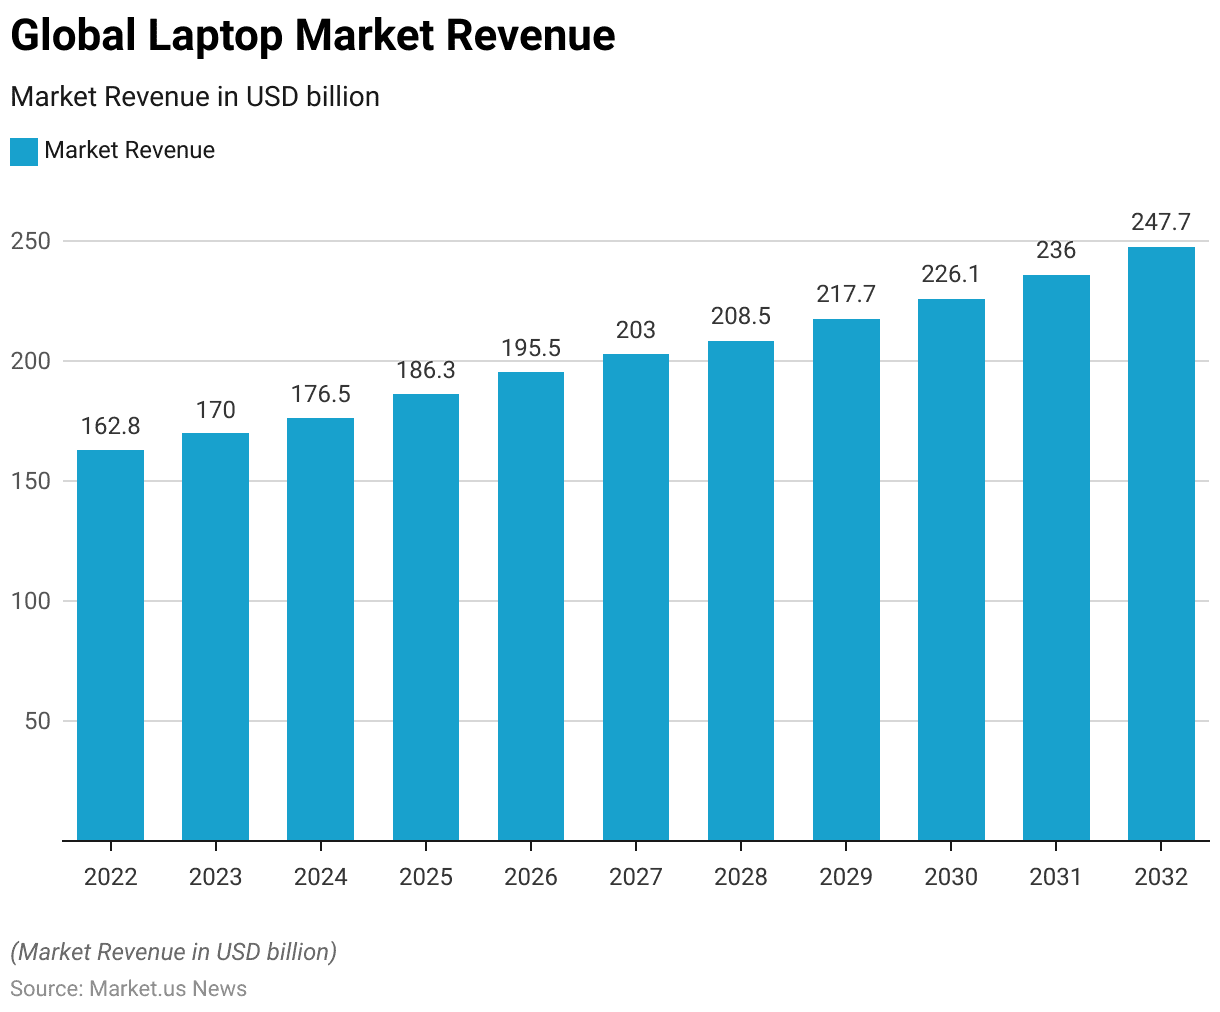
- The global laptop market has exhibited a steady growth trajectory over the past decade at a CAGR of 4.4%, with revenue figures reflecting this upward trend.
- In 2022, the market generated USD 162.8 billion, which increased to USD 170.0 billion in 2023.
- Looking ahead, the forecast for 2031 suggests a revenue of USD 236.0 billion. Culminating in an estimated USD 247.7 billion by 2032.
Global Laptop Market Size – By Type
- The global laptop market, segmented by type, has demonstrated significant growth in both traditional and 2-in-1 laptop categories.
- In 2022, the total market revenue was USD 162.8 billion. Traditional laptops contribute USD 109.1 billion and 2-in-1 laptops account for USD 53.7 billion.
- By 2032, the market is expected to reach USD 247.7 billion. With traditional laptops generating USD 166.0 billion and 2-in-1 laptops USD 81.7 billion.

Laptop Market Share – By Screen Size
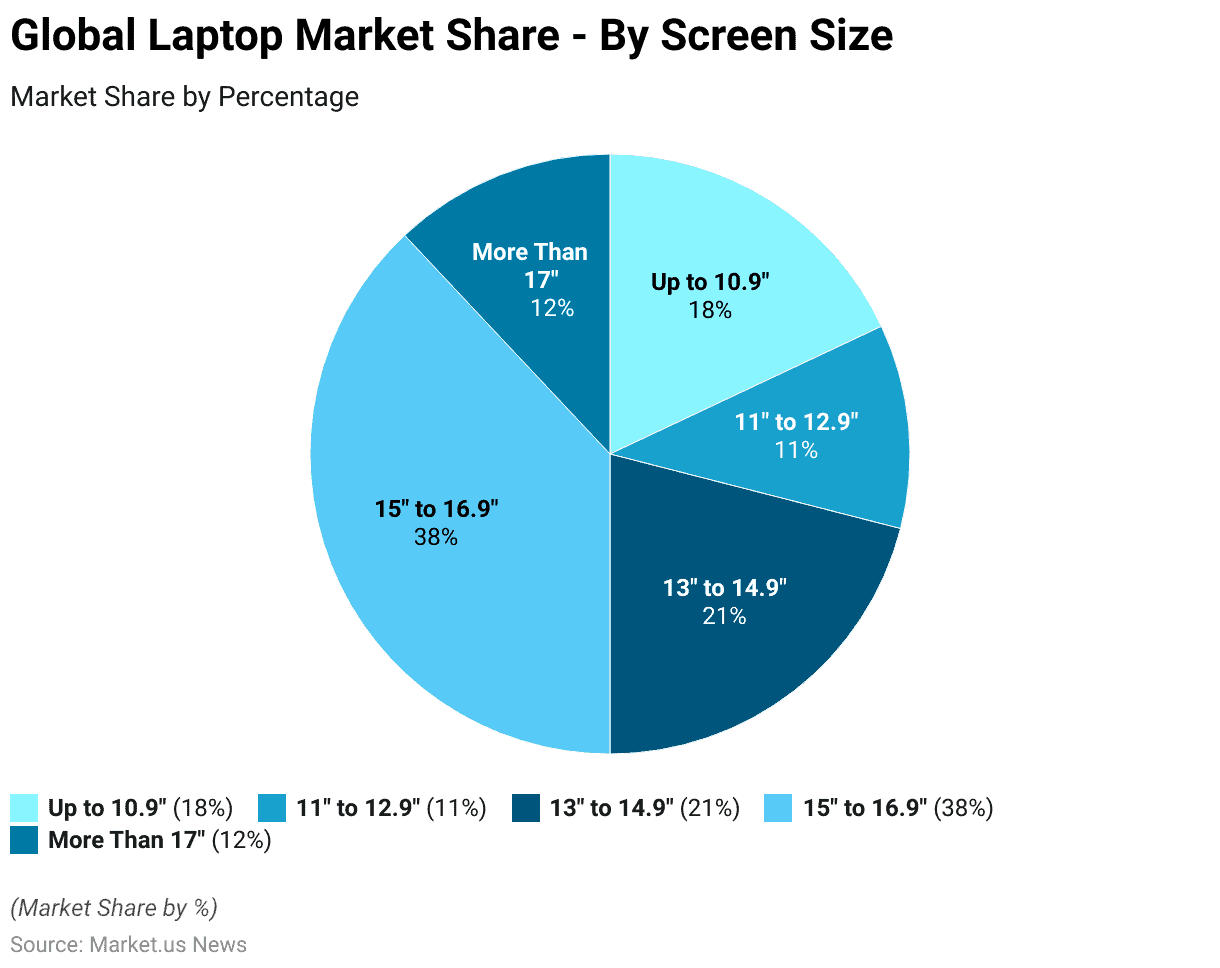
- The distribution of market shares in the global laptop market by screen size reveals distinct consumer preferences.
- Laptops with screen sizes up to 10.9 inches hold an 18% market share. While those in the 11 to 12.9-inch range account for 11% of the market.
- The 13 to 14.9-inch category captures a 21% share, indicating significant demand for moderately sized laptops.
- The largest segment belongs to laptops with screen sizes between 15 and 16.9 inches. Which dominates the market with a 38% share.
- Laptops with screens larger than 17 inches constitute the remaining 12% of the market.
Laptop Market Share – By Operating System
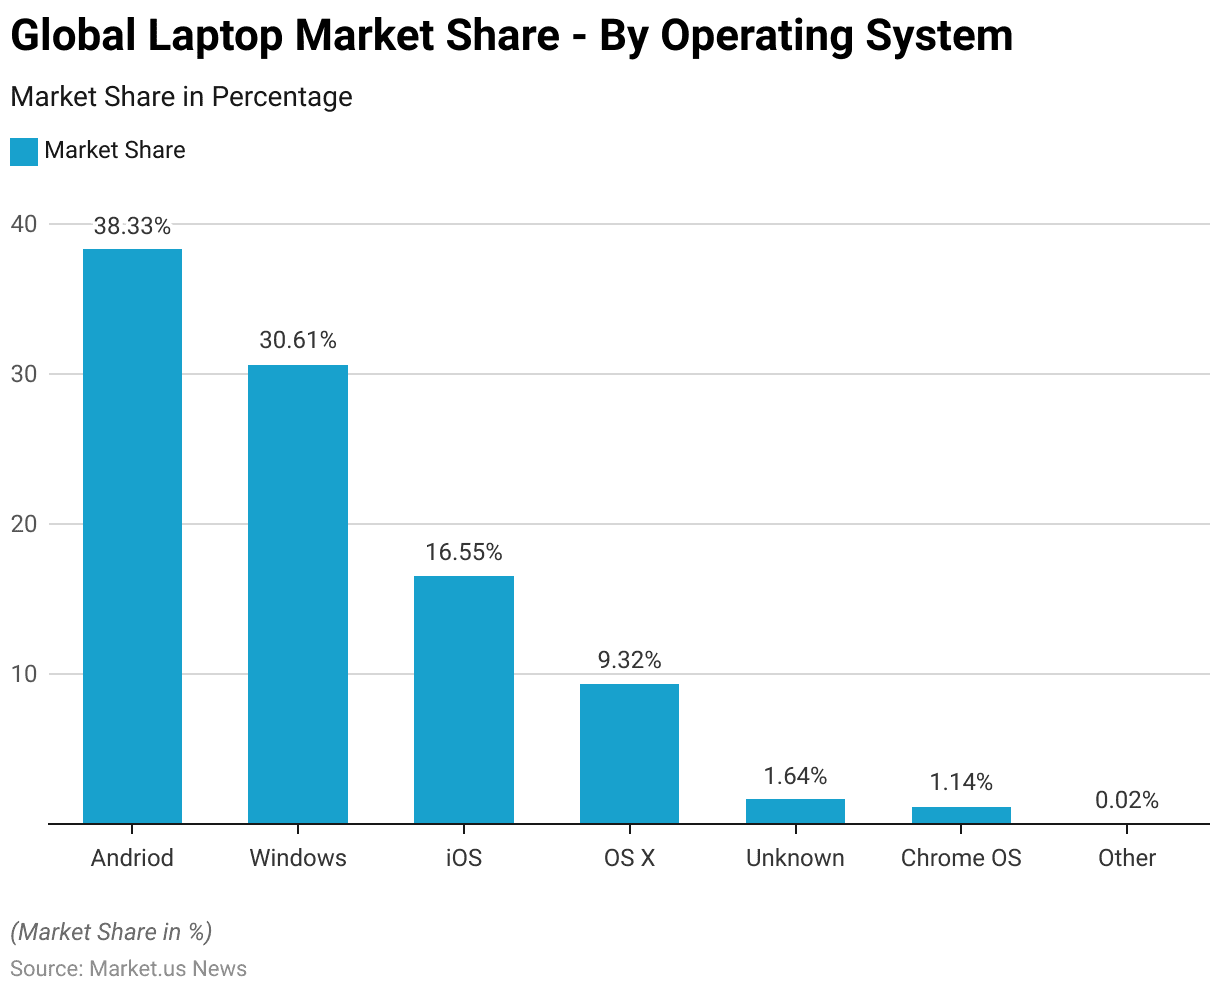
- As of November 2023, the market shares for operating systems show a diverse landscape.
- Android leads with a commanding 38.33% share, followed by Windows, which holds 30.61% of the market.
- iOS accounts for 16.55%, while OS X comprises 9.32% of the market share.
- Operating systems classified as “Unknown” represent 1.64%, and Chrome OS has a 1.14% share.
- Other operating systems collectively make up a negligible 0.02% of the market.
Regional Analysis of Global Laptop Market
- The laptop market revenue across various countries highlights the significant contributions from several key markets.
- China leads with a revenue of USD 23.25 million, followed closely by the United States, which generates USD 21.2 million.
- Japan ranks third with a market revenue of USD 7.8 million.
- India also shows substantial market activity with a revenue of USD 6 million.
- Meanwhile, Turkey’s laptop market revenue stands at USD 3.8 million.
Revenue Generation Through Laptops
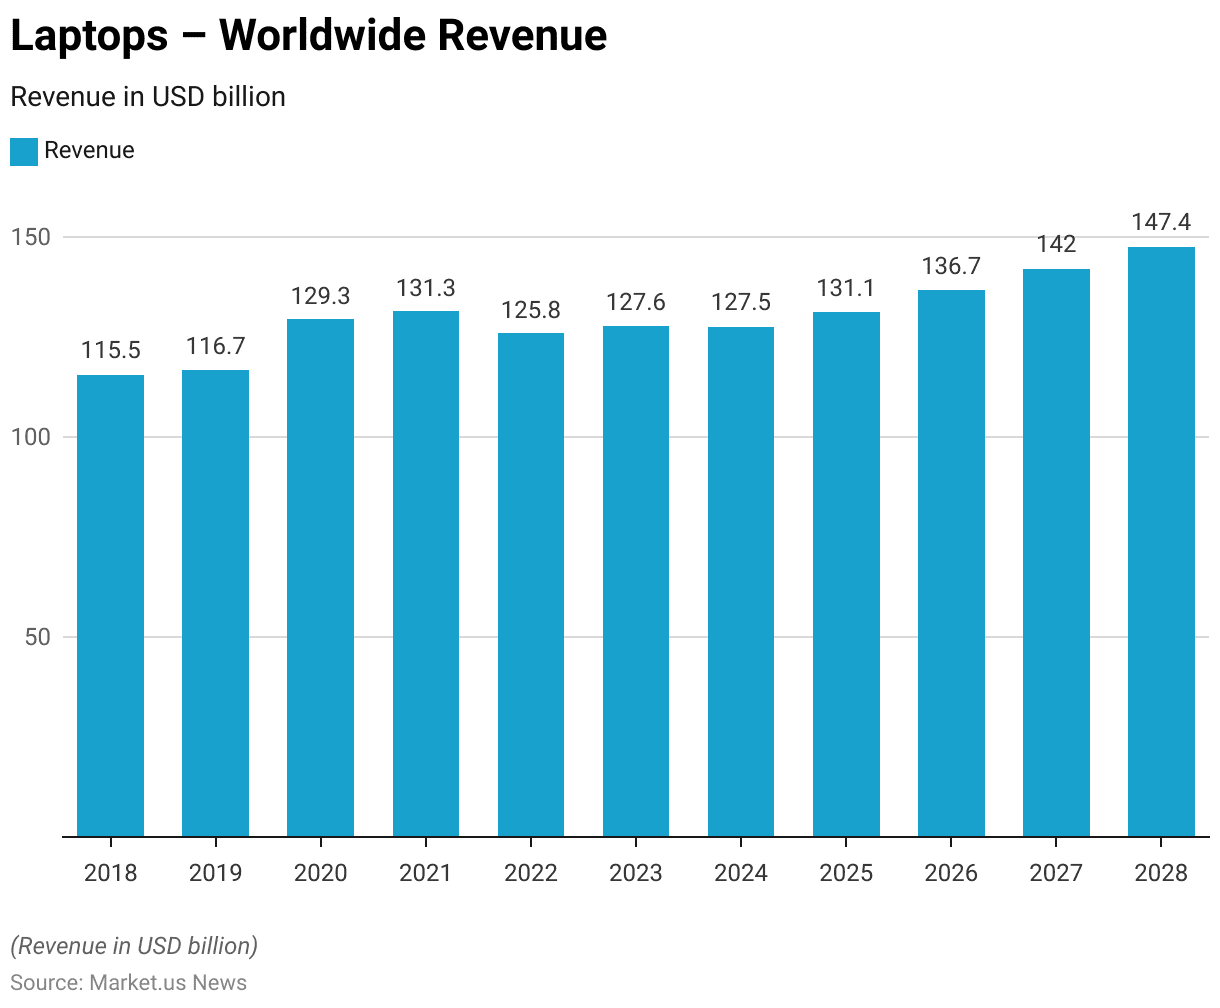
Laptops – Worldwide Revenue
- The worldwide revenue for laptops has experienced fluctuating growth over the past decade.
- In 2018, the global laptop market generated USD 115.5 billion, which slightly increased to USD 116.7 billion in 2019.
- Projections indicate growth resuming in subsequent years, with revenue expected to reach USD 131.1 billion in 2025, USD 136.7 billion in 2026, USD 142 billion in 2027, and USD 147.4 billion by 2028.
Laptop Production and Manufacturing Statistics
Global Production Volume and Volume Growth
- The worldwide volume of laptops sold has exhibited a notable growth pattern over recent years.
- In 2018, the volume stood at 165.8 million pieces, which increased to 170.3 million pieces in 2019.
- Continued growth is anticipated, with the volume expected to climb to 193.6 million pieces in 2025, 197.3 million pieces in 2026, 202.4 million pieces in 2027, and 207.1 million pieces by 2028.
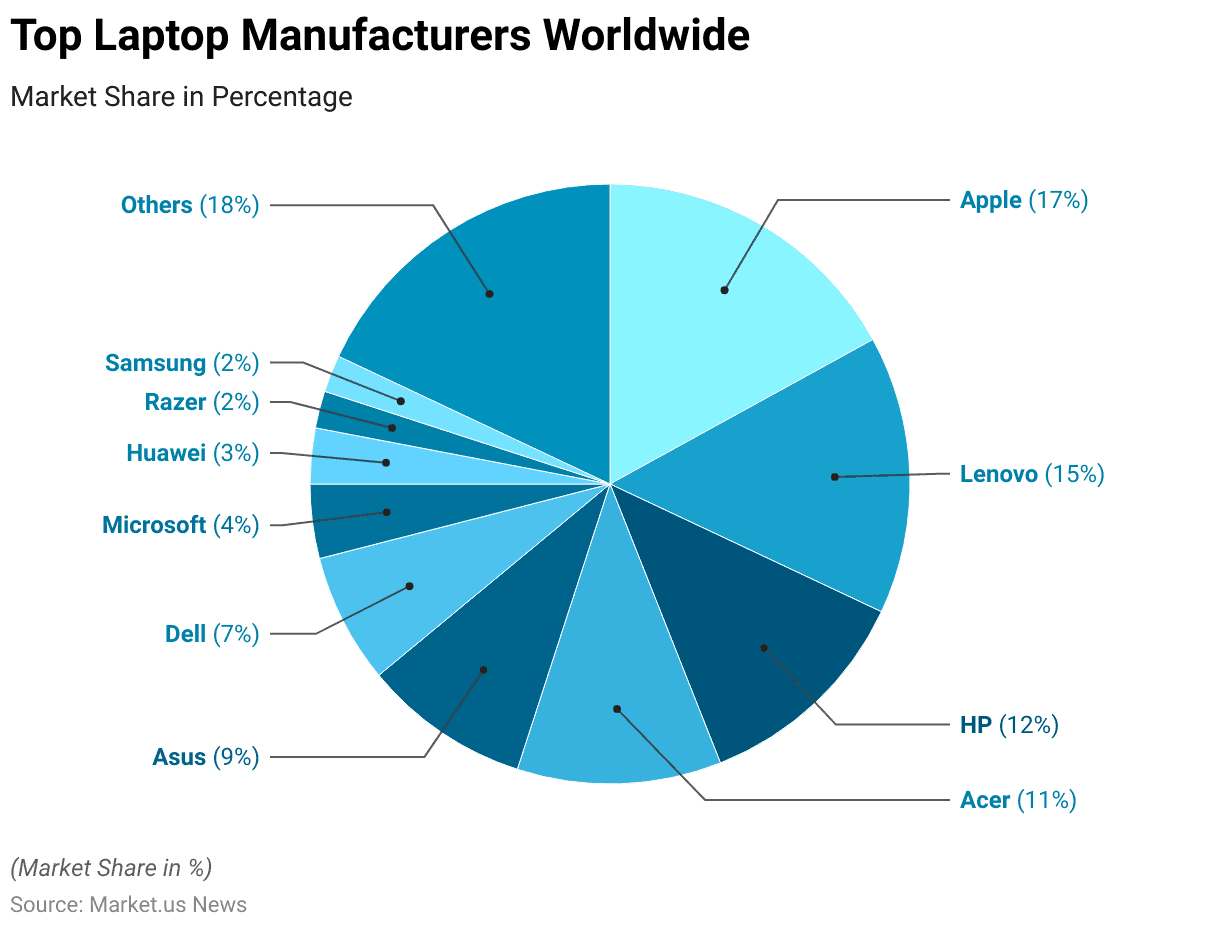
Top Laptop Manufacturers Worldwide
- The global laptop market is dominated by several key manufacturers, each holding a significant market share.
- Apple leads with a 17% market share, followed by Lenovo at 15% and HP at 12%.
- Acer and Asus hold 11% and 9% of the market share, respectively.
- Dell accounts for 7% of the market, while Microsoft captures 4%.
- Huawei holds a 3% share, and both Razer and Samsung each account for 2% of the market.
- Other manufacturers collectively make up the remaining 18% of the market.
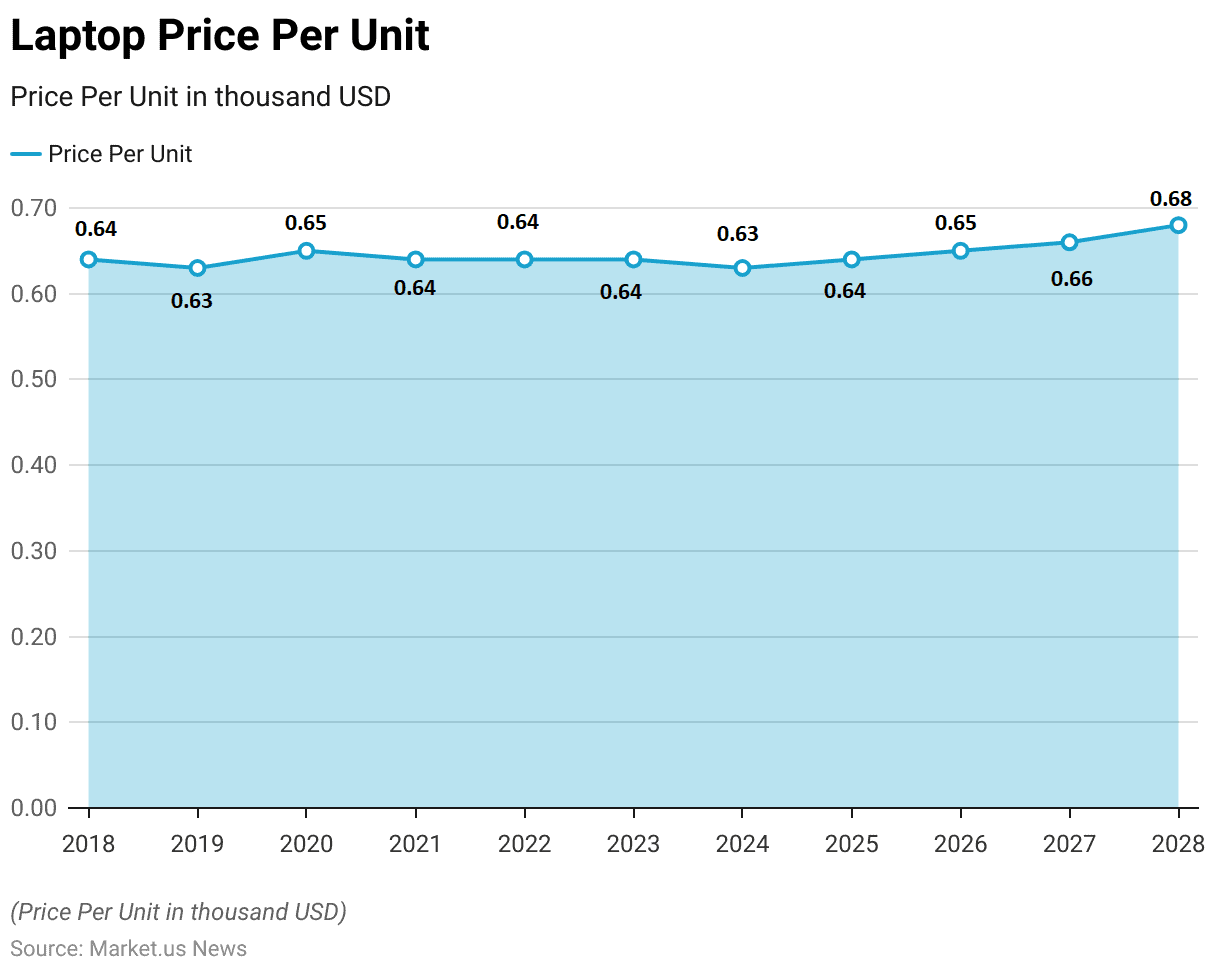
Laptop Price Statistics
- The average price per unit for laptops has shown relative stability with slight fluctuations over the past decade.
- In 2018, the price per unit was USD 0.64 thousand, which decreased marginally to USD 0.63 thousand in 2019.
- Further incremental increases are anticipated, with the price reaching USD 0.66 thousand in 2027 and USD 0.68 thousand by 2028.
Laptop Import Statistics
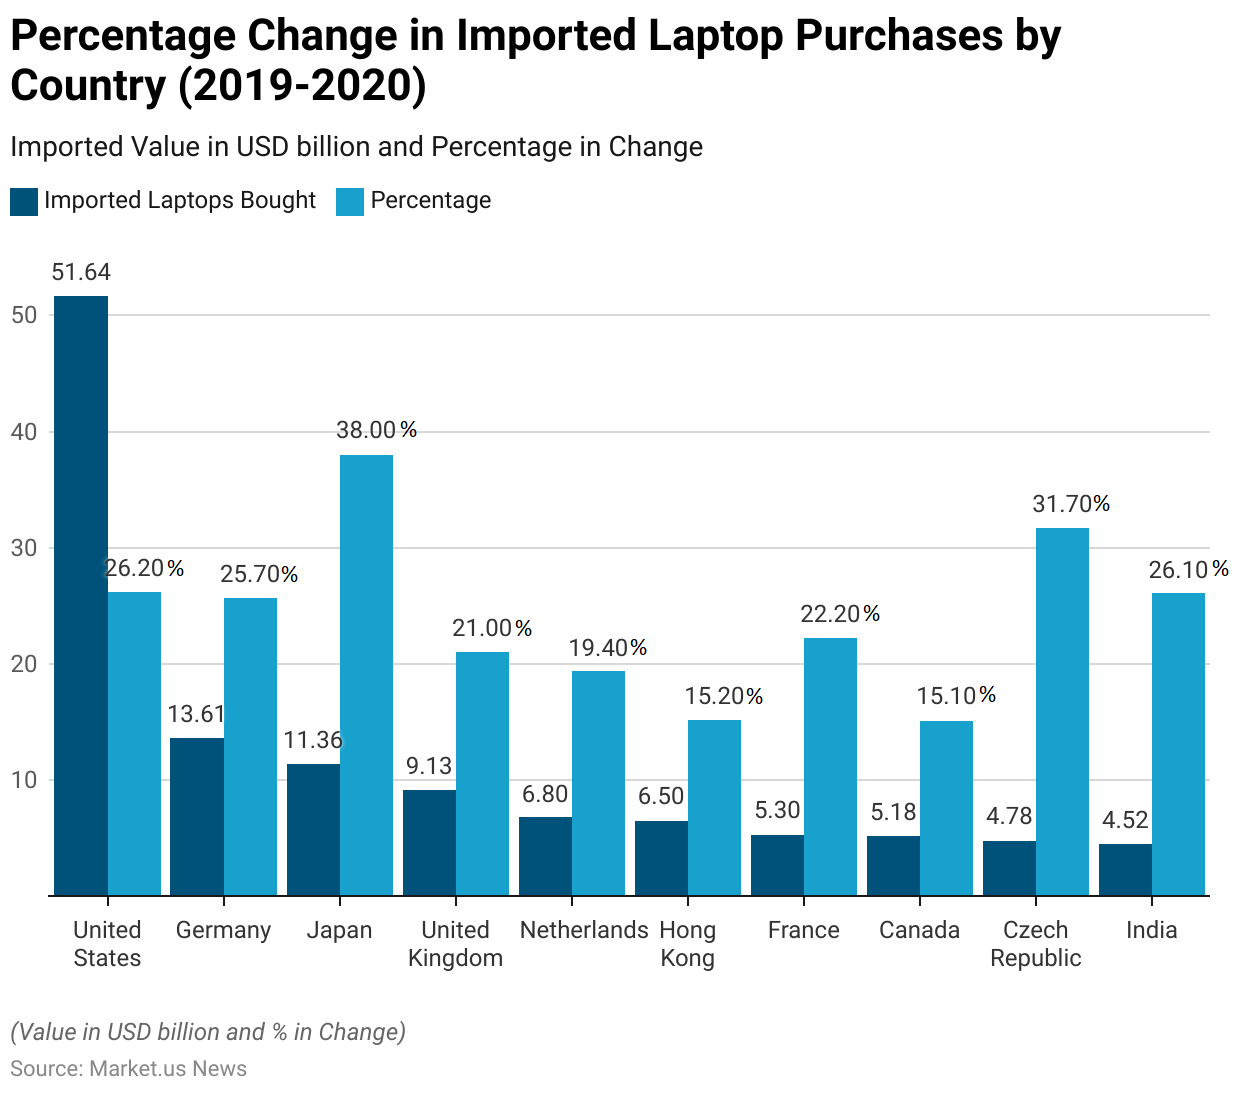
Imported Laptops Bought – By Country
- The period from 2019 to 2020 saw significant changes in imported laptop purchases across various countries.
- The United States led with imports valued at USD 51.64 billion, marking a 26.20% increase from 2019.
- Germany followed with imports worth USD 13.61 billion, reflecting a 25.70% rise.
- Japan experienced the highest percentage increase at 38.00%, with imports totaling USD 11.36 billion.
- The United Kingdom imported USD 9.13 billion worth of laptops, a 21.00% increase. While the Netherlands saw a 19.40% rise to USD 6.80 billion.
- Hong Kong’s imports grew by 15.20% to USD 6.50 billion.
- France imported laptops worth USD 5.30 billion, a 22.20% increase and Canada saw a 15.10% rise to USD 5.18 billion.
Laptop Export Statistics
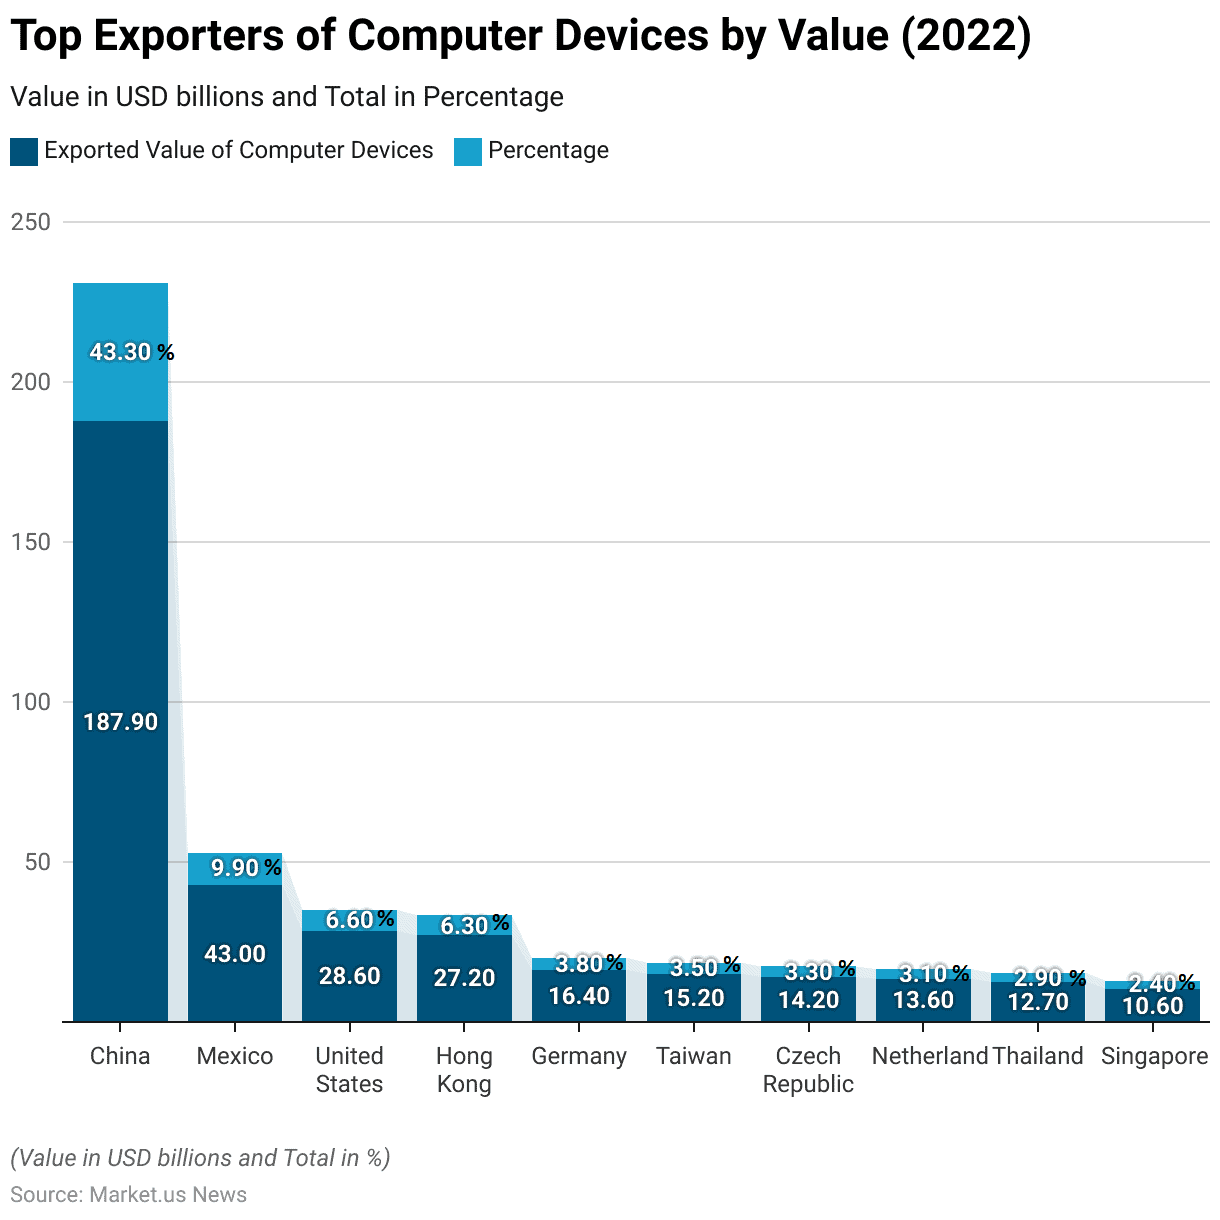
Top Exporters of Computer Devices – By Value
- In 2022, China emerged as the leading exporter of computer devices. With an exported value of USD 187.9 billion, accounting for 43.30% of the total global exports.
- Mexico followed, exporting computer devices worth USD 43.0 billion, which represented 9.90% of the total.
- The United States exported devices valued at USD 28.6 billion, contributing 6.60% to the global export market.
- Hong Kong’s exports stood at USD 27.2 billion, making up 6.30% of the total. While Germany exported USD 16.4 billion worth of computer devices, accounting for 3.80%.
- Taiwan and the Czech Republic contributed 3.50% and 3.30%, respectively. With exports valued at USD 15.2 billion and USD 14.2 billion.
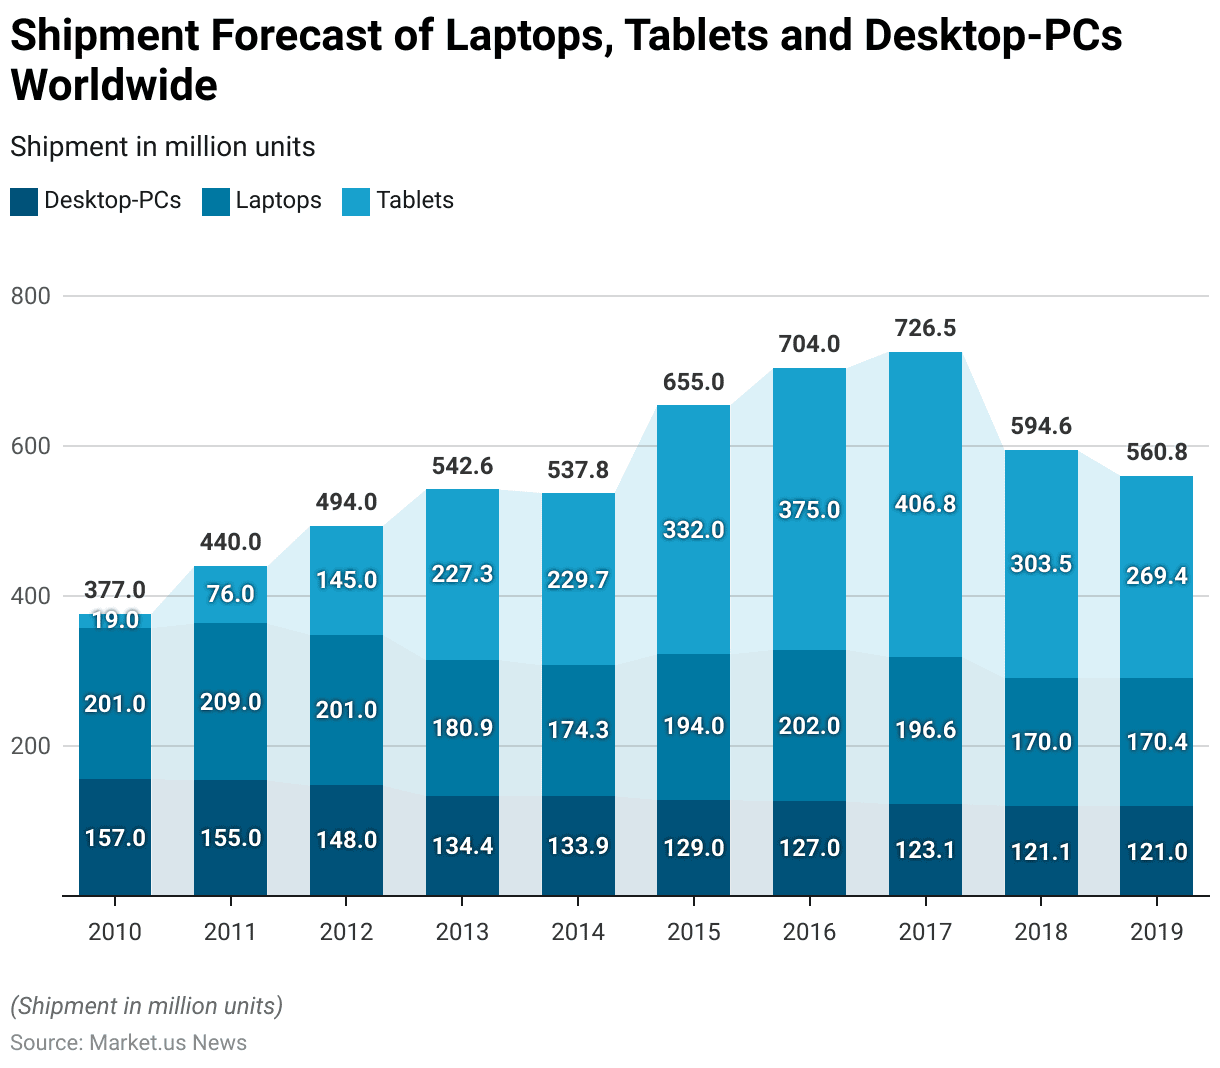
Laptop Shipments Statistics
- The shipment forecast of desktops, laptops, and tablets worldwide has shown significant changes over the years.
- In 2010, desktop-PC shipments were at 157 million units, laptops at 201 million units, and tablets at 19 million units.
- This trend persisted into 2019, with desktop-PC shipments at 121 million units. Laptops slightly increased to 170.4 million units, and tablets further declined to 269.4 million units.
Laptop Uses Statistics
Primary Use Cases for Laptop
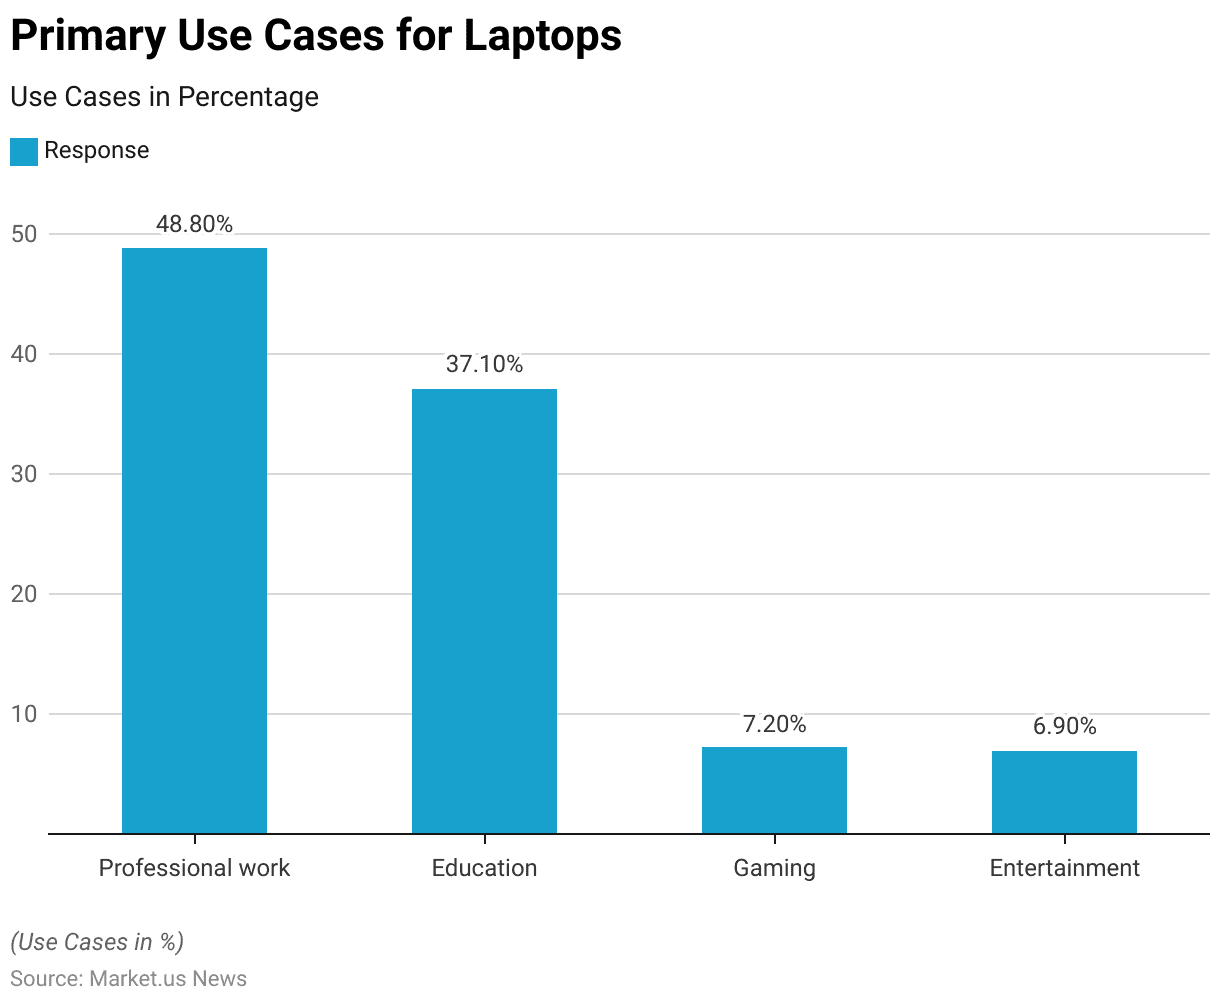
- The primary use cases for laptops highlight their versatility and importance across different sectors.
- The largest share, 48.80%, is dedicated to professional work. Indicating that nearly half of all laptop usage is for business and professional purposes.
- Education follows as a significant use case, accounting for 37.10% of laptop usage, reflecting their essential role in academic settings.
- Gaming constitutes 7.20% of laptop use, demonstrating a niche but substantial market for gaming laptops.
- Lastly, entertainment purposes account for 6.90% of laptop usage, underscoring their role in providing media and recreational activities.
Top Activities on Laptops
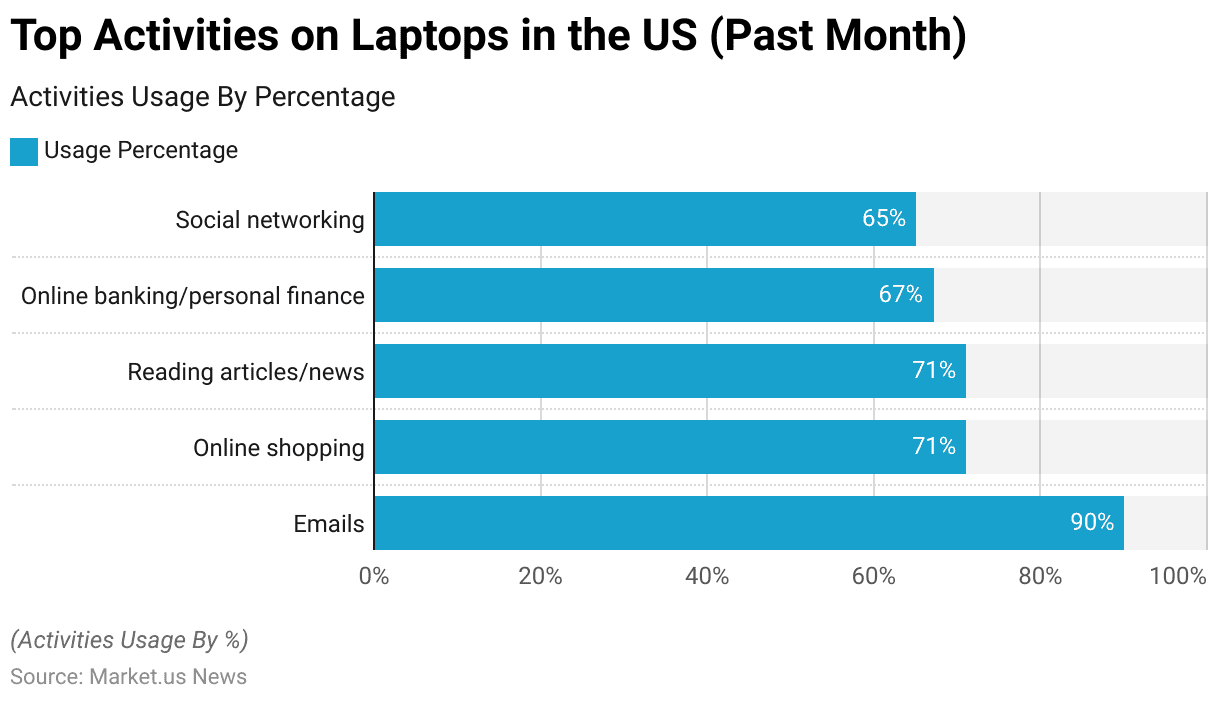
- In the past month, laptops in the US have been primarily used for a variety of activities, reflecting their integral role in daily life.
- Checking and sending emails is the most common activity, with 90% of users engaging in this task.
- Online shopping and reading articles or news are both highly popular, each with a usage rate of 71%.
- Online banking and managing personal finances are closely followed, with 67% of users utilizing their laptops for these purposes.
- Social networking is also a significant activity, with 65% of users engaging in it.
Consumer Preferences and Trends in Laptop Brands
Laptop Brand Preferences – By Age Group
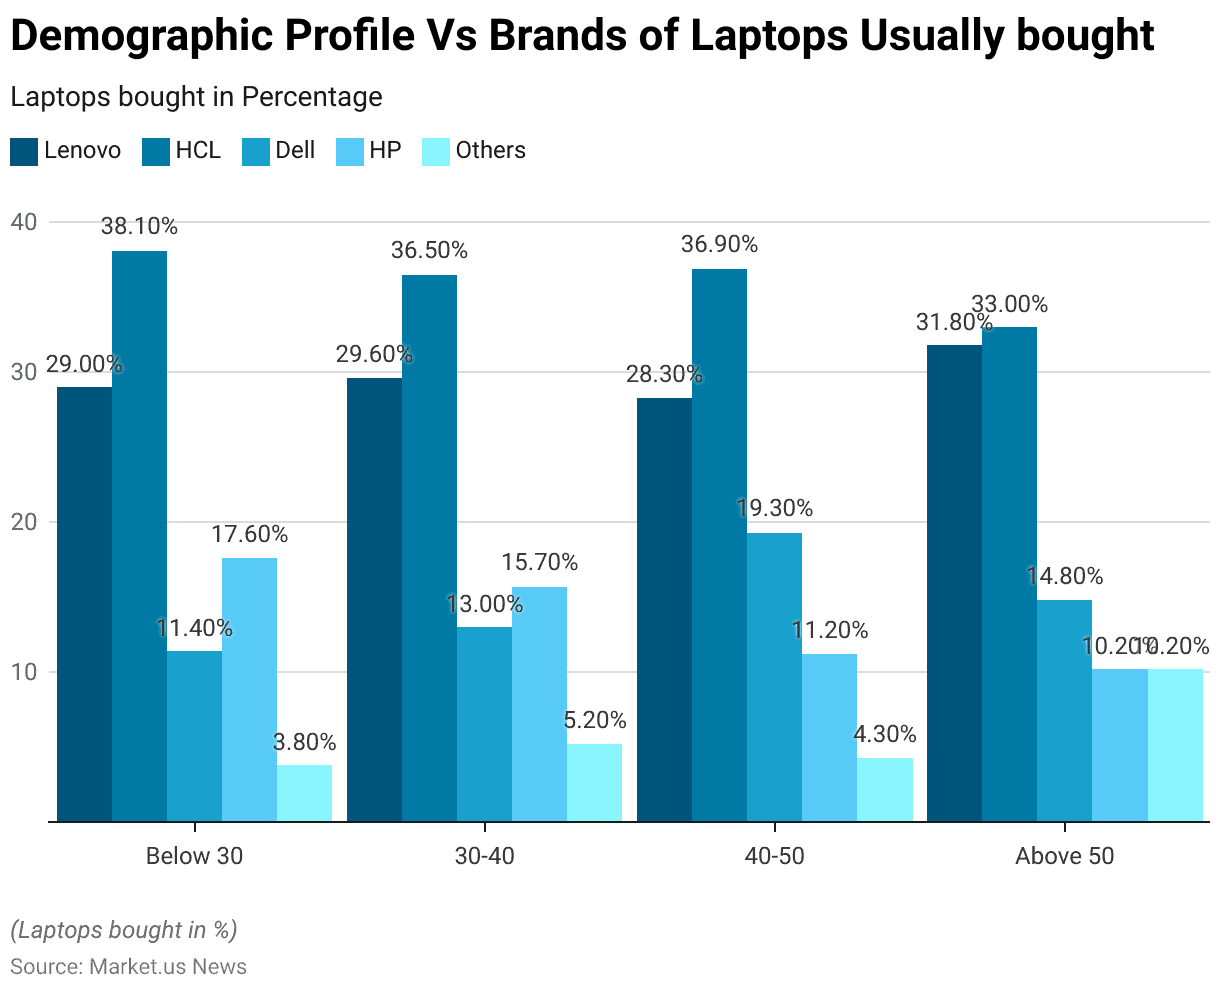
- The demographic profile of laptop buyers reveals distinct brand preferences across various age groups.
- Among individuals below 30 years, 29% prefer Lenovo, 38.10% opt for HCL, 11.40% choose Dell, 17.60% select HP, and 3.80% go for other brands.
- For the 30-40 age group, 29.60% favor Lenovo, 36.50% prefer HCL, 13% opt for Dell, 15.70% select HP, and 5.20% choose other brands.
- In the 40-50 age group, 28.30% prefer Lenovo, 36.90% choose HCL, 19.30% favor Dell, 11.20% select HP, and 4.30% opt for other brands.
- Among those above 50 years, 31.80% favor Lenovo, 33% opt for HCL, 14.80% choose Dell, 10.20% select HP, and 10.20% prefer other brands.
Laptop Brand Preferences – By Occupation
- The preference for laptop brands varies notably across different occupational groups.
- Among business professionals, HP is the most preferred brand, with 25.90% opting for it, followed by Dell at 18.20%, HCL at 20.90%, Lenovo at 14.80%, and other brands at 29%.
- In the government sector, Dell leads with 23.90%, closely followed by Lenovo at 23.30%, HCL at 18.20%, HP at 16.50%, and other brands at 25.80%.
- For private sector employees, HP again takes the lead with 20%, followed by Dell at 17%, Lenovo at 12.50%, HCL at 13.60%, and other brands at 12.90%.
- Students show a strong preference for Lenovo and HCL, each with 22.70%, while Dell is chosen by 15.90%, HP by 12.90%, and other brands by 9.70%.
- Among other occupations, Lenovo is favored by 26.70%, followed by HCL at 24.50%, Dell at 25%, HP at 24.70%, and other brands at 22.60%.
Key Attributes Considered by Users While Buying a Laptop
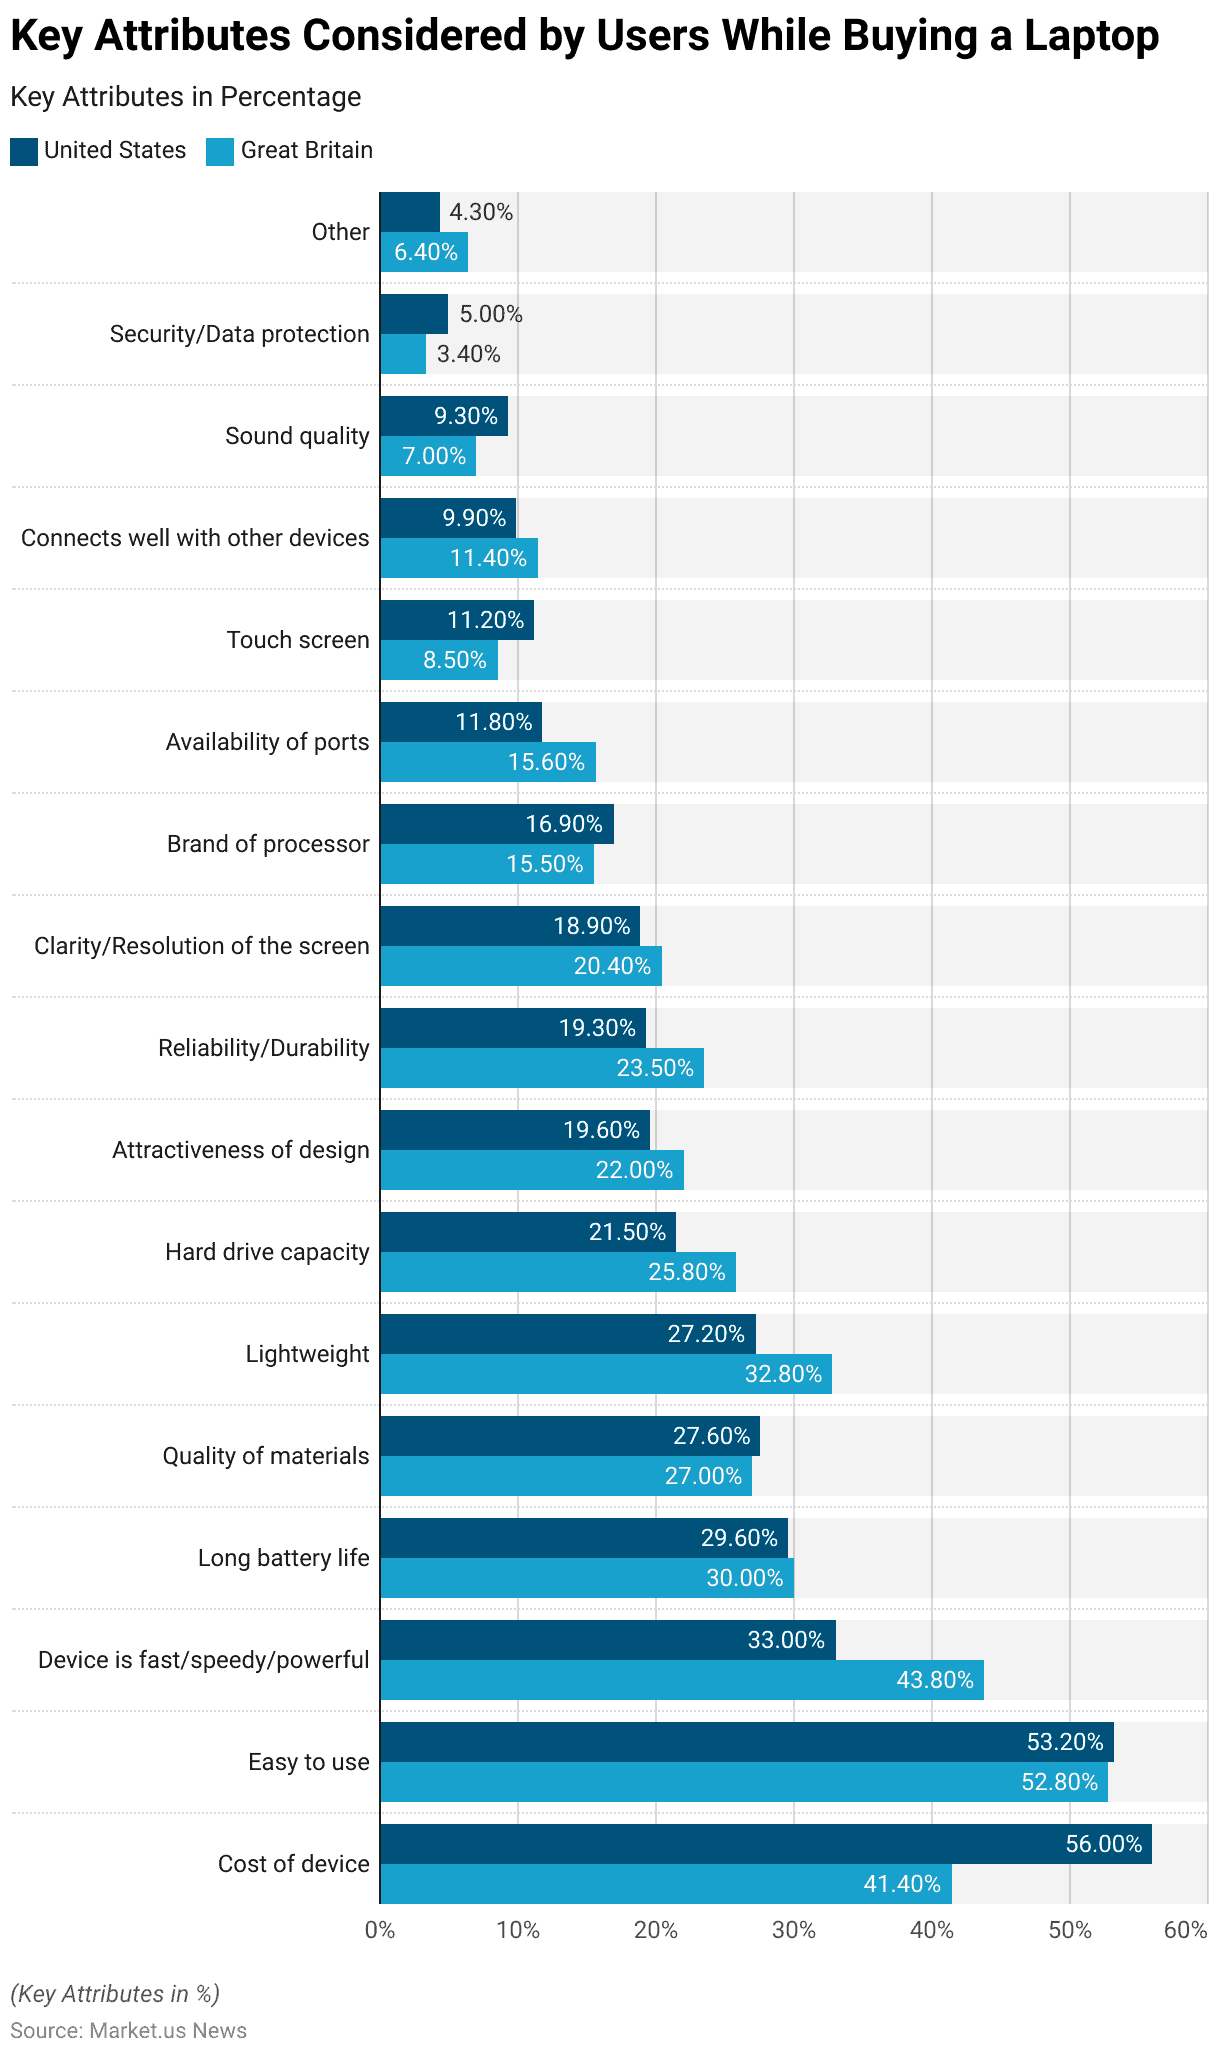
- When purchasing a laptop, users in the United States and Great Britain prioritize different key attributes.
- In the United States, the cost of the device is the most important factor, considered by 56% of users, followed by ease of use at 53.20%.
- The device’s speed and power are significant at 33%, while long battery life is important at 29.60%. Quality of materials (27.60%), lightweight design (27.20%), and hard drive capacity (21.50%) are also crucial considerations.
- The attractiveness of design (19.60%), reliability and durability (19.30%), and screen clarity and resolution (18.90%) are valued by many users.
- Other factors include the brand of processor (16.90%), availability of ports (11.80%), touchscreen capability (11.20%), connectivity with other devices (9.90%), sound quality (9.30%), and security/data protection (5%). Additionally, 4.30% of users consider other attributes.
Impact of COVID-19
- In March 2020, the coronavirus (COVID-19) outbreak significantly impacted laptop sales growth in Russia, with notable differences observed among various brands in both monetary and real terms.
- Asus experienced a 23% growth in monetary terms and a 24% growth in real terms, indicating a strong performance during this period.
- Lenovo saw a 17% increase in monetary terms and an even higher growth of 22% in real terms.
- HP achieved a 21% growth in real terms, although specific monetary growth data is not provided.
- Acer reported an 18% growth in monetary terms, with no corresponding real terms data available.
Barriers and Challenges
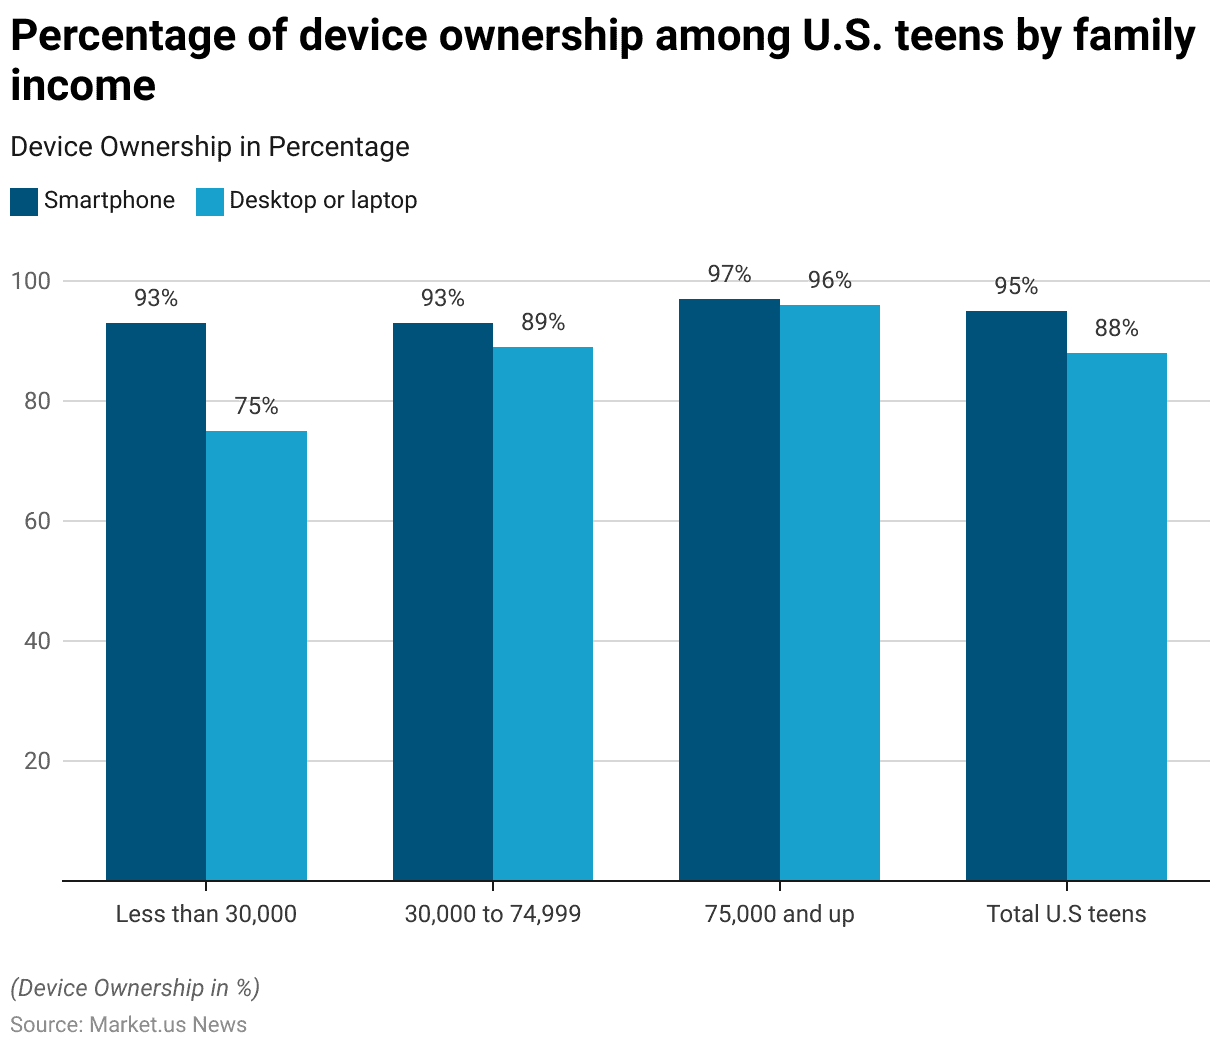
- Income significantly impacts laptop ownership among U.S. teens, revealing disparities across different income groups.
- Among teens from families with an income of less than USD 30,000, 93% own a smartphone, but only 75% own a desktop or laptop.
- In the income bracket of USD 30,000 to USD 74,999, smartphone ownership remains steady at 93%, while desktop or laptop ownership increases to 89%.
- For teens from families earning USD 75,000 and above, 97% own a smartphone, and 96% have a desktop or laptop.
- On average, 95% of all U.S. teens own a smartphone, while 88% own a desktop or laptop.
Key Investment Trends
- Investment in laptop development in 2024 has seen significant contributions from major technology companies, focusing on innovations such as AI integration and sustainable design.
- Companies like Apple, Dell, and Microsoft are leading the charge with substantial funding towards enhancing AI capabilities in their laptop offerings.
- For instance, Microsoft is leveraging its investments in AI to integrate features like Office 365 Copilot, enhancing productivity tools with advanced AI functionalities.
- Meanwhile, Framework has raised $44 million to develop eco-friendly laptops that are customizable and repairable by users, reflecting a growing trend towards sustainable technology.
Regulations for Laptops
- Laptop regulations vary significantly across countries, reflecting diverse security, economic, and legal concerns.
- In India, stringent import restrictions have been imposed to boost local manufacturing, requiring firms to obtain government permission before importing laptops. However, basic customs duties remain zero due to commitments under the Information Technology Agreement 1997.
- In Bangladesh, travelers must declare laptops upon arrival, with proper documentation such as passports, visas, and commercial invoices to avoid fines or confiscation.
- Peru allows each traveler to bring one laptop duty-free, emphasizing the need for proper declarations to prevent issues at customs.
- Ethiopia mandates that laptops be declared both upon entry and exit, aligning with its broader customs policies aimed at regulating electronic imports and ensuring compliance.
Discuss your needs with our analyst
Please share your requirements with more details so our analyst can check if they can solve your problem(s)