

Table of Contents
- Introduction
- Editor’s Choice
- Global Cruise Market Overview
- Global Passengers Carried and Growth Rates
- Countries Leading in the Industry Revenue
- Largest Cruise Ships Worldwide – By Gross Tonnage
- Leading Ocean Cruise Destinations Worldwide
- World’s Busiest Cruise Ports
- Global Average Capacity for Ocean Cruise Ships
- Most Expensive Global Cruise Ships- By Construction Price
- Demographics of Cruise Passengers
- Cruise Passenger Attitudes and Behaviour
- Cruise Tourism Future Projections
Introduction
According to Cruise Statistics, The cruise industry has a rich history, dating back to the 19th century, with modern cruising gaining popularity in the mid-20th century.
The industry caters to diverse interests and preferences by offering various cruises, including ocean, river, expedition, theme, and luxury cruises. Popular destinations span the globe, from the Caribbean’s pristine beaches to Europe’s historic cities and Alaska’s stunning scenery.
Major players like Carnival Corporation, Royal Caribbean Group, and Norwegian Cruise Line Holdings dominate the market, each offering unique experiences.
Recent trends focus on sustainability, technology integration, health and wellness, and customization, reflecting the industry’s continuous evolution to meet consumer demands.
Editor’s Choice
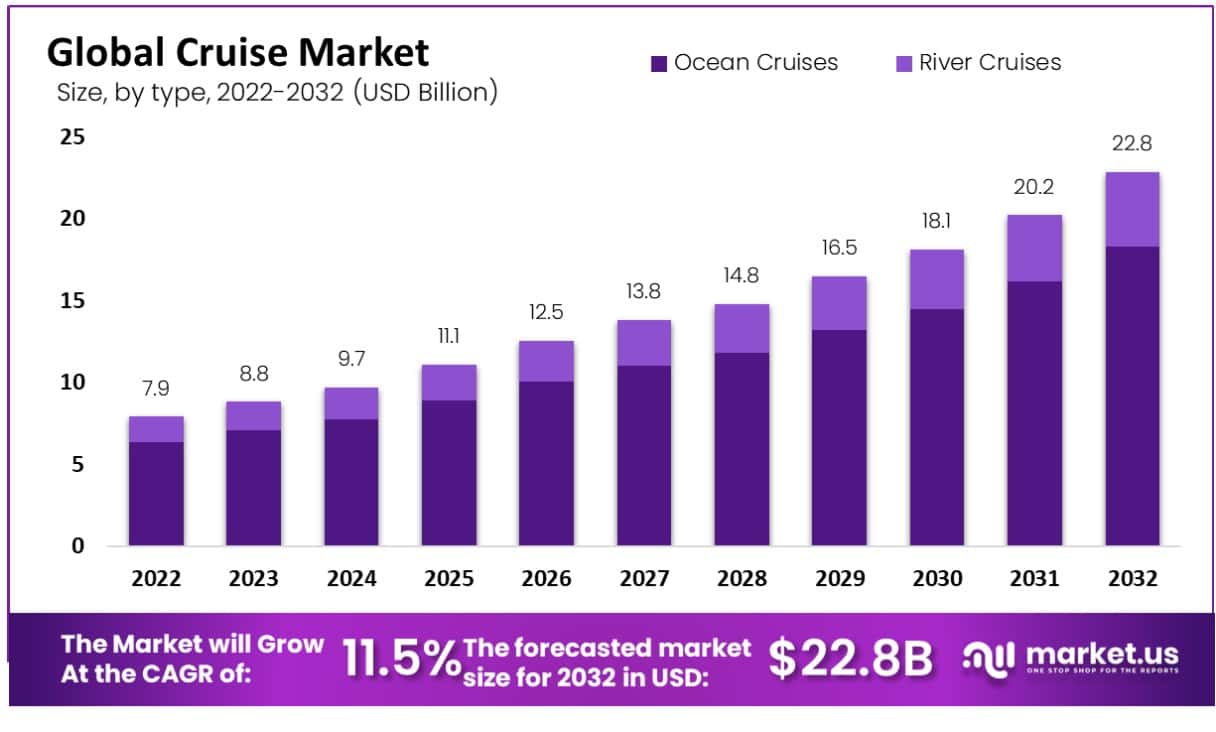
- The global cruise market has demonstrated a steady upward trajectory in revenue at a CAGR of 11.50%.
- As the market expanded in 2023, total revenues rose to $8.8 billion, accompanied by an increase in ocean cruises to $7.04 billion and river cruises to $1.76 billion.
- In the context of market share distribution for different applications, daily commuting commands a significant majority, accounting for 60% of the market.
- The cruise industry experienced a resurgence in 2019, with a growth rate of 5.8%, reflecting renewed interest and increasing demand for cruise vacations.
- The United States consistently maintained its dominant position from 2025-2028, with revenue figures steadily increasing from $15,682.77 million in 2025 to $17,198.44 million in 2028.
- The leading ocean cruise destinations worldwide, as of the latest data, highlight the Caribbean, Bahamas, and Bermuda as the most popular choice, commanding a significant share of 45% of all passengers.
- By 2025, the global average capacity for ocean cruise ships is expected to peak at 764,440 tonnes.
Global Cruise Market Overview
Global Cruise Market Size
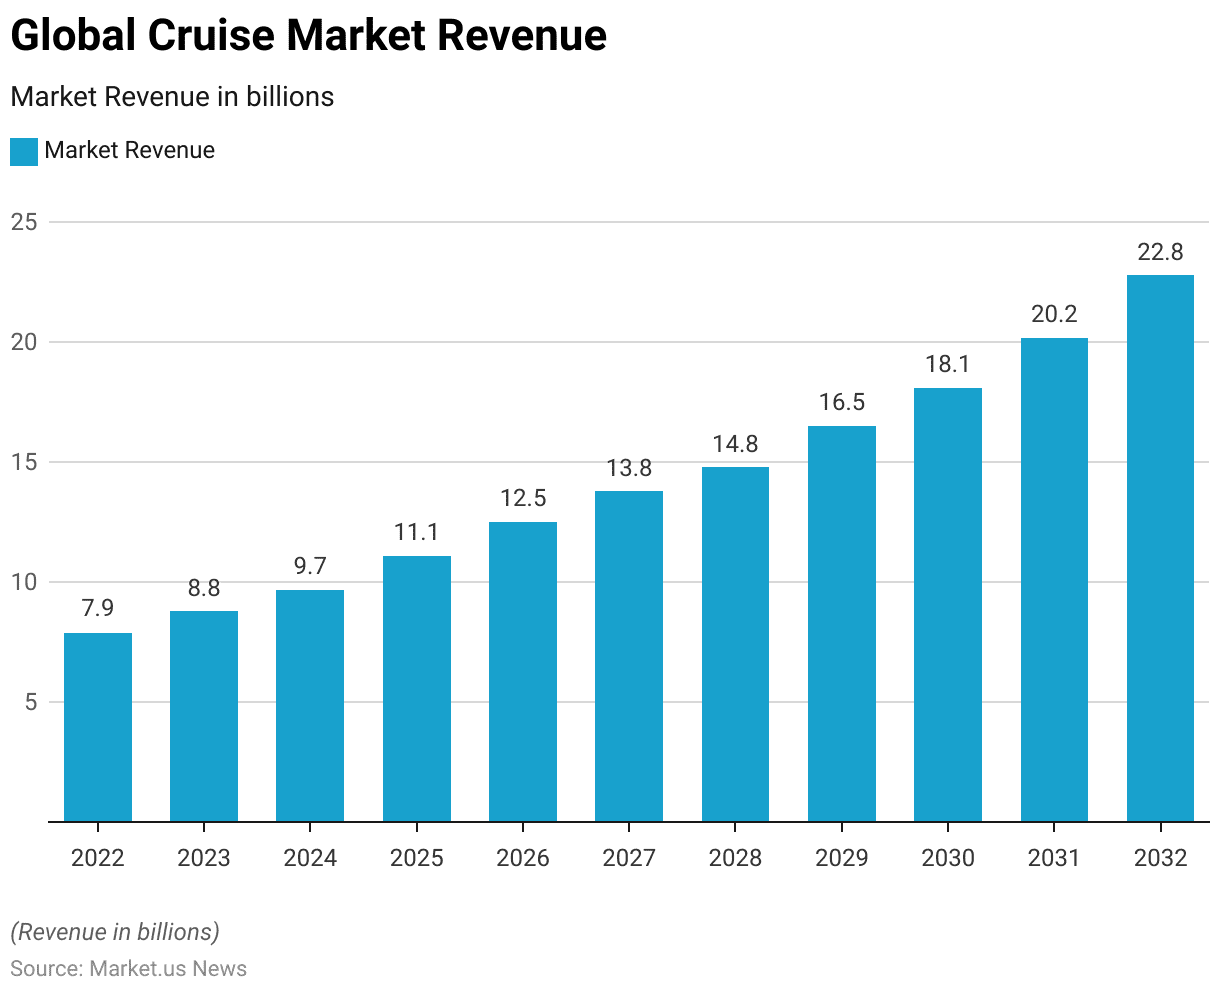
- The global cruise market has demonstrated a steady upward trajectory in revenue at a CAGR of 11.50%, commencing with $7.9 billion in 2022.
- The following year, 2023, saw an increase to $8.8 billion, indicating a resilient growth trend.
- The growth pattern remains robust into the next decade, with revenues forecasted at $18.1 billion in 2030, followed by $20.2 billion in 2031, and reaching $22.8 billion by 2032.
Cruise Market Size – By Type
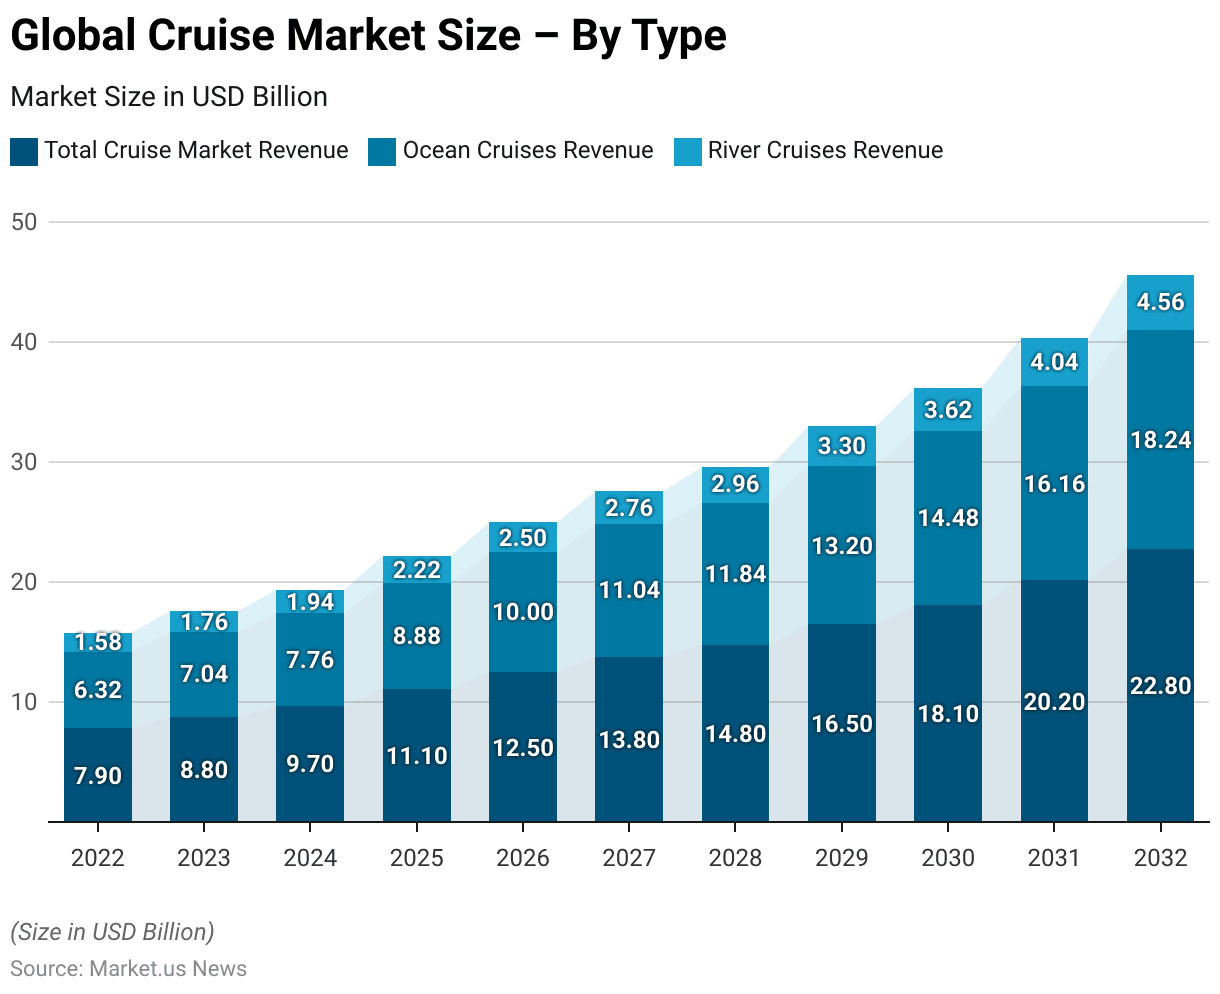
- The global cruise market is segmented into ocean and river cruises, each showing distinctive growth patterns. In 2022, the total cruise market revenue stood at $7.9 billion, with ocean cruises contributing $6.32 billion and river cruises $1.58 billion.
- As the market expanded in 2023, total revenues rose to $8.8 billion, accompanied by an increase in ocean cruises to $7.04 billion and river cruises to $1.76 billion.
- By 2032, the total market surged to $22.8 billion, with ocean cruises contributing $18.24 billion and river cruises reaching $4.56 billion.
Cruise Market Share – By Application
- In the context of market share distribution for different applications, daily commuting commands a significant majority, accounting for 60% of the market.
- On the other hand, touring holds a 40% share, indicating a robust interest in this area as well.

Sales Channel Shares in Global Cruise Revenue
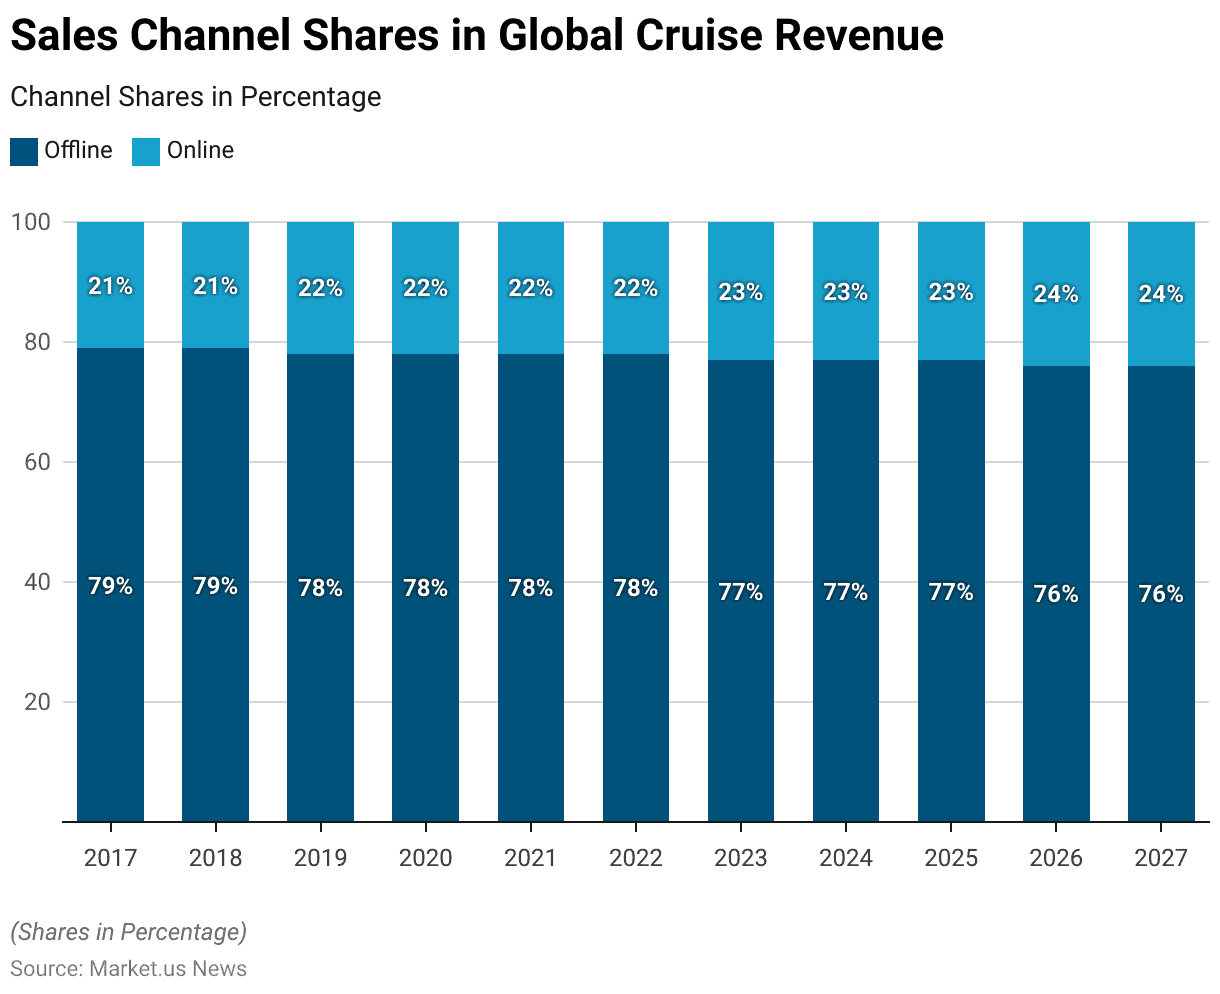
- From 2017 to 2027, the distribution of sales channels in global cruise revenue has remained relatively stable, with offline channels consistently holding the majority share.
- In 2017, offline sales accounted for 79% of revenue, while online sales constituted 21%.
- This trend persisted through 2022, with offline channels maintaining a steady 78% share and online channels at 22%.
- However, a gradual shift occurred from 2023 onwards, with offline sales declining to 77% by 2025 and further to 76% by 2027.
- Conversely, online sales saw a corresponding increase, rising to 23% in 2023 and eventually reaching 24% by 2027.
Global Passengers Carried and Growth Rates
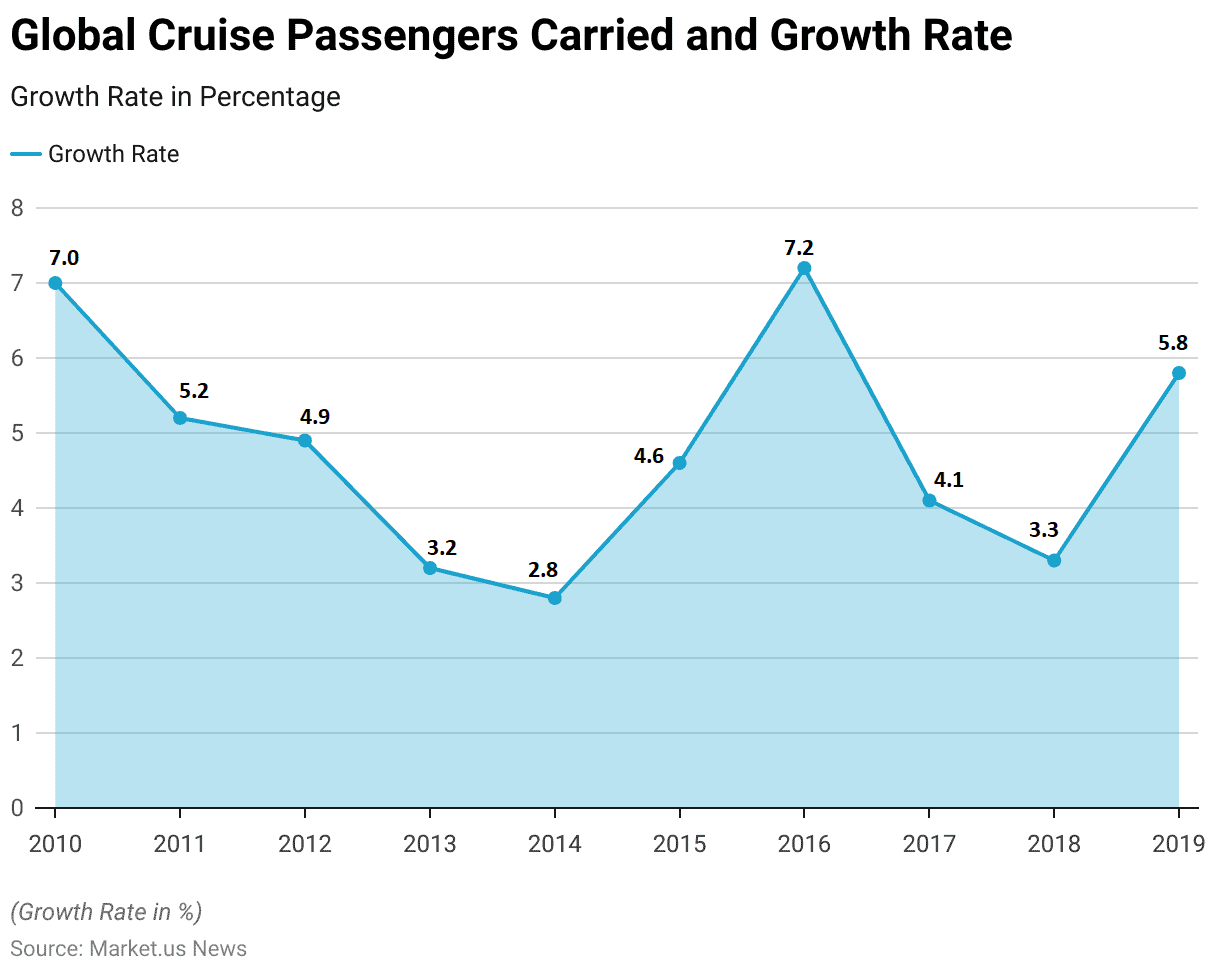
- Between 2010 and 2019, the global cruise industry experienced fluctuating growth rates in the number of passengers carried annually.
- Starting at a growth rate of 7.0% in 2010, the industry saw a slight decrease to 5.2% in 2011, followed by further declines to 4.9% in 2012 and 3.2% in 2013.
- The industry experienced a resurgence in 2019, with a growth rate of 5.8%, reflecting renewed interest and increasing demand for cruise vacations.
Countries Leading in the Industry Revenue
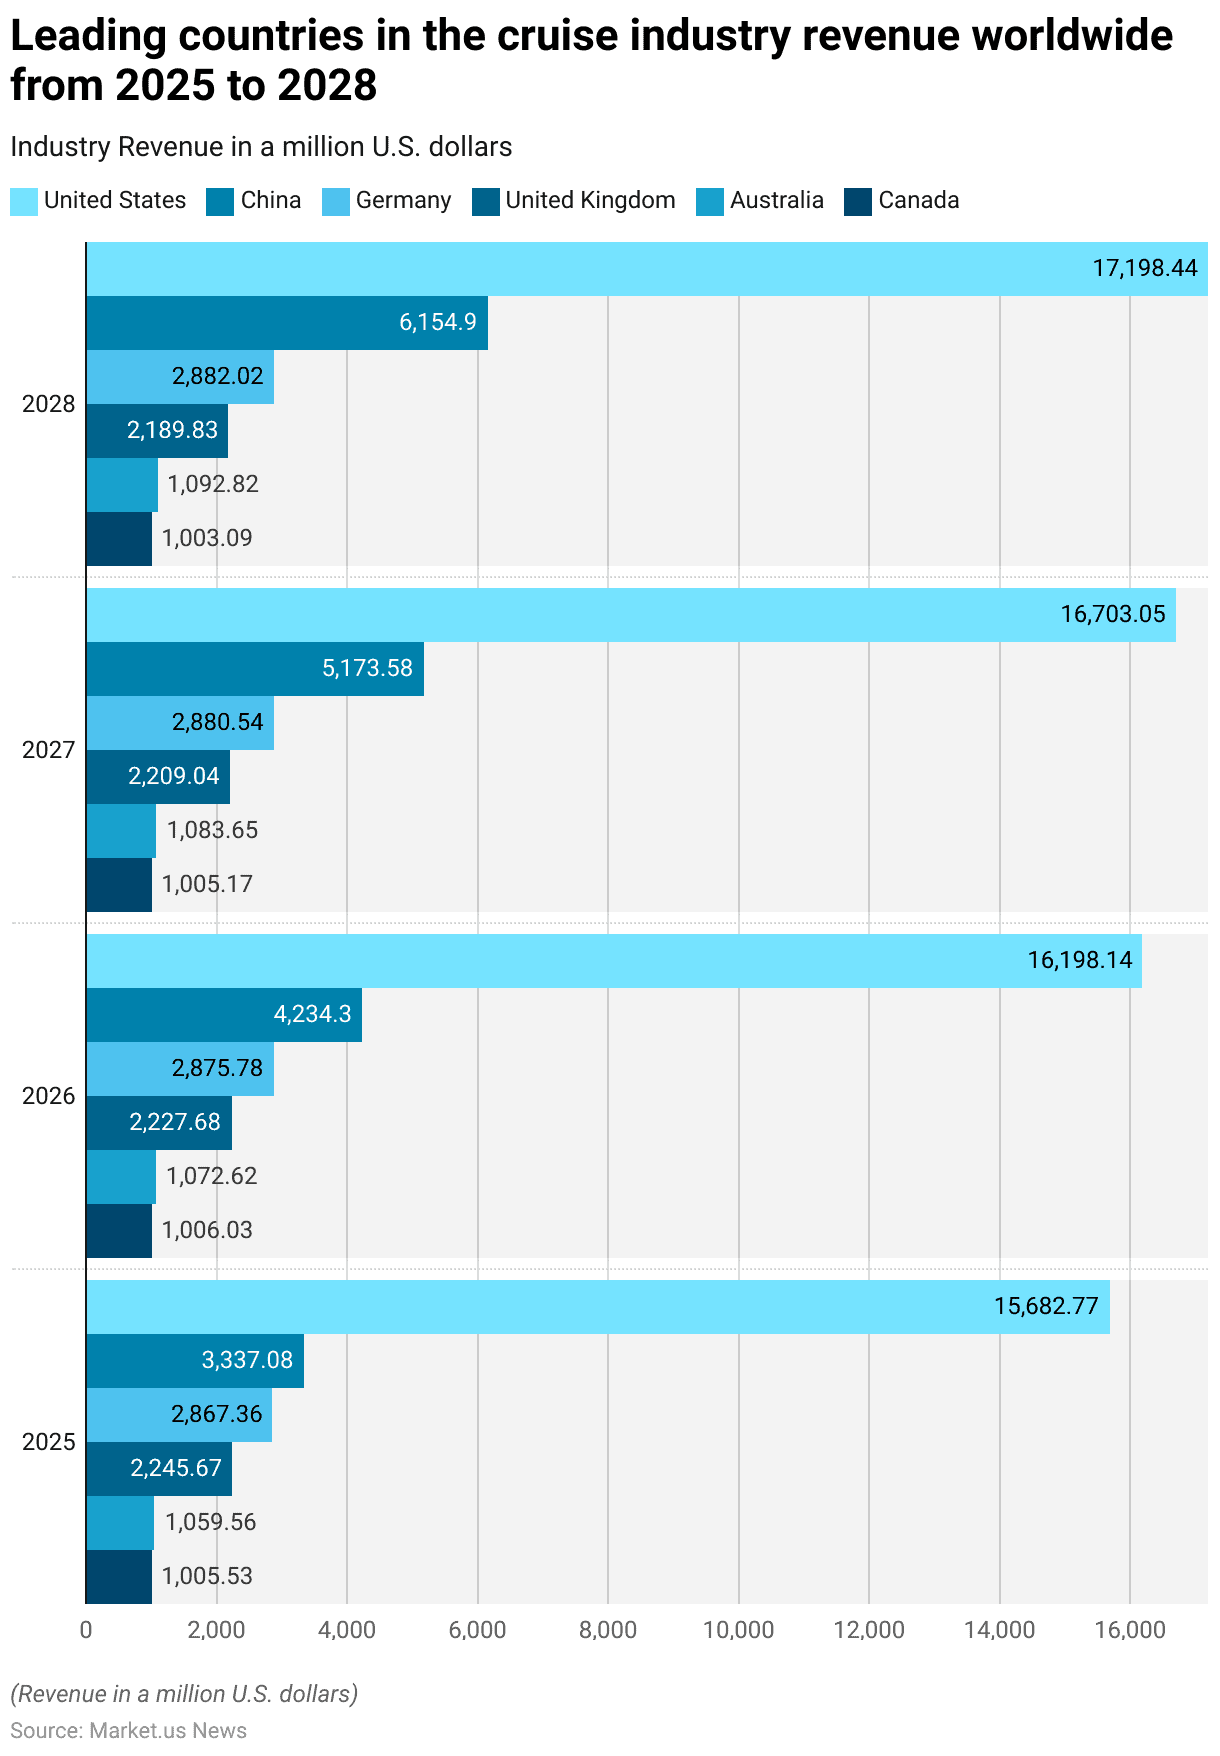
- From 2025 to 2028, several countries emerged as leaders in the global cruise industry in terms of revenue.
- The United States consistently maintained its dominant position throughout this period, with revenue figures steadily increasing from $15,682.77 million in 2025 to $17,198.44 million in 2028.
- China experienced significant growth, rapidly climbing the ranks to become a formidable player in the industry. Starting at $3,337.08 million in 2025, China’s revenue surged to $6,154.90 million by 2028, reflecting its expanding market presence.
- Germany remained relatively stable, with revenue figures hovering around the $2,800 million mark from 2025 to 2028.
Largest Cruise Ships Worldwide – By Gross Tonnage
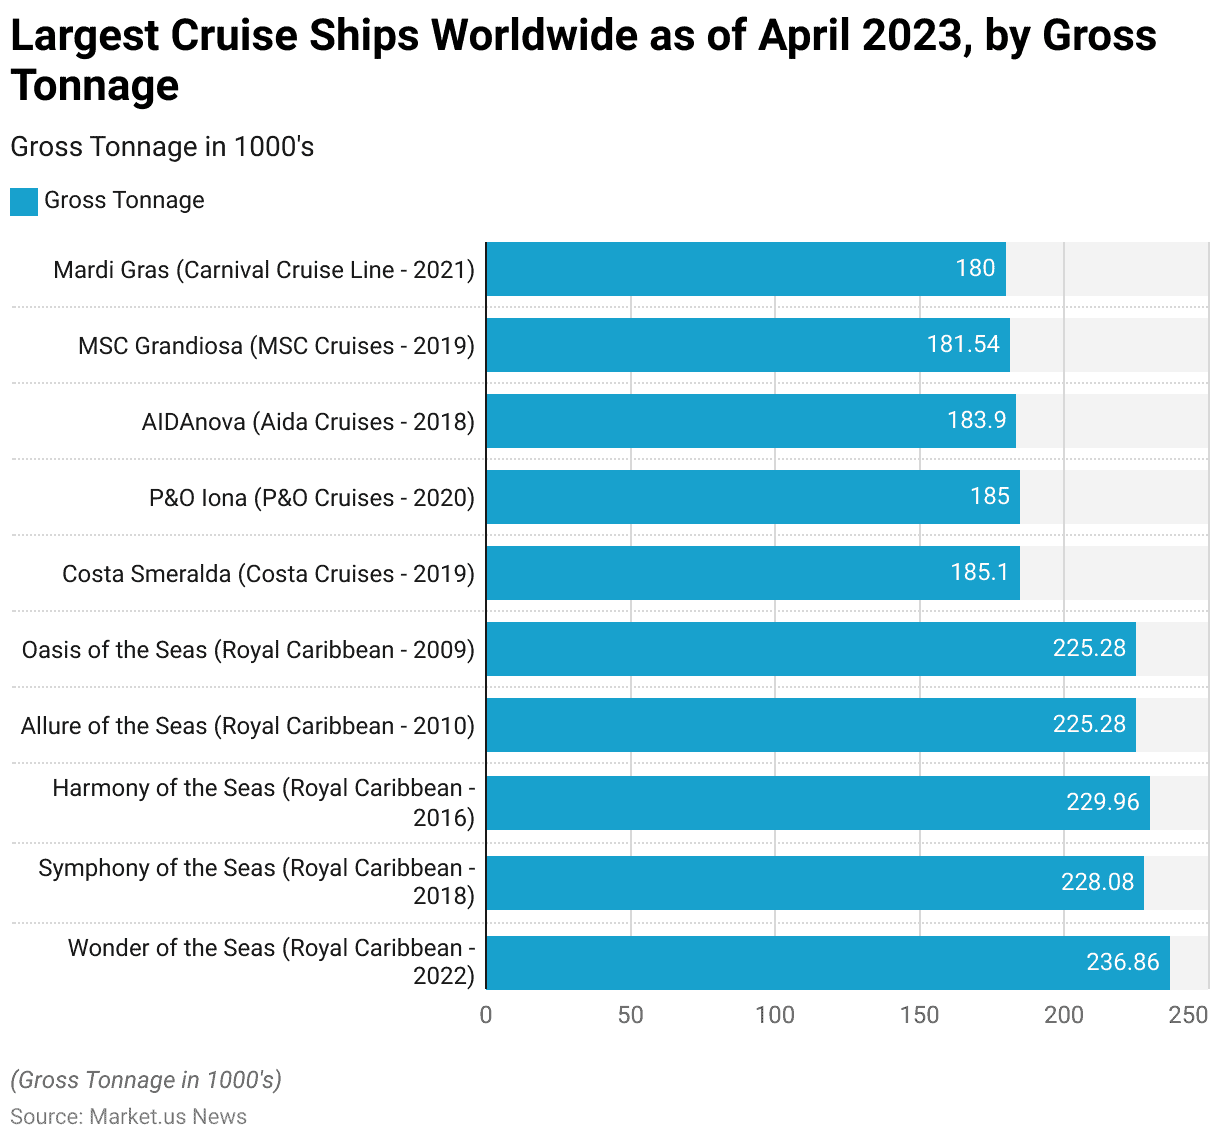
- As of April 2023, the largest cruise ships worldwide, ranked by gross tonnage, reflect the dominance of Royal Caribbean International in the industry.
- Topping the list is the Wonder of the Seas, launched in 2022, boasting an impressive gross tonnage of 236.86 thousand.
- Following closely are other Royal Caribbean vessels: Symphony of the Seas (228.08 thousand), Harmony of the Seas (229.96 thousand), Allure of the Seas (225.28 thousand), and Oasis of the Seas (also 225.28 thousand).
- Costa Cruises’ Costa Smeralda, introduced in 2019, stands out as well with a gross tonnage of 185.1 thousand, alongside P&O Cruises’ P&O Iona at 185 thousand.
Leading Ocean Cruise Destinations Worldwide
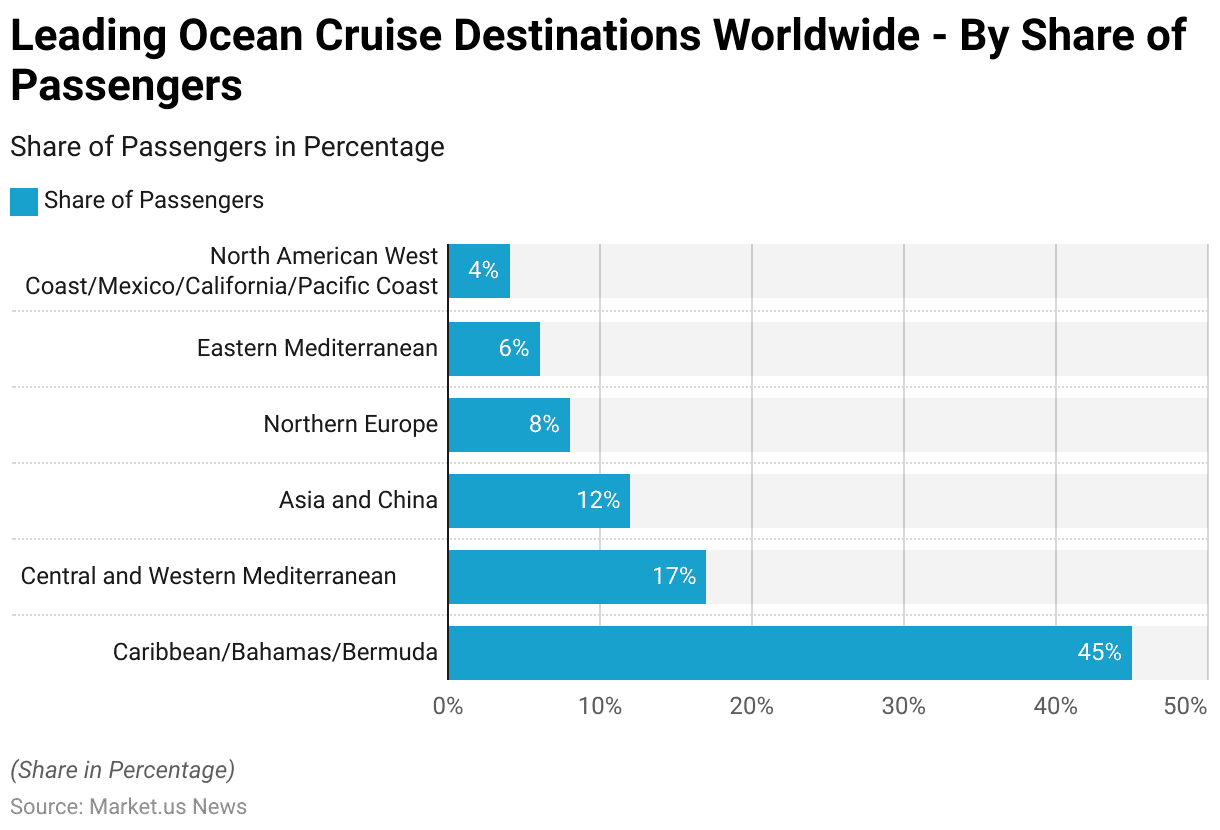
- The leading ocean cruise destinations worldwide, as of the latest data, highlight the Caribbean, Bahamas, and Bermuda as the most popular choice, commanding a significant share of 45% of all passengers.
- Following closely, the Central and Western Mediterranean regions capture 17% of the market, while Asia and China attract 12% of passengers, reflecting the growing interest in this region.
- Northern Europe and the Eastern Mediterranean follow suit, each accounting for 8% and 6% of passengers, respectively.
- North American destinations along the West Coast, including Mexico, California, and the Pacific Coast, contribute 4% to the global cruise market.
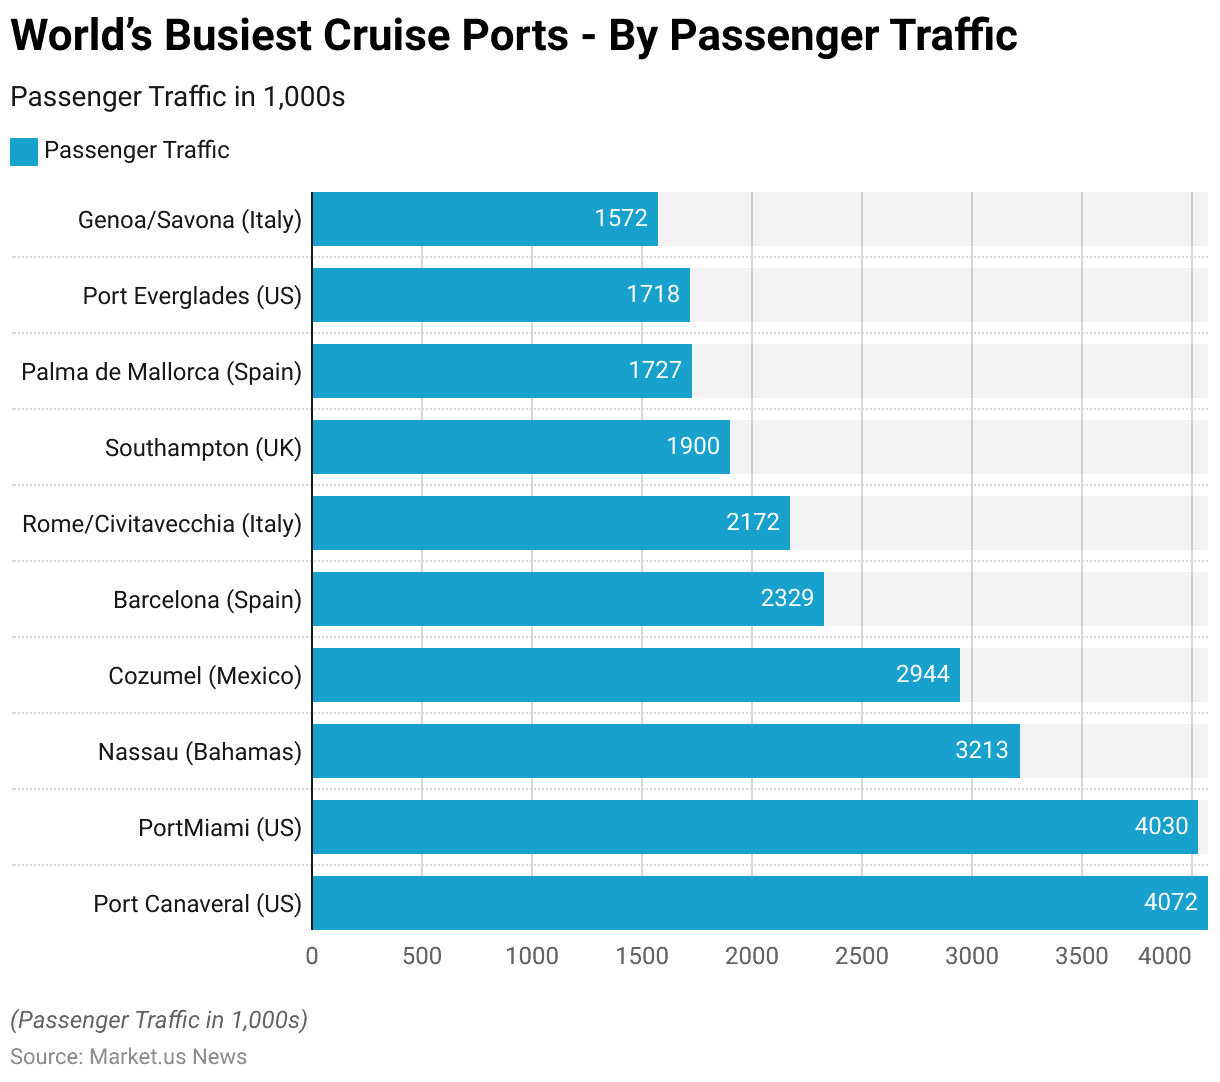
World’s Busiest Cruise Ports
- In 2022, the world’s busiest cruise ports by passenger traffic showcased a diverse range of destinations across the globe.
- Leading the pack were two ports in the United States, Port Canaveral, and PortMiami, with passenger traffic of 4,072 thousand and 4,030 thousand, respectively, reflecting the significant role of the United States in the global cruise industry.
- Following closely behind was Nassau in the Bahamas, attracting 3,213 thousand passengers, followed by Cozumel in Mexico with 2,944 thousand passengers.
- European ports also featured prominently, with Barcelona in Spain welcoming 2,329 thousand passengers, while Rome/Civitavecchia in Italy and Southampton in the UK hosted 2,172 thousand and 1,900 thousand passengers, respectively.
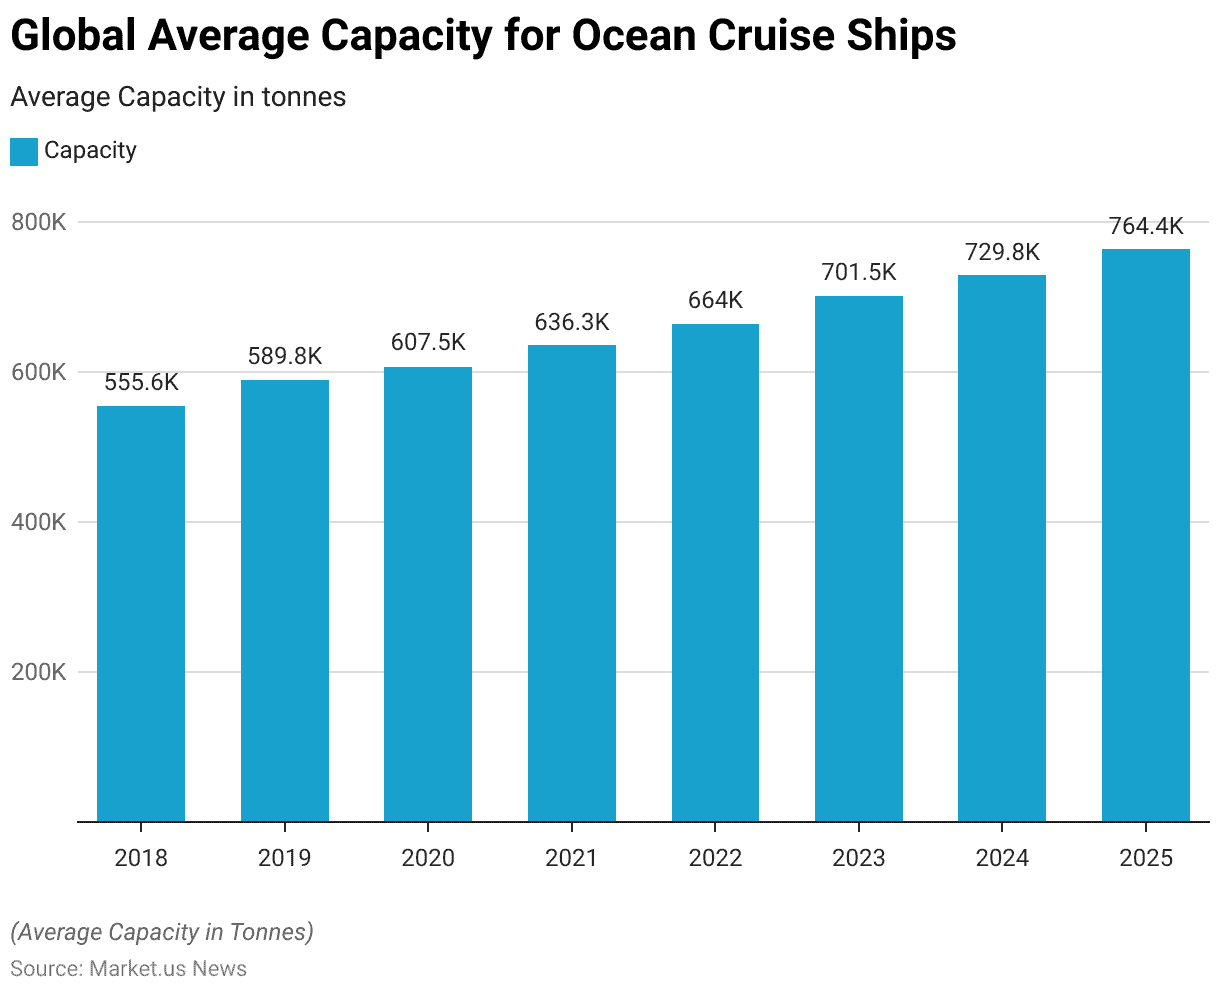
Global Average Capacity for Ocean Cruise Ships
- The global average capacity for ocean cruise ships has demonstrated steady growth from 2018 to 2025, reflecting the expansion of the cruise industry.
- In 2018, the average capacity stood at 555,570 tonnes, increasing to 589,820 tonnes in 2019 and further to 607,500 tonnes in 2020.
- By 2025, the global average capacity for ocean cruise ships peaked at 764,440 tonnes.
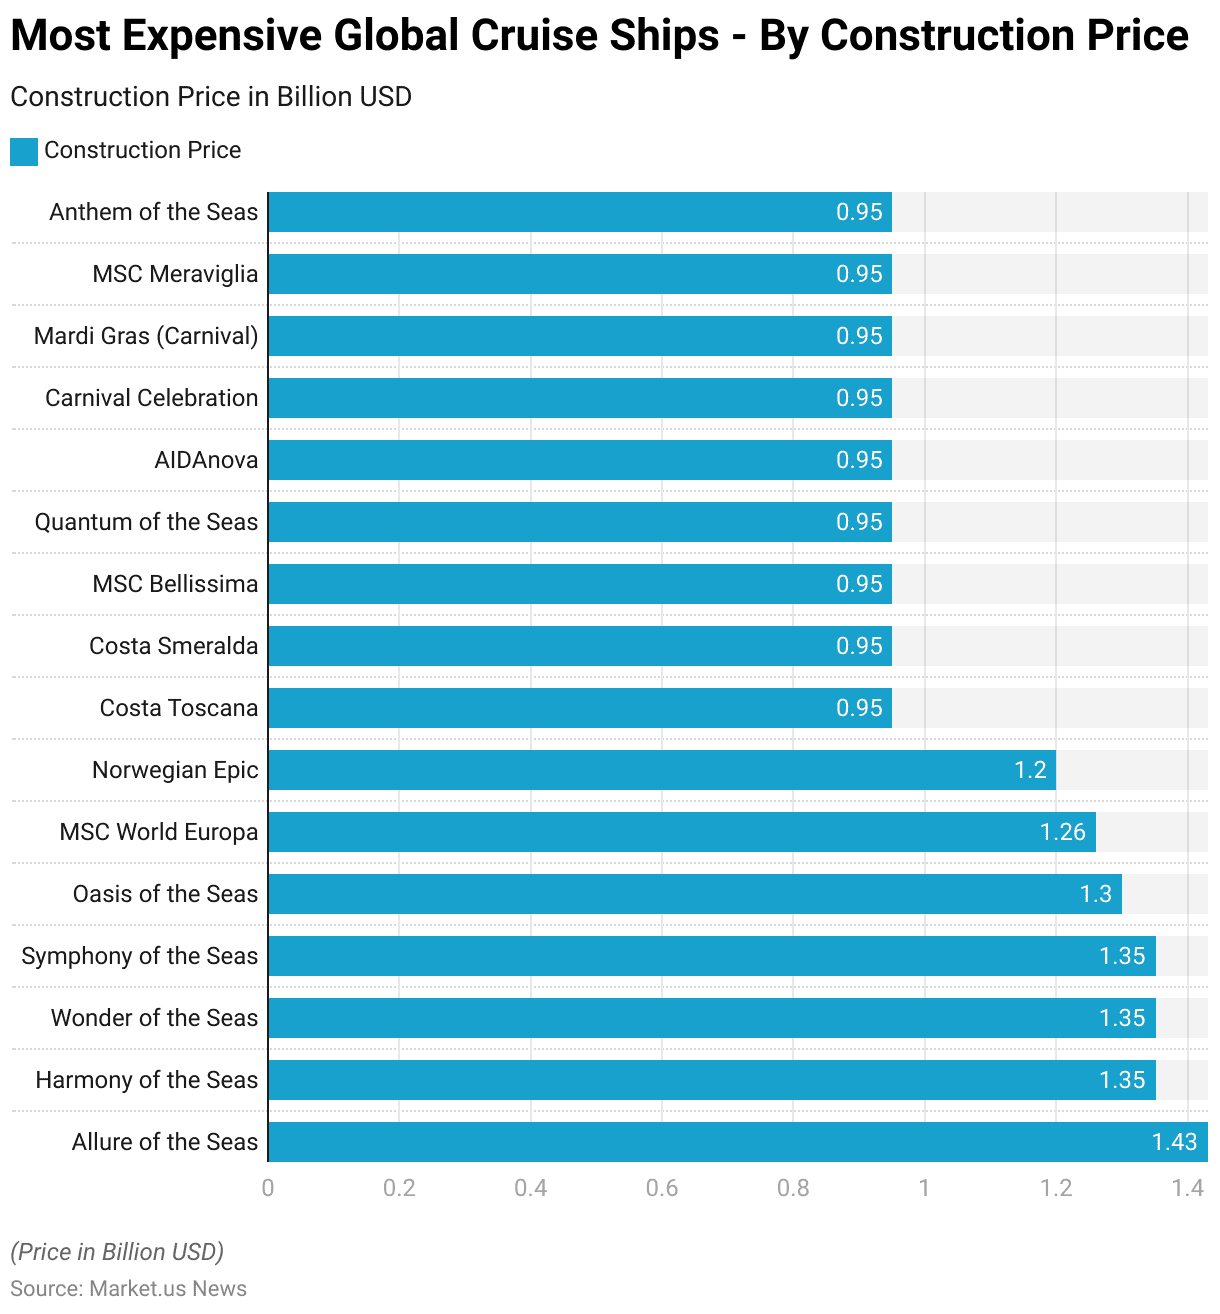
Most Expensive Global Cruise Ships- By Construction Price
- Topping the list is the Allure of the Seas, constructed for 1.43 billion USD, followed closely by the Harmony of the Seas, Wonder of the Seas, and Symphony of the Seas, each with a construction price of 1.35 billion USD.
- The Oasis of the Seas follows suit at 1.3 billion USD, showcasing a trend of significant investment in these maritime marvels.
- Other notable entries include the MSC World Europa, Norwegian Epic, and several ships from Costa, MSC, and Carnival, all constructed at approximately 0.95 billion USD.
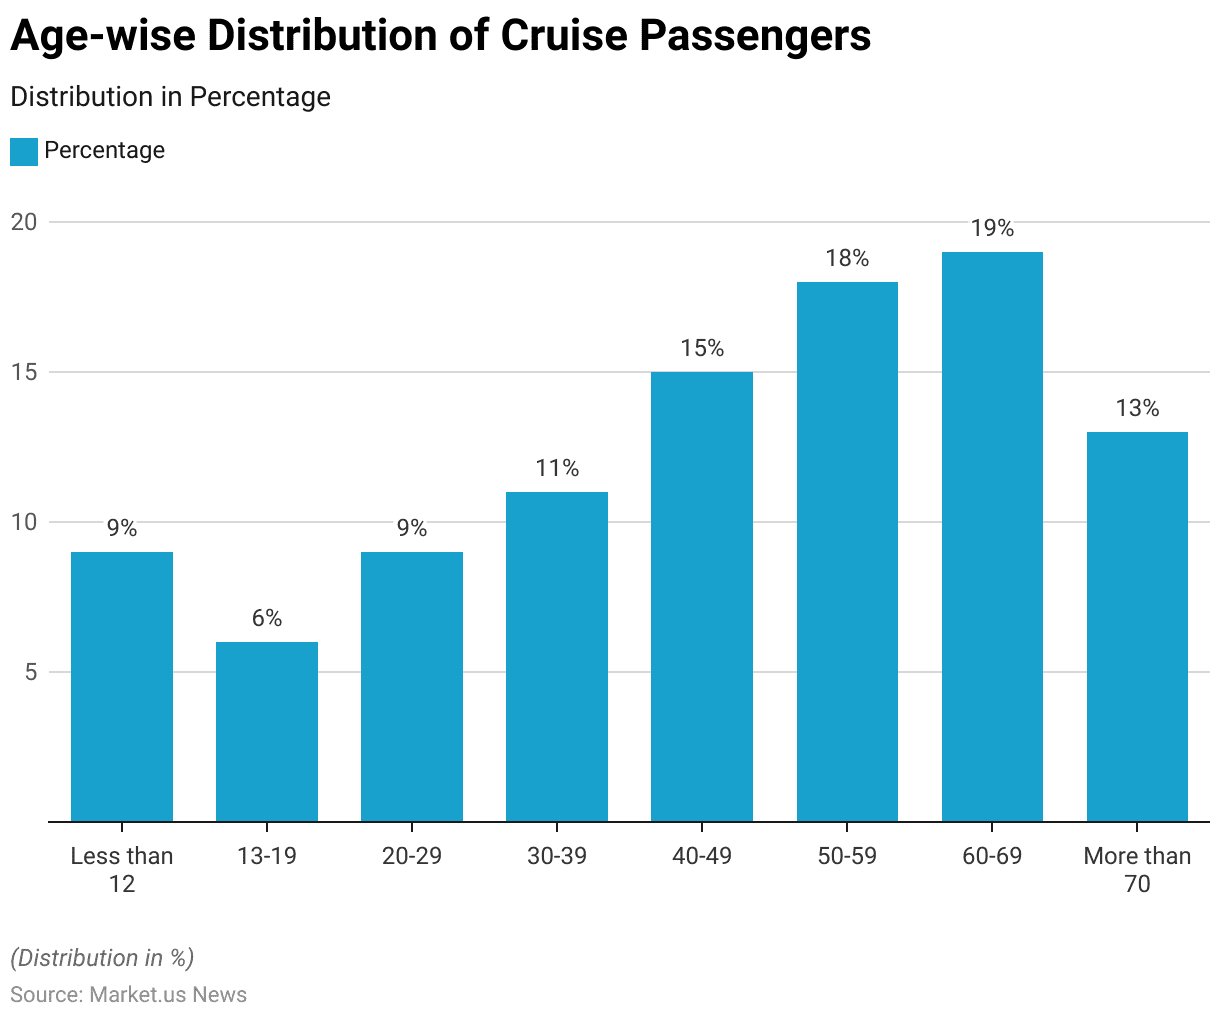
Demographics of Cruise Passengers
Age Group
- Among passengers less than 12 years old, they constitute 9% of the total, indicating a notable presence of families with young children onboard.
- Teenagers aged 13-19 represent 6% of passengers, suggesting a smaller but still significant demographic.
- Young adults aged 20-29 and individuals in their 30s to 40s comprise 9% and 11%, respectively, indicating a modest representation of these age brackets.
- The largest demographic segments are individuals aged 40-49, 50-59, and 60-69, accounting for 15%, 18%, and 19% of passengers respectively.
- Notably, passengers over 70 years old make up 13% of the total, indicating a significant portion of older adults who partake in cruise travel.
Gender
- In 2017, the cruise industry saw a total of 222,000 passengers visiting New Zealand ports, with a noteworthy trend towards female passengers outnumbering males with a ratio of 121 to 100.
- This reflects the prevailing notion of cruising as a popular choice among older adults, as three-quarters of these passengers fell within the 50 to 80 age range.
- Particularly striking was the gender imbalance within the 50 to 69 age group, where female passengers significantly outnumbered males, with 63,000 women compared to 46,000 men.
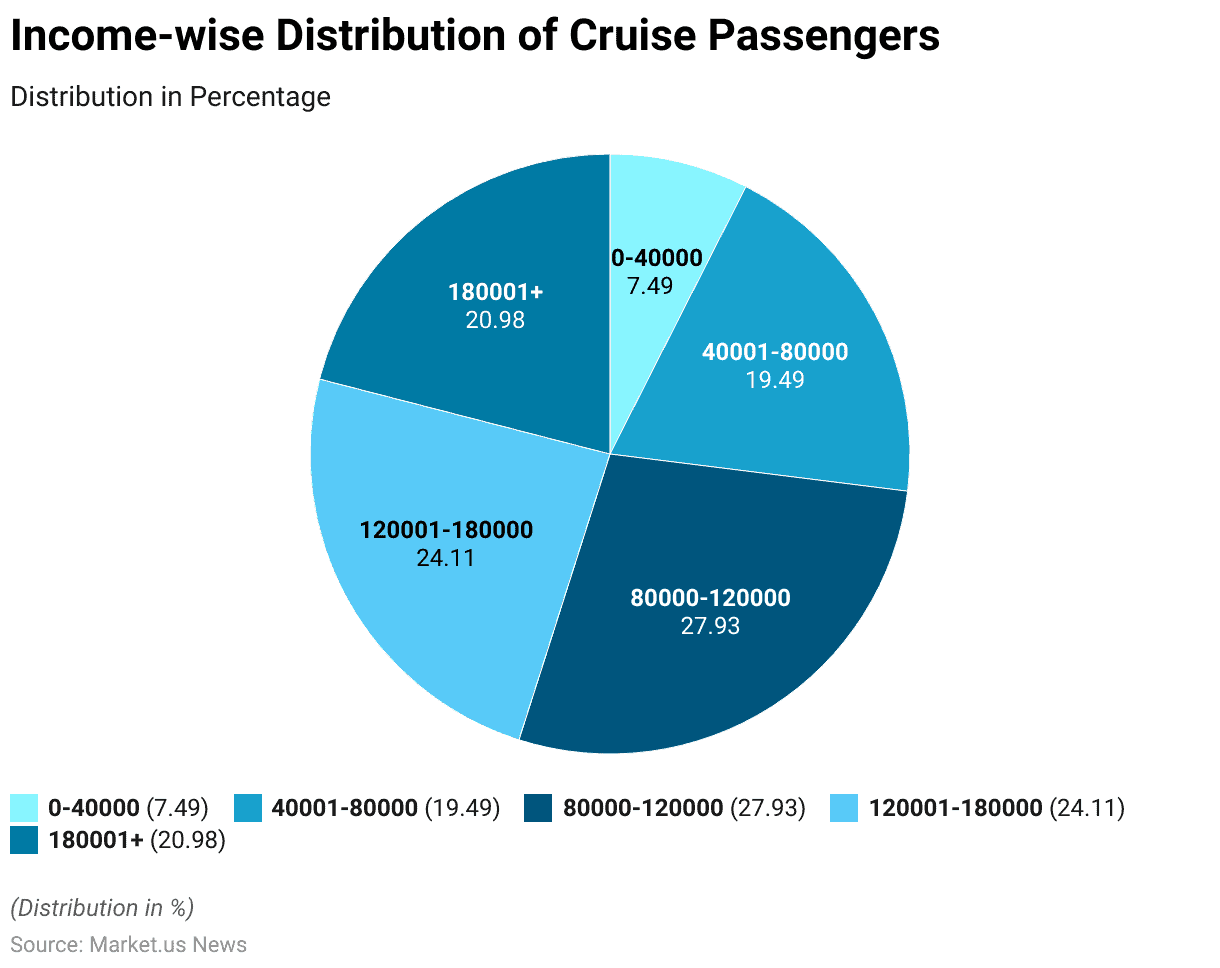
Income
- Among cruise passengers, 7.49% fall within the income range of 0-40,000, indicating a segment of more budget-conscious travelers.
- The largest portion of passengers, comprising 27.93%, earn between $80,000 and $120,000, suggesting a significant representation of middle to upper-middle-income individuals.
- Similarly, 19.49% of passengers earn between $40,001 and $80,000, reflecting a diverse mix of middle-income earners.
- The demographic profile continues to diversify, with 24.11% falling within the $120,001-$180,000 income range, indicating a substantial presence of upper-middle-class passengers.
- Lastly, 20.98% of passengers belong to the highest income bracket of $180,001 and above, representing a segment of affluent travelers within the cruise industry.
Cruise Passenger Attitudes and Behaviour
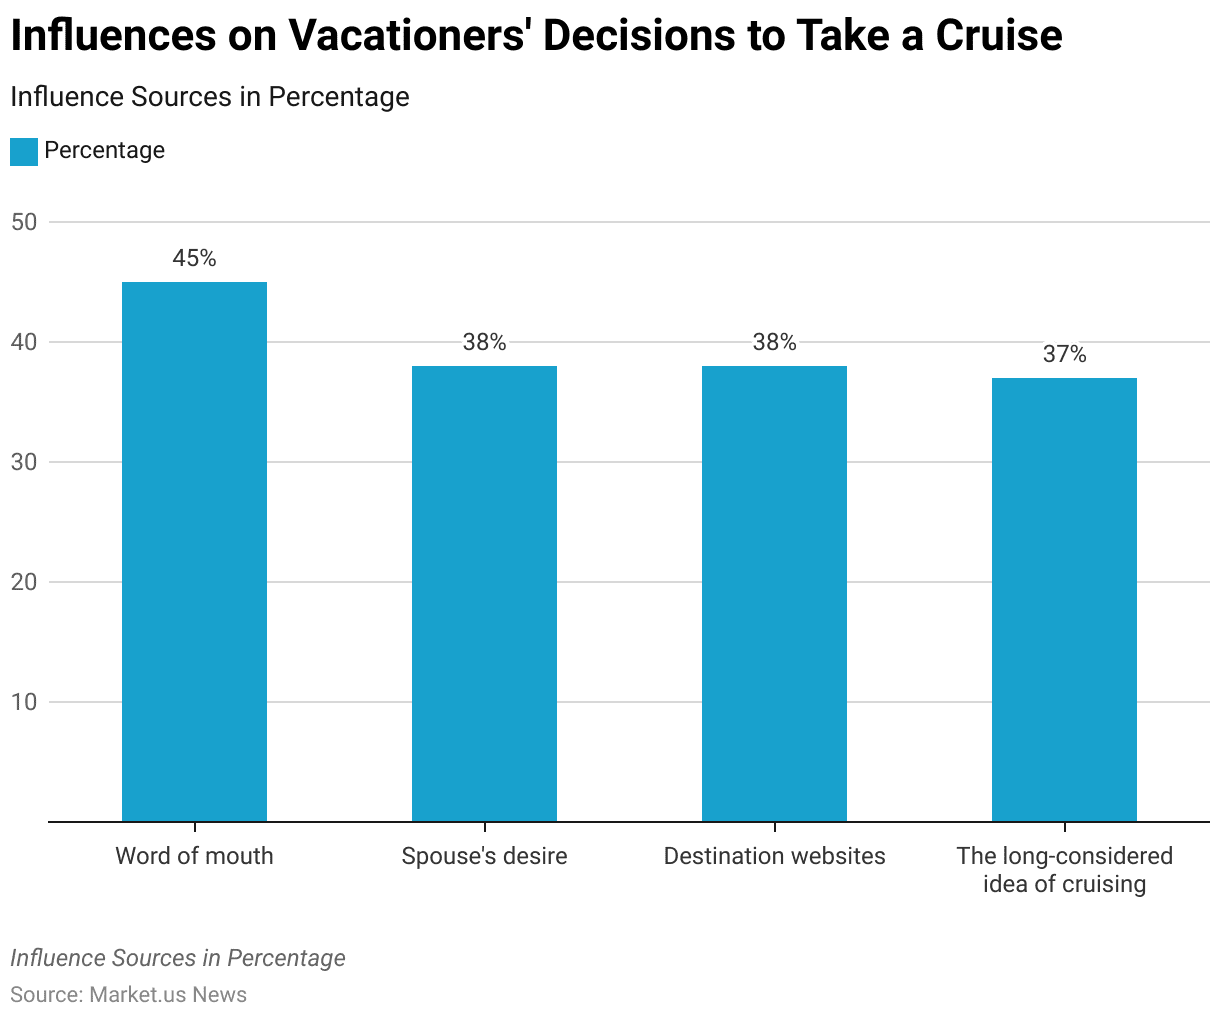
Influences on Vacationers’ Decisions to Take a Cruise
- When considering the prospect of taking a cruise, vacationers are influenced by a variety of factors.
- The most significant influence is word of mouth, which affects 45% of potential passengers.
- Close behind, the desires of a spouse and the allure of destination websites each impact 38% of individuals.
- Additionally, a long-standing consideration of cruising as a vacation option influences 37% of those surveyed.
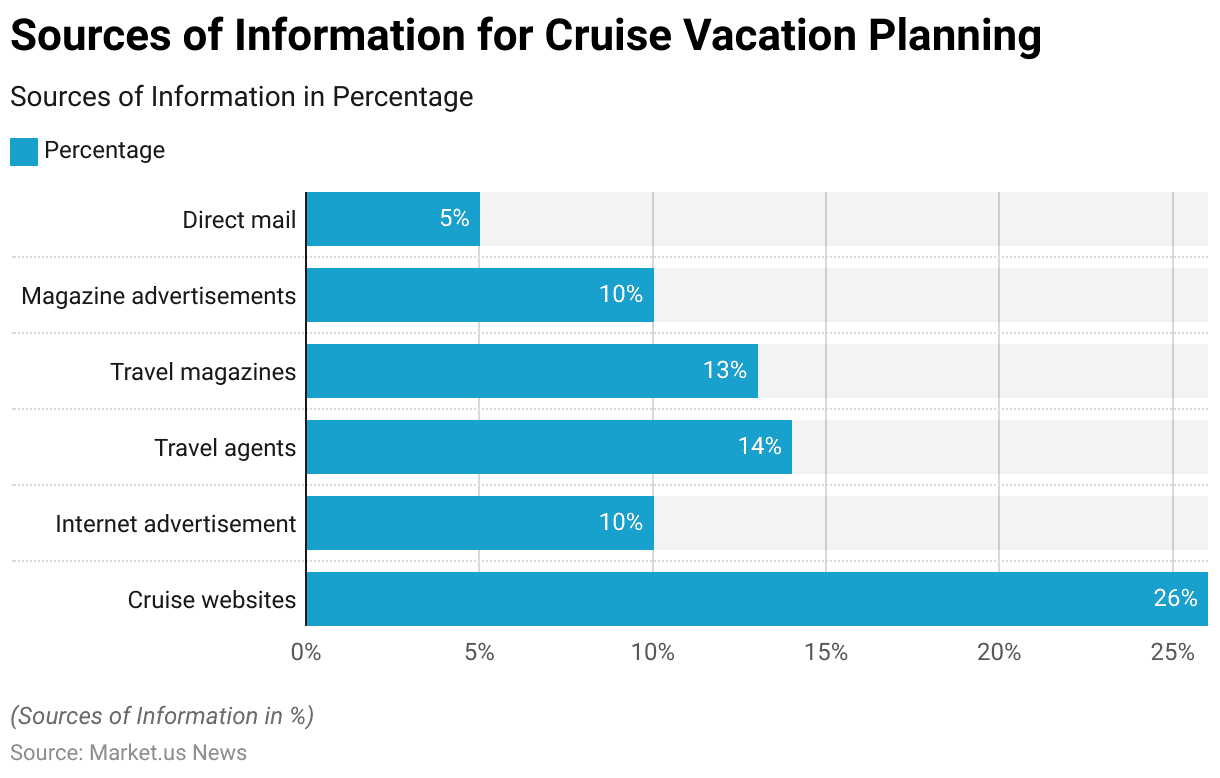
Sources of Information for Cruise Vacation Planning
- When planning a cruise vacation, potential travelers consult various information sources.
- The most commonly used source is cruise websites, which are utilized by 26% of travelers.
- Other significant sources include travel agents, who are consulted by 14% of individuals, and travel magazines, which influence 13%.
- Internet advertisements and magazine advertisements both hold an equal sway, each capturing the attention of 10% of planners.
- Direct mail, though less frequently used, still plays a role for 5% of those planning their cruise vacations.
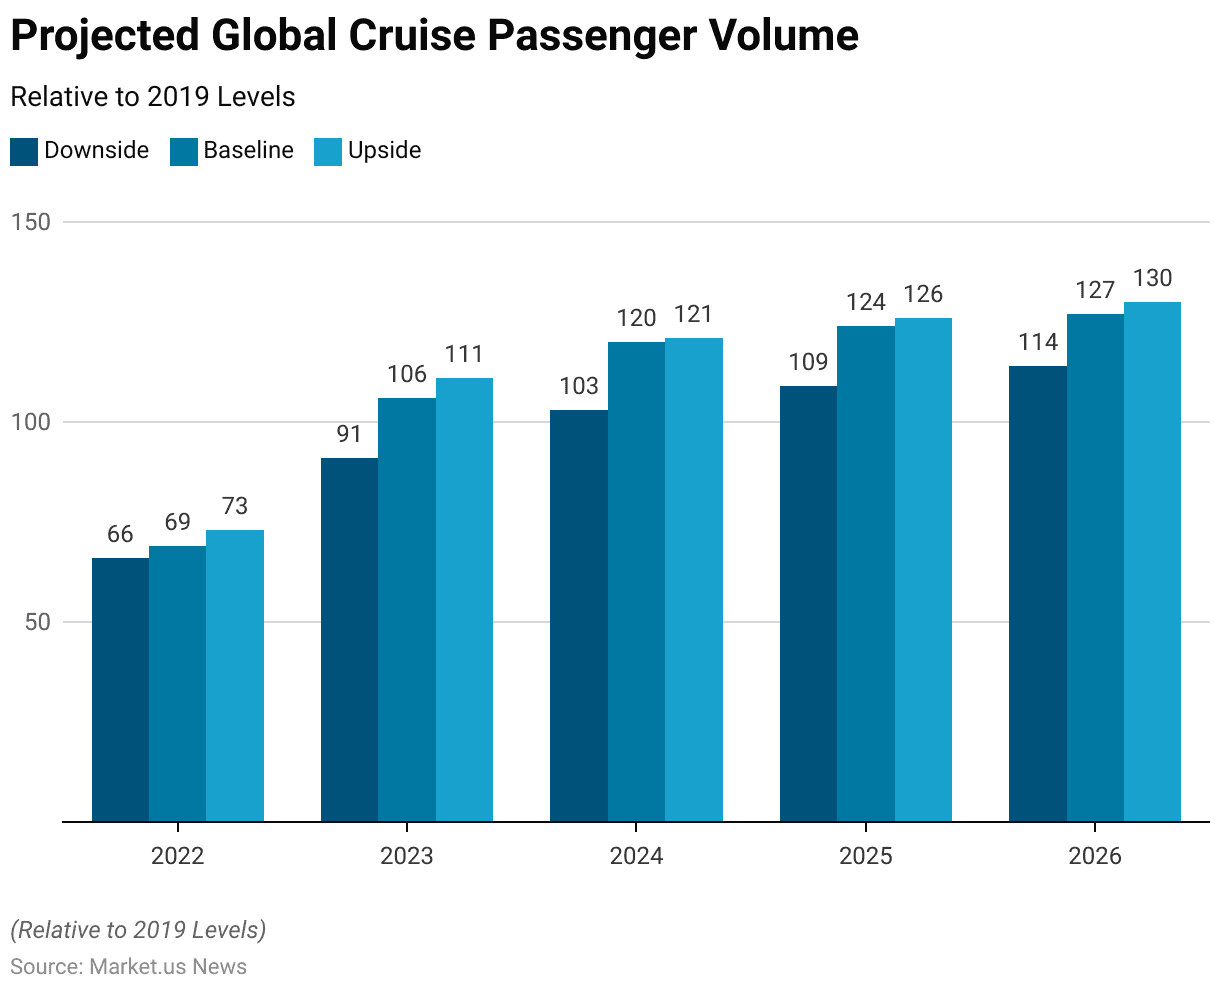
Cruise Tourism Future Projections
- The projected global cruise passenger volume shows varied growth trajectories from 2022 through 2026, indexed relative to the year 2019, which is set as a baseline of 100.
- In 2022, the downside projection stands at 66, with a baseline of 69 and an upside potential reaching 73.
- The following year, 2023, sees a substantial increase, with downside figures at 91, baseline at 106, and upside at 111.
- The upward trend persists into 2026, with the downside estimated at 114, the baseline at 127, and the upside reaching 130.
Discuss your needs with our analyst
Please share your requirements with more details so our analyst can check if they can solve your problem(s)