Table of Contents
- Introduction
- Editor’s Choice
- Consumer Electronics Market Overview
- Average Revenue Per Capita of Consumer Electronics
- Consumer Electronics Production Statistics
- Price of Various Consumer Electronics
- Consumer Electronics Consumption and Sales Statistics
- Top Consumer Electronics Exporters – By Country Statistics
- Top Consumer Electronics Importers by Country Statistics
- Consumer Preferences
- Impact of COVID-19 on the Consumer Electronics Sector Statistics
- Recent Developments
- Conclusion
- FAQs
Introduction
Consumer Electronics Statistics: Consumer electronics encompass a diverse range of everyday electronic devices. Including smartphones, computers, televisions, audio equipment, cameras, gaming consoles, wearables, home appliances, e-readers, and accessories.
These products serve various purposes, such as communication, entertainment, productivity, and utility, catering to the needs and preferences of consumers worldwide.
From compact smartphones to immersive gaming consoles and smart home devices, consumer electronics continue to evolve with advancements in technology, offering enhanced features, connectivity, and convenience.
Editor’s Choice
- The global consumer electronics market revenue is projected to reach USD 1,176.8 billion by 2028.
- In the computing segment, the market size increased from USD 286.9 billion in 2018 to a projected USD 348.5 billion in 2028.
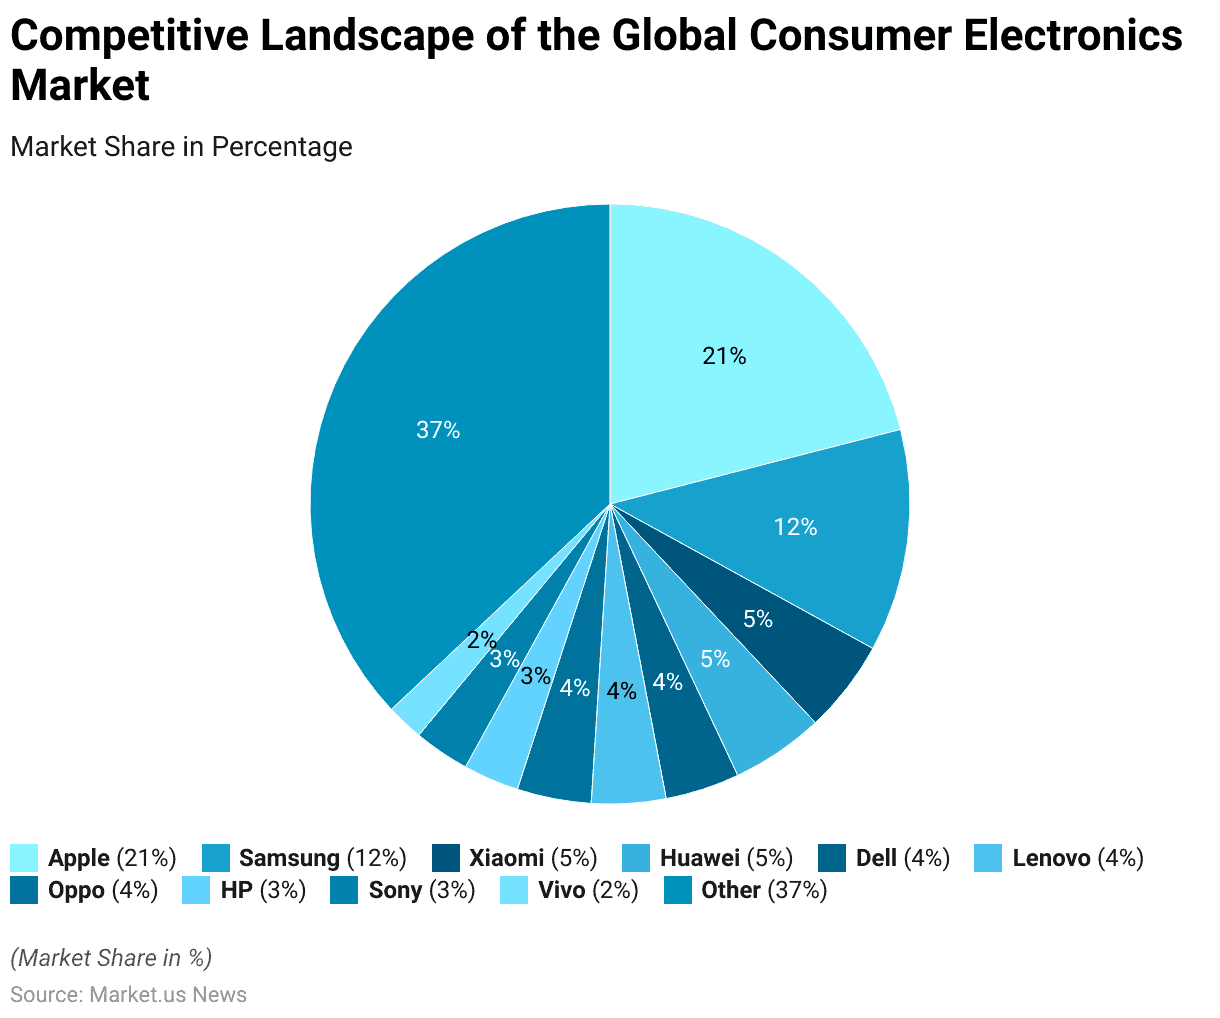
- The global consumer electronics market is dominated by a few major companies. Apple leading the market with a 21% share.
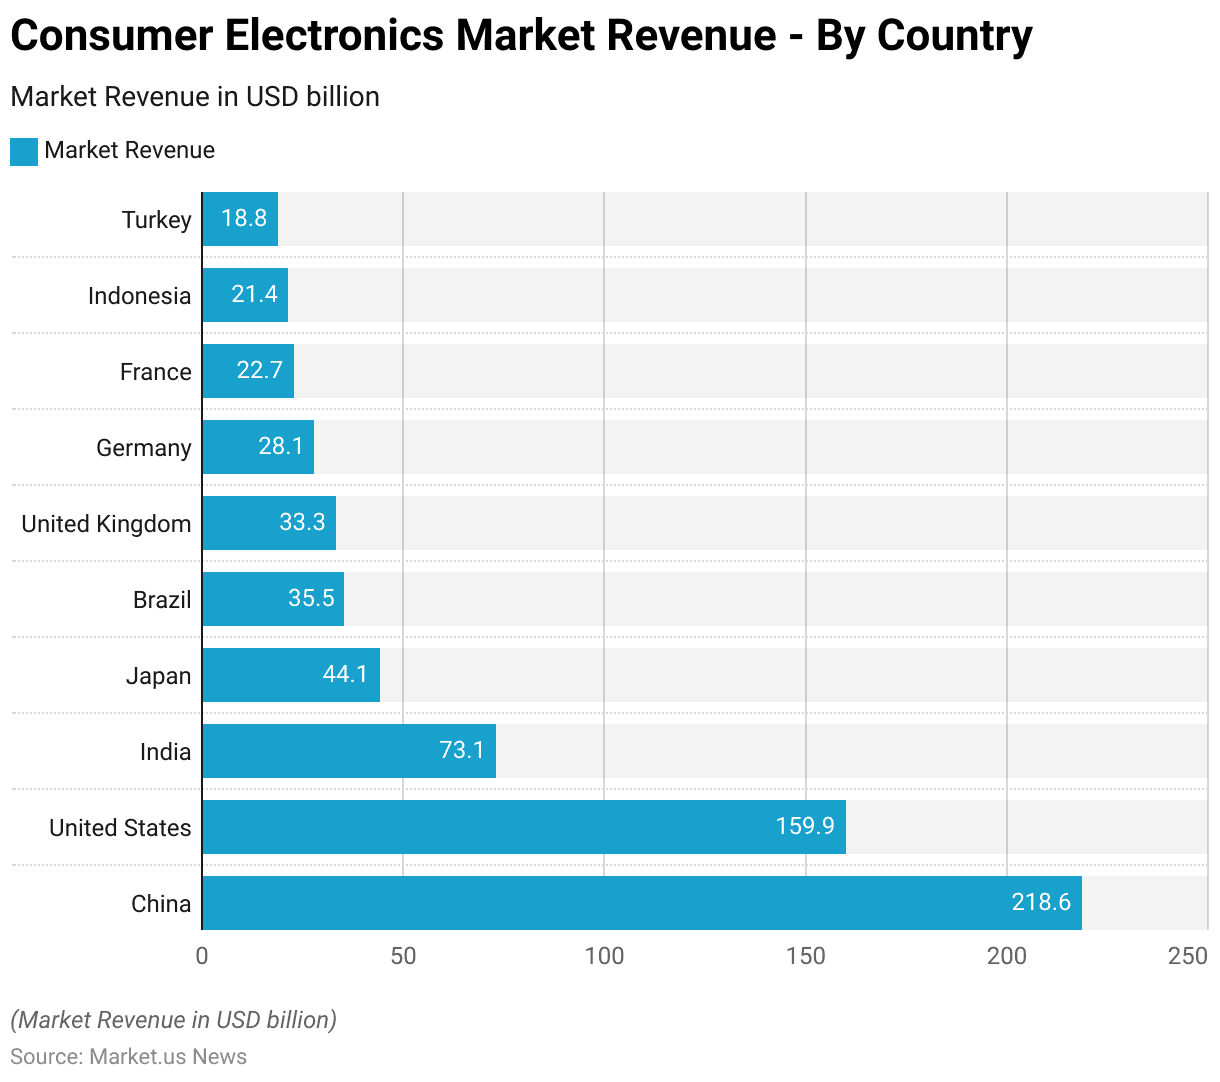
- China leads the global consumer electronics market with a revenue of USD 218.6 billion.
- The total consumer electronics production volume increased from 7,749.2 million pieces in 2018 to a projected 9,014.2 million pieces in 2028.
- The United States leads the consumption, contributing 20-25% of the market share.
- In 2018, American adults spent an average of 90 minutes online daily. Which increased to 2.5 hours per day in 2019. Due to the COVID-19 pandemic, this figure surged to 8 hours per day, significantly boosting the demand for electronic devices.
Consumer Electronics Market Overview
Global Consumer Electronics Market Size Statistics
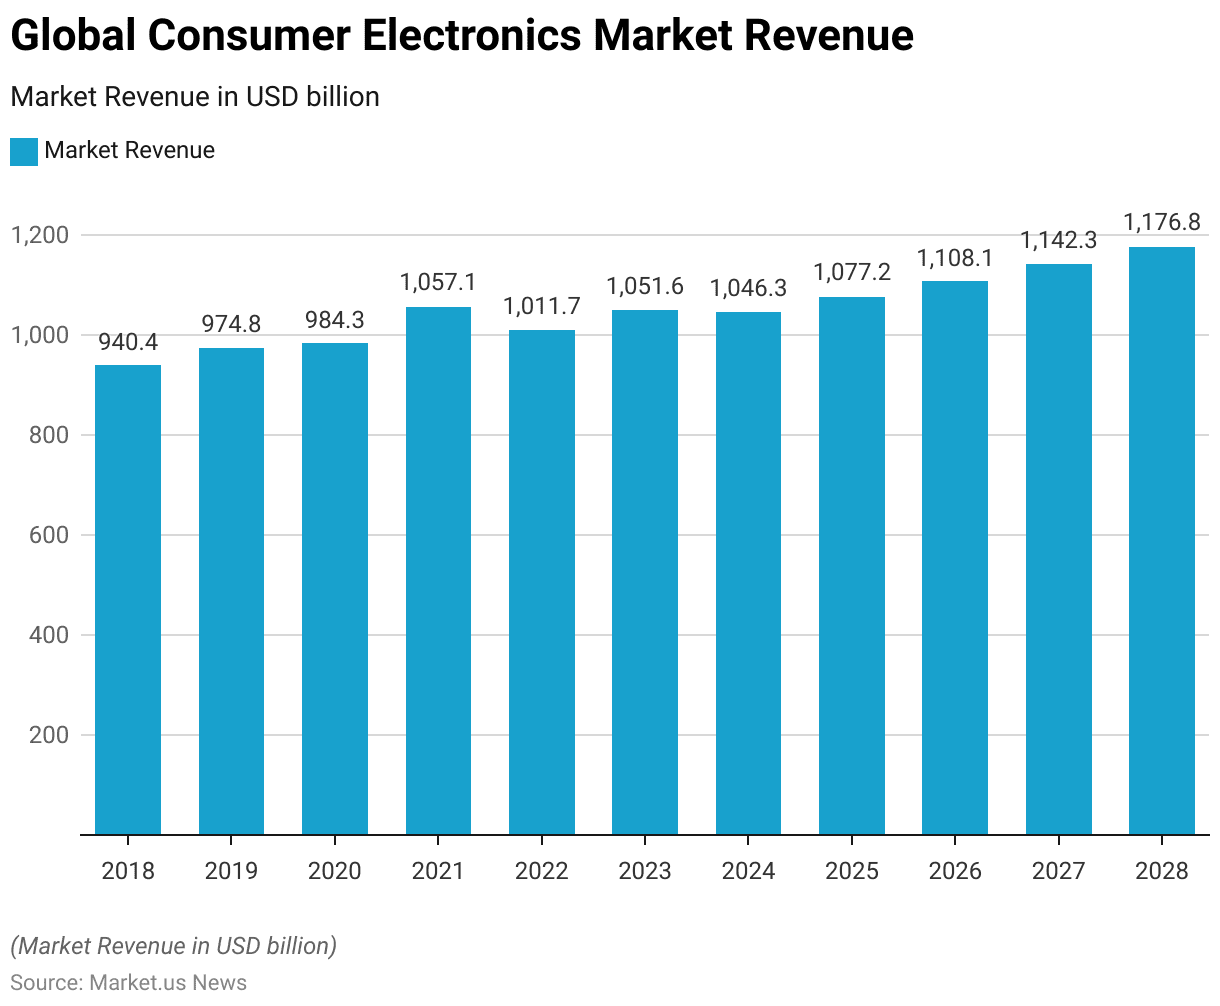
- The global consumer electronics market has experienced significant growth over the past decade at a CAGR of 2.99%, with notable fluctuations in annual revenue.
- In 2018, the market revenue was recorded at USD 940.4 billion. Which increased to USD 974.8 billion in 2019 and further to USD 984.3 billion in 2020.
- A substantial rise was observed in 2021, with revenue reaching USD 1,057.1 billion.
- However, in 2022, the market saw a slight decline to USD 1,011.7 billion.
- The recovery was swift, with revenue climbing back to USD 1,051.6 billion in 2023.
- Projections for the future indicate a steady upward trend, with expected revenues of USD 1,046.3 billion in 2024, USD 1,077.2 billion in 2025, USD 1,108.1 billion in 2026, USD 1,142.3 billion in 2027, and USD 1,176.8 billion in 2028.
- This data reflects the dynamic nature of the consumer electronics market, influenced by technological advancements, consumer demand, and economic conditions.
(Source: Statista)
Global Consumer Electronics Market Size – By Type Statistics
- The global consumer electronics market size, segmented by type, has exhibited notable trends and growth patterns from 2018 to 2028.
- In the computing segment, the market size increased from USD 286.9 billion in 2018 to a projected USD 348.5 billion in 2028.
- The drones segment, although smaller in size, showed growth from USD 2.9 billion in 2018 to USD 4.7 billion in 2028.
- Gaming equipment experienced significant growth, rising from USD 18.1 billion in 2018 to USD 37.7 billion in 2028.
- The telephony segment remained a major contributor, starting at USD 446.1 billion in 2018. With a projected increase to USD 560.1 billion by 2028.
- TV, radio, and multimedia also showed consistent growth, from USD 178.7 billion in 2018 to USD 209.9 billion in 2028.
- Lastly, TV peripheral devices saw an increase from USD 7.7 billion in 2018 to USD 15.9 billion in 2028.
- This data underscores the diverse expansion across different types of consumer electronics, driven by technological advancements and evolving consumer preferences.
(Source: Statista)

Consumer Electronics Market Revenue Change – By Type Statistics
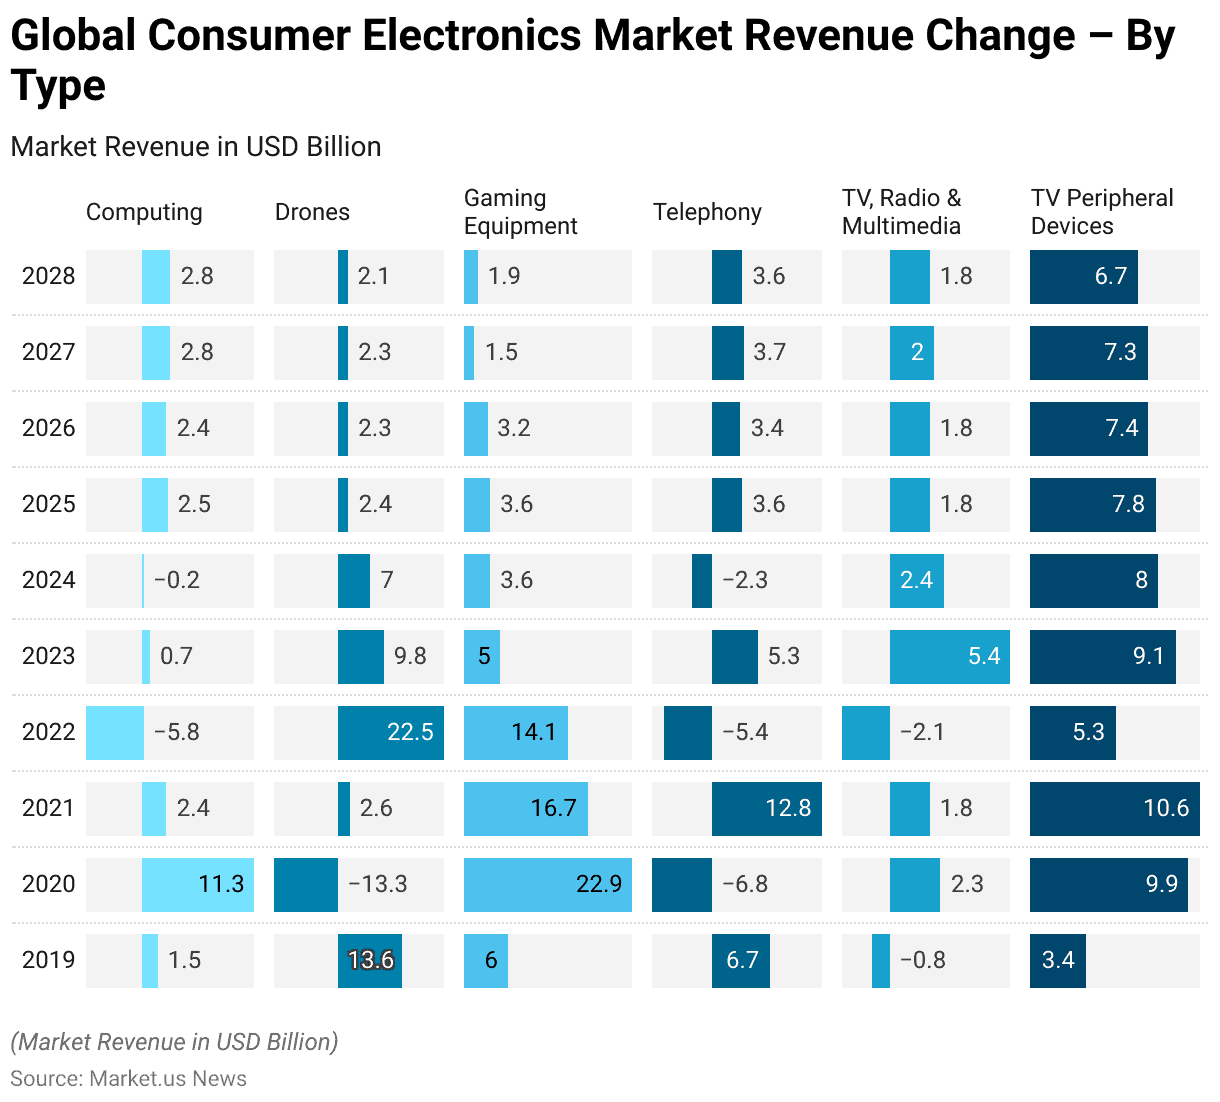
- The global consumer electronics market revenue change, segmented by type, has demonstrated diverse trends from 2019 to 2028.
- In the computing segment, revenue increased by 1.5% in 2019 and saw a significant jump of 11.3% in 2020. However, a decline of 5.8% was observed in 2022, followed by modest growth in subsequent years. With an average increase of around 2.5% annually from 2025 to 2028.
- The drone segment experienced notable fluctuations, with a 13.6% increase in 2019. A sharp decline of 13.3% in 2020, and a substantial recovery with a 22.5% increase in 2022. From 2023 onwards, the growth rate stabilized to a steady 2-9.8% range.
- Gaming equipment showed robust growth, particularly in 2020, with a 22.9% increase. Followed by 16.7% in 2021 and consistent positive growth. Averaging around 3.6% annually from 2024 to 2028.
- The telephony segment experienced a 6.7% increase in 2019, a decline of 6.8% in 2020, and a notable recovery with a 12.8% increase in 2021. Despite a drop of 5.4% in 2022, the segment maintained a steady growth rate of approximately 3.6% from 2025 to 2028.
- The TV, radio, and multimedia segments exhibited minor fluctuations. With a slight decline of 0.8% in 2019 and an average annual increase of around 1.8% from 2024 to 2028.
- TV peripheral devices demonstrated consistent growth. With notable increases such as 9.9% in 2020 and an average growth rate of around 7.5% annually from 2025 to 2028.
- This data reflects the varied performance across different segments of the consumer electronics market. Influenced by technological advancements, consumer preferences, and market dynamics.
(Source: Statista)
Global Consumer Electronics Market Share – By Distribution Channel Statistics
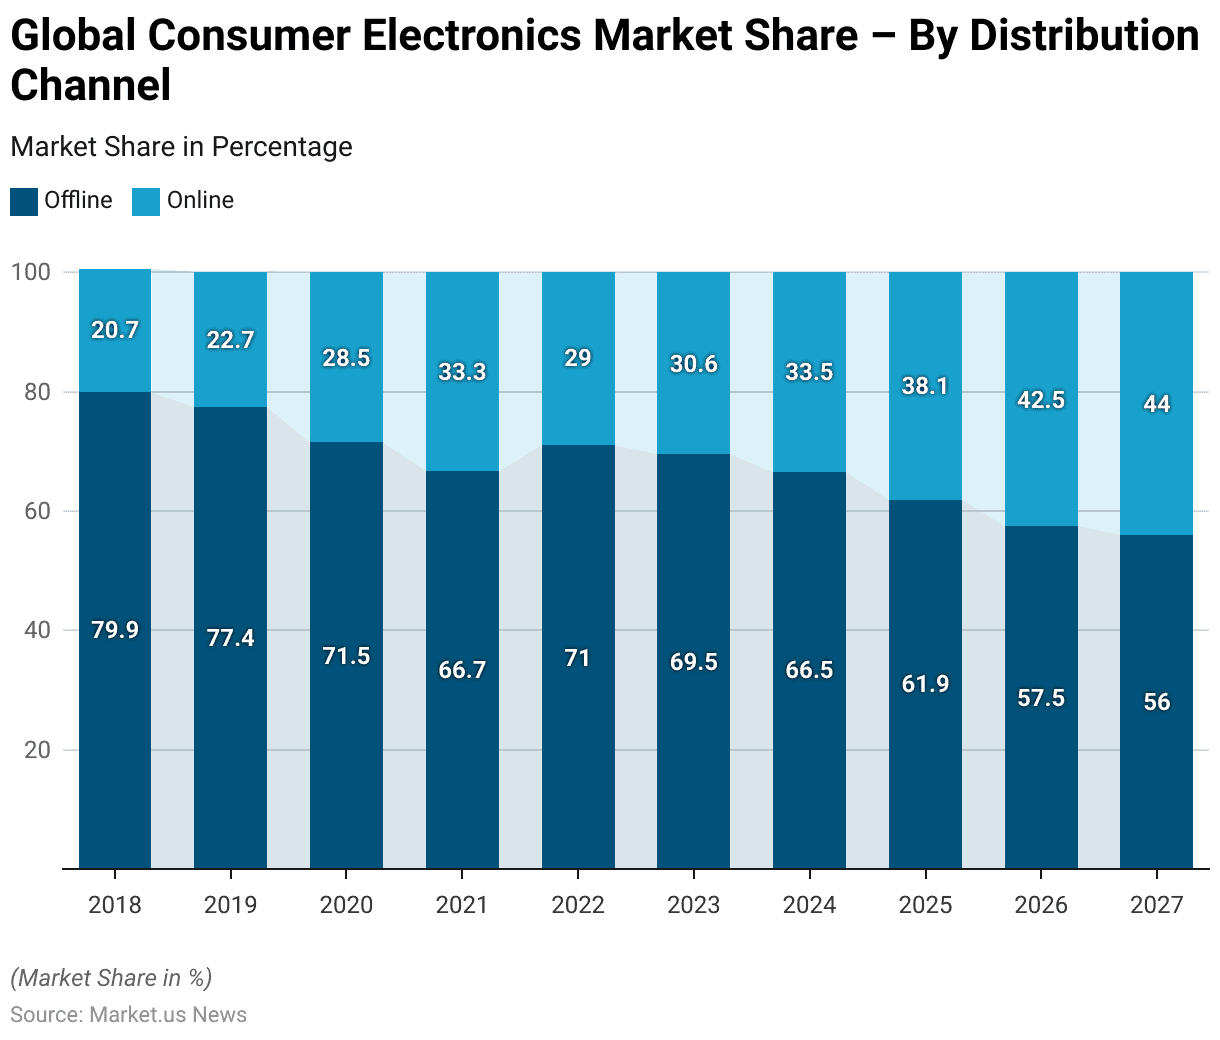
- The global consumer electronics market share, analyzed by distribution channel. It has shown a significant shift from offline to online sales between 2018 and 2027.
- In 2018, offline sales dominated the market with a share of 79.9%, while online sales accounted for only 20.7%.
- This trend began to change in subsequent years, with offline sales decreasing to 77.4% in 2019 and further to 71.5% in 2020. While online sales increased to 22.7% and 28.5%, respectively.
- The shift became more pronounced in 2021, with offline sales at 66.7% and online sales at 33.3%.
- Despite a slight rebound in offline sales to 71% in 2022, the overall trend towards online sales continued, reaching 30.6% in 2023.
- Projections indicate that by 2024, online sales will account for 33.5%, with offline sales at 66.5%.
- This trend is expected to persist, with online sales anticipated to grow to 38.1% in 2025, 42.5% in 2026, and 44% in 2027, while offline sales decline correspondingly.
- This data highlights the increasing consumer preference for online shopping in the consumer electronics market. Driven by convenience and the expanding e-commerce infrastructure.
(Source: Statista)
Competitive Landscape of the Global Consumer Electronics Market Statistics
- The global consumer electronics market is dominated by a few major companies, with Apple leading the market with a 21% share.
- Samsung holds the second position with a 12% market share, followed by Xiaomi and Huawei, each with a 5% share.
- Dell, Lenovo, and Oppo each capture 4% of the market.
- HP and Sony both hold a 3% share, while Vivo has a 2% share.
- Collectively, these leading companies account for 63% of the market.
- The remaining 37% is comprised of various other companies, reflecting a diverse and competitive landscape within the consumer electronics industry.
(Source: Statista)
Global Consumer Electronics Market Revenue – By Country Statistics
- The global consumer electronics market revenue is significantly concentrated in a few key countries.
- China leads the market with a revenue of USD 218.6 billion, followed by the United States with USD 159.9 billion.
- India ranks third with a market revenue of USD 73.1 billion.
- Japan and Brazil follow with revenues of USD 44.1 billion and USD 35.5 billion, respectively.
- The United Kingdom contributes USD 33.3 billion, while Germany’s market revenue stands at USD 28.1 billion.
- France and Indonesia have market revenues of USD 22.7 billion and USD 21.4 billion, respectively.
- Turkey rounds out the list with a market revenue of USD 18.8 billion.
- This data underscores the prominence of these countries in the global consumer electronics market.
(Source: Statista)
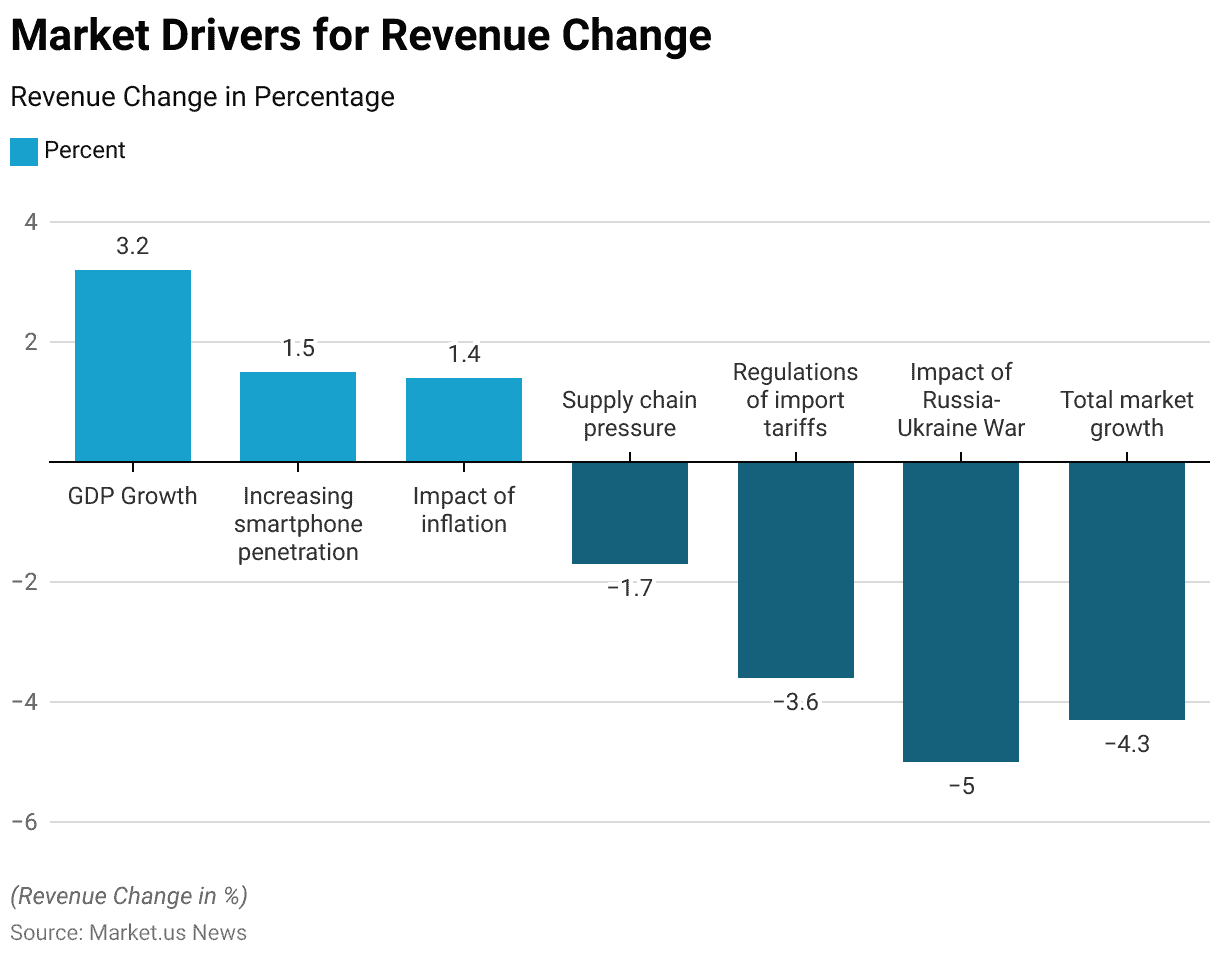
Market Drivers for Revenue Change
- Various drivers and factors influence the global consumer electronics market.
- Positive contributors include GDP growth, which adds 3.2%, and increasing smartphone penetration, contributing 1.5%.
- Additionally, inflation has a minor positive effect of 1.4%.
- However, several negative factors offset these gains. Supply chain pressure results in a 1.7% decline, while regulations of import tariffs contribute to a 3.6% reduction.
- The ongoing Russia-Ukraine war has a significant negative impact, reducing market growth by 5.0%.
- Overall, these factors collectively result in a total market growth decline of 4.3%.
- This data highlights the complex interplay of economic, geopolitical, and regulatory factors shaping the consumer electronics market.
(Source: Statista)
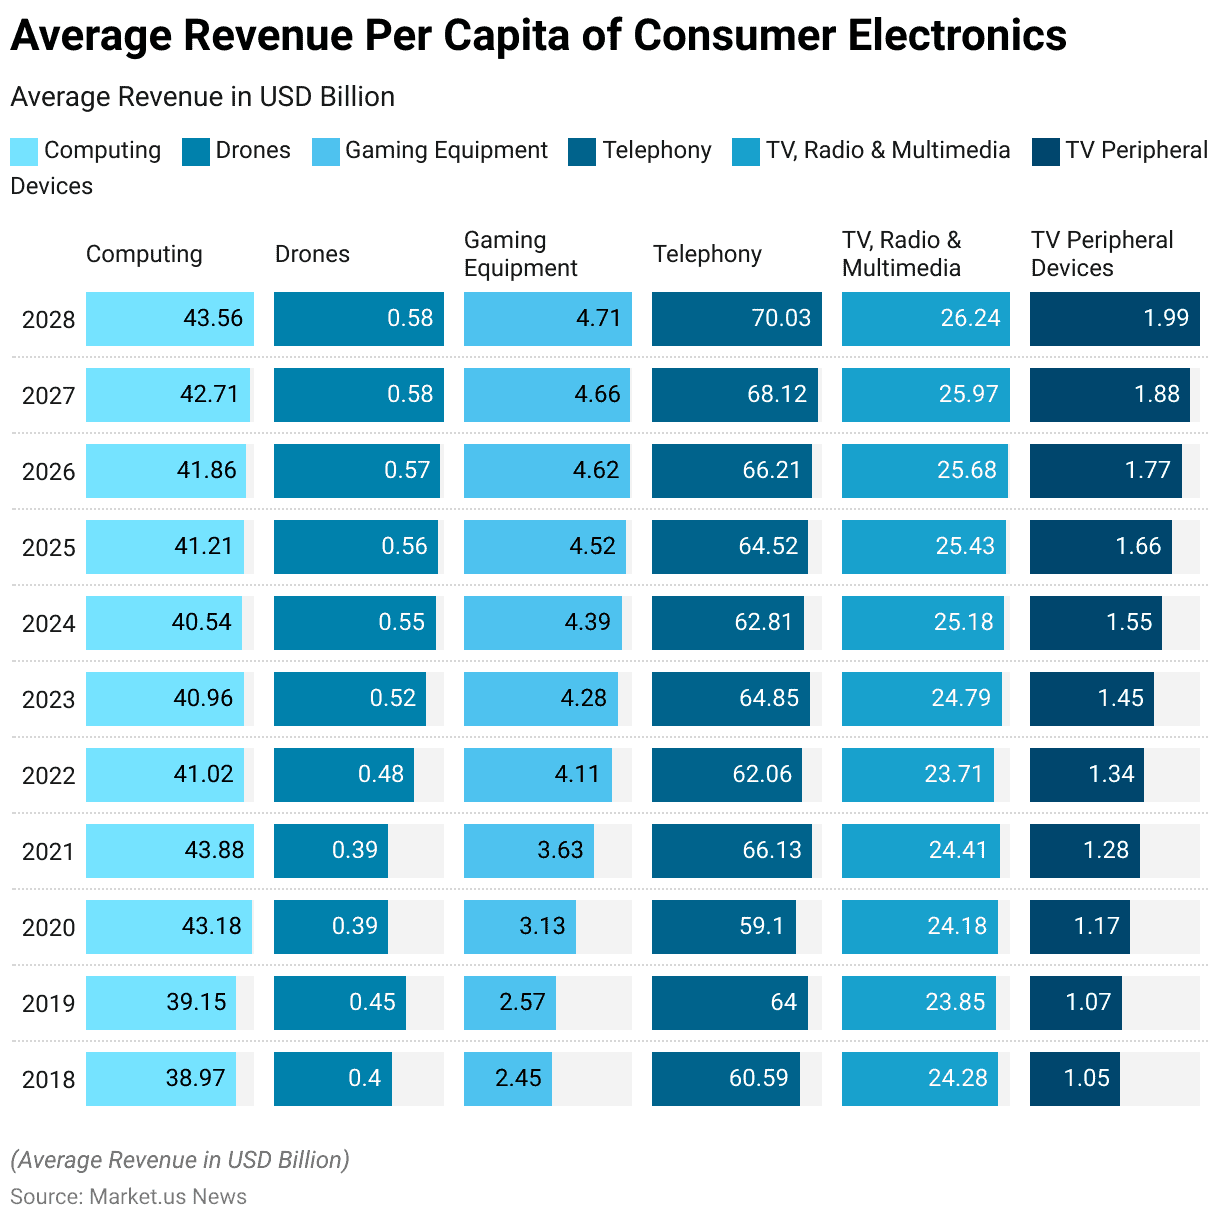
Average Revenue Per Capita of Consumer Electronics
- The average revenue per capita for consumer electronics across various segments has shown distinct trends from 2018 to 2028.
- In the computing segment, the revenue per capita increased from USD 38.97 in 2018 to a projected USD 43.56 in 2028.
- The drones segment, although relatively smaller, rose from USD 0.40 in 2018 to USD 0.58 in 2028.
- Gaming equipment saw significant growth, with revenue per capita increasing from USD 2.45 in 2018 to USD 4.71 in 2028.
- The telephony segment, a major contributor, increased from USD 60.59 in 2018 to a projected USD 70.03 in 2028.
- The TV, radio, and multimedia segment exhibited steady growth, from USD 24.28 in 2018 to USD 26.24 in 2028.
- Lastly, the TV peripheral devices segment showed consistent growth, rising from USD 1.05 in 2018 to USD 1.99 in 2028.
- This data reflects the evolving consumer preferences and increasing expenditure on various types of consumer electronics over the decade.
(Source: Statista)
Consumer Electronics Production Statistics
Production Volume
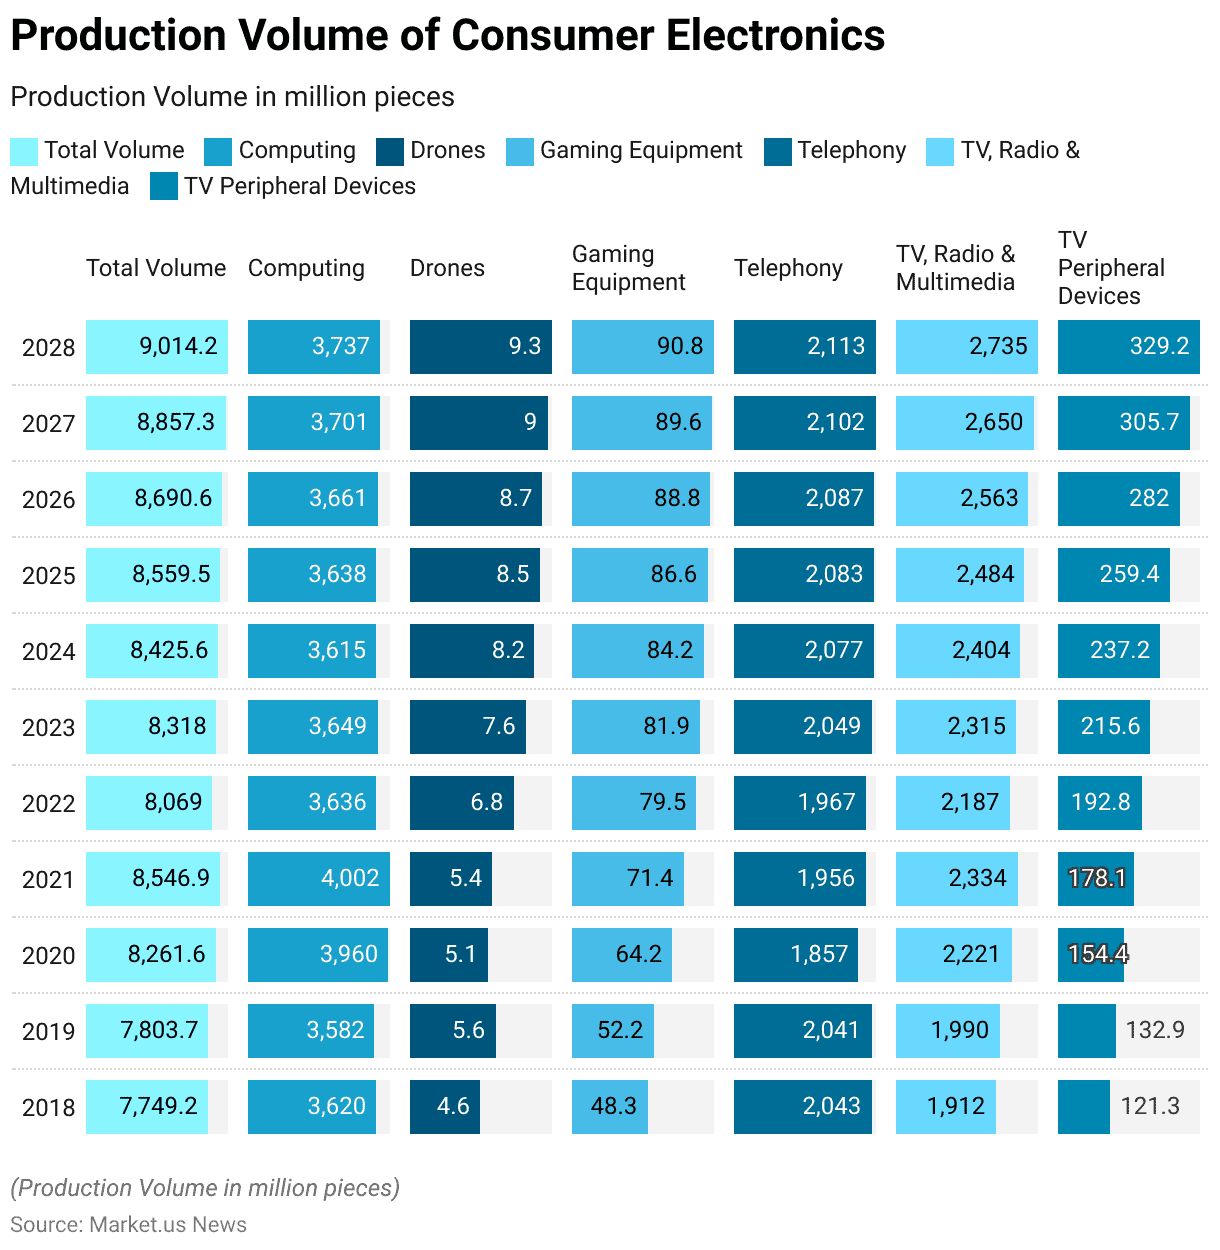
- The production volume of consumer electronics, measured in million pieces, has demonstrated substantial growth across various segments from 2018 to 2028.
- The total production volume increased from 7,749.2 million pieces in 2018 to a projected 9,014.2 million pieces in 2028.
- Within this total, the computing segment grew from 3,620.0 million pieces in 2018 to 3,737.0 million pieces in 2028.
- The drone segment, though smaller in scale, expanded from 4.6 million pieces in 2018 to 9.3 million pieces in 2028.
- Gaming equipment production saw significant growth, rising from 48.3 million pieces in 2018 to 90.8 million pieces in 2028.
- Telephony, a major contributor to the total volume, experienced fluctuations but ultimately increased from 2,043.0 million pieces in 2018 to 2,113.0 million pieces in 2028.
- The TV, radio, and multimedia segment showed a steady increase from 1,912.0 million pieces in 2018 to 2,735.0 million pieces in 2028.
- Lastly, the TV peripheral devices segment exhibited the most dramatic growth, from 121.3 million pieces in 2018 to 329.2 million pieces in 2028.
- This data highlights the dynamic and expanding nature of the consumer electronics production landscape, driven by technological advancements and increasing consumer demand.
(Source: Statista)
Change in Production Volume
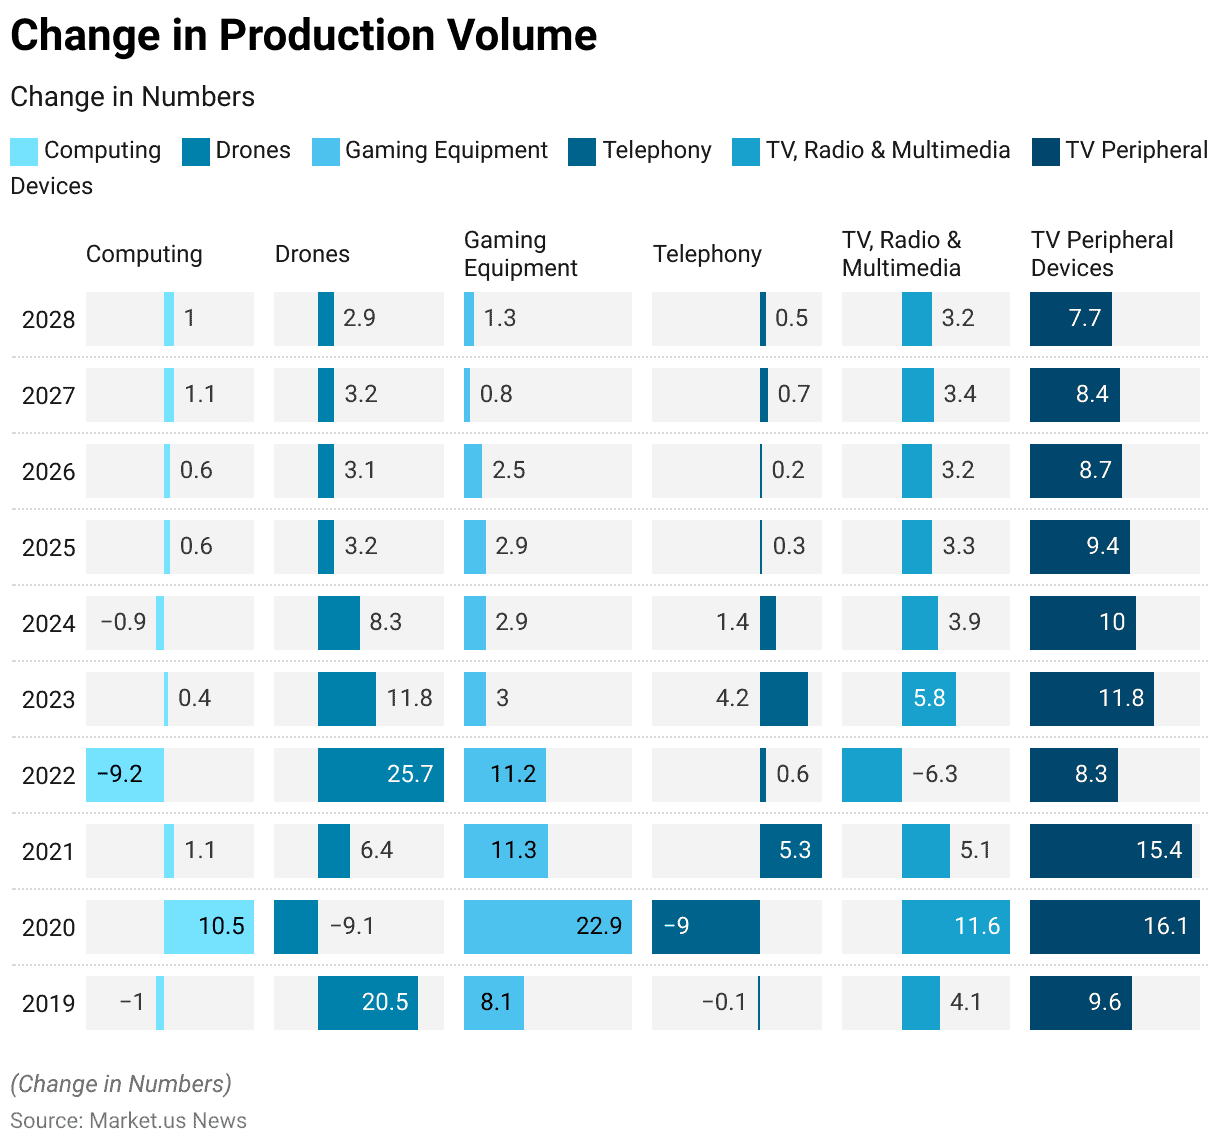
- The change in production volume across various segments of the consumer electronics market from 2019 to 2028 reveals notable trends and fluctuations.
- In the computing segment, production volume saw a decline of 1% in 2019, followed by a significant increase of 10.5% in 2020.
- This was followed by minor fluctuations, with a notable decrease of 9.2% in 2022 and steady growth averaging around 1% annually from 2025 to 2028.
- The drones segment experienced a dramatic increase of 20.5% in 2019, a sharp decline of 9.1% in 2020, and a substantial rise of 25.7% in 2022, with more moderate growth of approximately 3% annually from 2025 to 2028.
- Gaming equipment production volume increased by 8.1% in 2019 and peaked with a 22.9% rise in 2020, followed by consistent growth of around 11.3% in 2021 and an average of 2.5% from 2026 to 2028.
- The telephony segment showed minor fluctuations, with a 0.1% decline in 2019, a significant 9% drop in 2020, and moderate growth averaging around 0.5% annually from 2024 to 2028.
- The TV, radio, and multimedia segment displayed stable growth, with a peak increase of 11.6% in 2020, followed by an average growth of around 3.4% from 2025 to 2028.
- Lastly, the TV peripheral devices segment showed consistent positive growth, with notable increases such as 16.1% in 2020 and an average annual growth of around 10% from 2024 to 2025, gradually decreasing to 7.7% by 2028.
- This data underscores the dynamic and evolving nature of the production landscape in the consumer electronics market, influenced by technological advancements and changing consumer demands.
(Source: Statista)
Price of Various Consumer Electronics
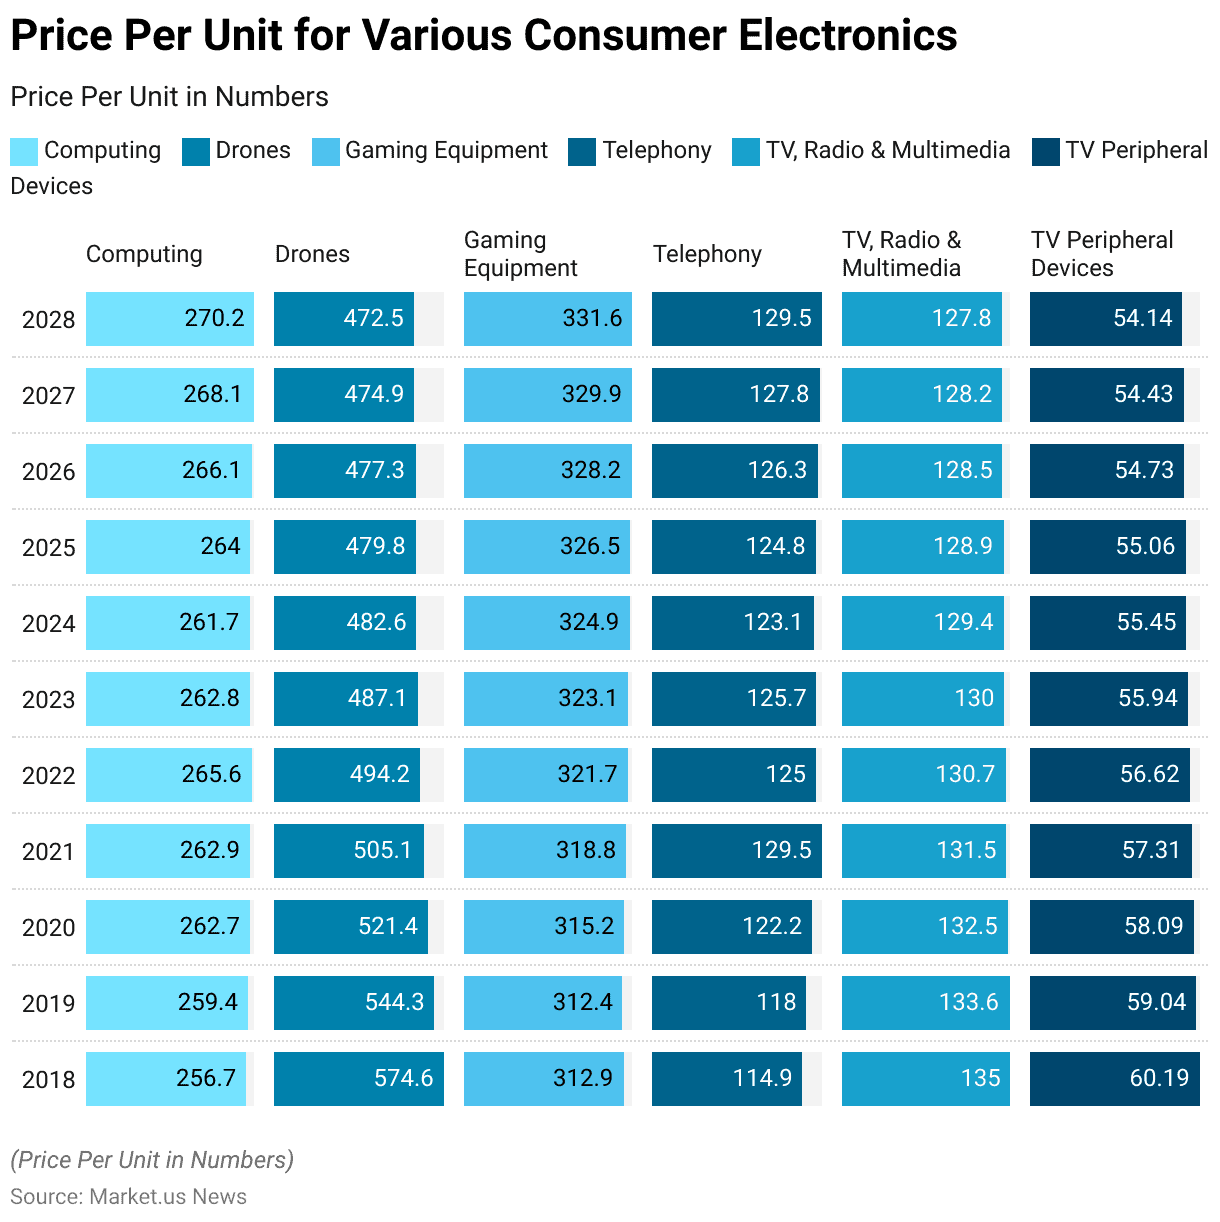
- The price per unit for various consumer electronics segments has shown a mix of stability and slight fluctuations from 2018 to 2028.
- In the computing segment, the price per unit started at USD 256.7 in 2018 and is projected to rise to USD 270.2 by 2028.
- The drones segment saw a decrease from USD 574.6 in 2018 to USD 472.5 in 2028, indicating a gradual reduction in unit prices over the years.
- Gaming equipment prices remained relatively stable, starting at USD 312.9 in 2018 and reaching USD 331.6 in 2028.
- The telephony segment experienced a slight increase in unit prices, from USD 114.9 in 2018 to USD 129.5 in 2028.
- Similarly, the TV, radio, and multimedia segment saw a minor decline from USD 135 in 2018 to USD 127.8 in 2028.
- The TV peripheral devices segment exhibited a gradual decrease in unit prices, starting at USD 60.19 in 2018 and dropping to USD 54.14 by 2028.
- Overall, this data reflects the varying trends in pricing across different consumer electronics segments, influenced by factors such as technological advancements, production efficiencies, and market competition.
(Source: Statista)
Consumer Electronics Consumption and Sales Statistics
Top 10 Consumer Electronics Consumption Countries
- The top 10 countries that consume electronics account for a significant portion of the global market share.
- The United States leads the consumption, contributing 20-25% of the market share, followed closely by China with 18-20%.
- Japan holds a substantial share of 12-14%, while Germany accounts for 8-10%.
- South Korea contributes 7-8% to the market, and the United Kingdom follows with 6-8%.
- France has a market share of 5-6%, and India accounts for 4-5%.
- Both Brazil and Russia each hold a market share of 3-4%.
- This distribution highlights the dominant role of these countries in the global consumer electronics market, driven by high consumer demand and significant purchasing power.
(Source: Electronics and You)
Per-capita Volume Sales in The Consumer Electronics Market Worldwide – By Country
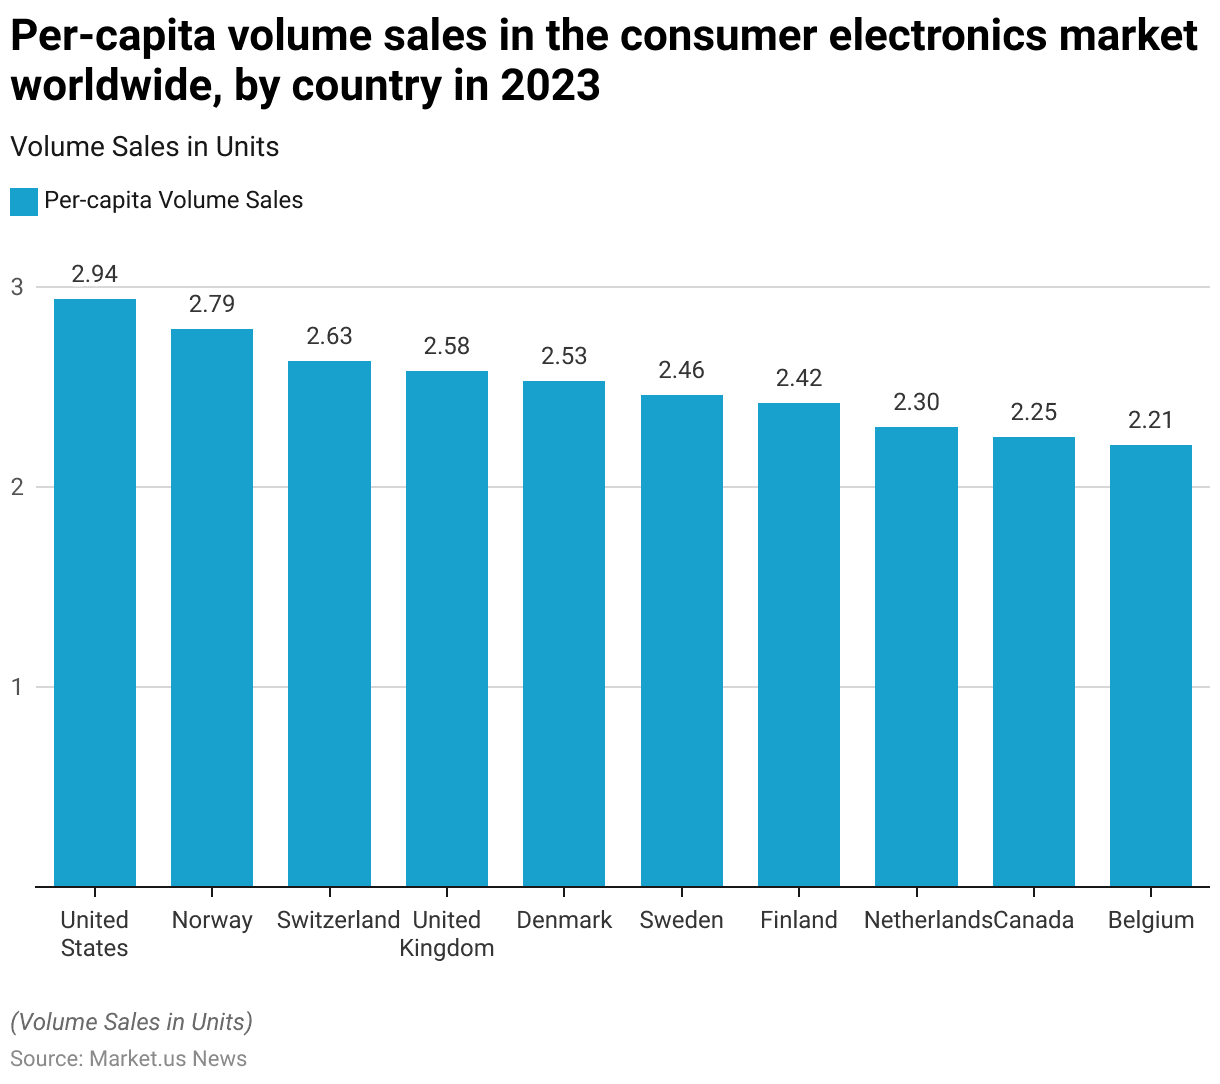
- In 2023, per-capita volume sales in the global consumer electronics market revealed significant consumption patterns across various countries.
- The United States led with 2.94 units per capita, followed by Norway with 2.79 units.
- Switzerland reported 2.63 units per capita, while the United Kingdom had 2.58 units.
- Denmark and Sweden showed high consumption rates of 2.53 and 2.46 units per capita, respectively.
- Finland recorded 2.42 units, and the Netherlands had 2.3 units per capita.
- Canada and Belgium also demonstrated notable per-capita sales, with 2.25 and 2.21 units, respectively.
- This data underscores the high consumer demand for electronics in these countries, reflecting their advanced economies and strong purchasing power.
(Source: Statista)
Top Consumer Electronics Exporters – By Country Statistics
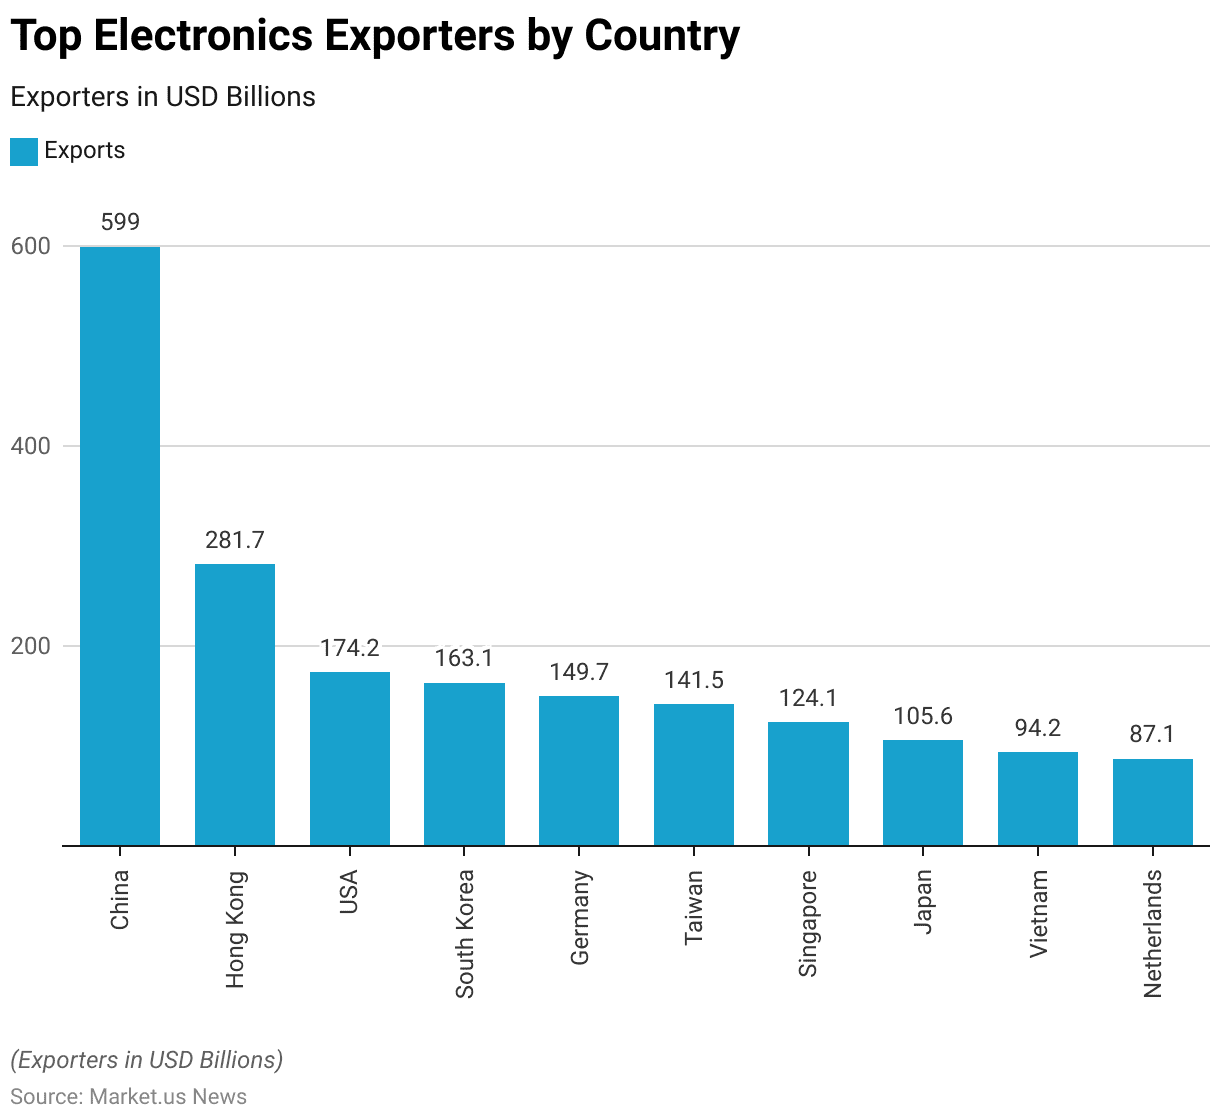
- The top electronics exporters by country in terms of export value highlight the global leaders in the electronics industry.
- China stands at the forefront, with exports valued at USD 599 billion.
- Hong Kong follows with USD 281.7 billion, while the United States ranks third with USD 174.2 billion.
- South Korea and Germany also play significant roles, with exports of USD 163.1 billion and USD 149.7 billion, respectively.
- Taiwan contributes USD 141.5 billion, and Singapore exports USD 124.1 billion worth of electronics.
- Japan’s electronics exports total USD 105.6 billion, while Vietnam and the Netherlands export USD 94.2 billion and USD 87.1 billion, respectively.
- This data reflects the pivotal roles these countries play in the global electronics supply chain, driven by advanced manufacturing capabilities and robust export infrastructures.
(Source: International Trade Centre)
Top Consumer Electronics Importers by Country Statistics
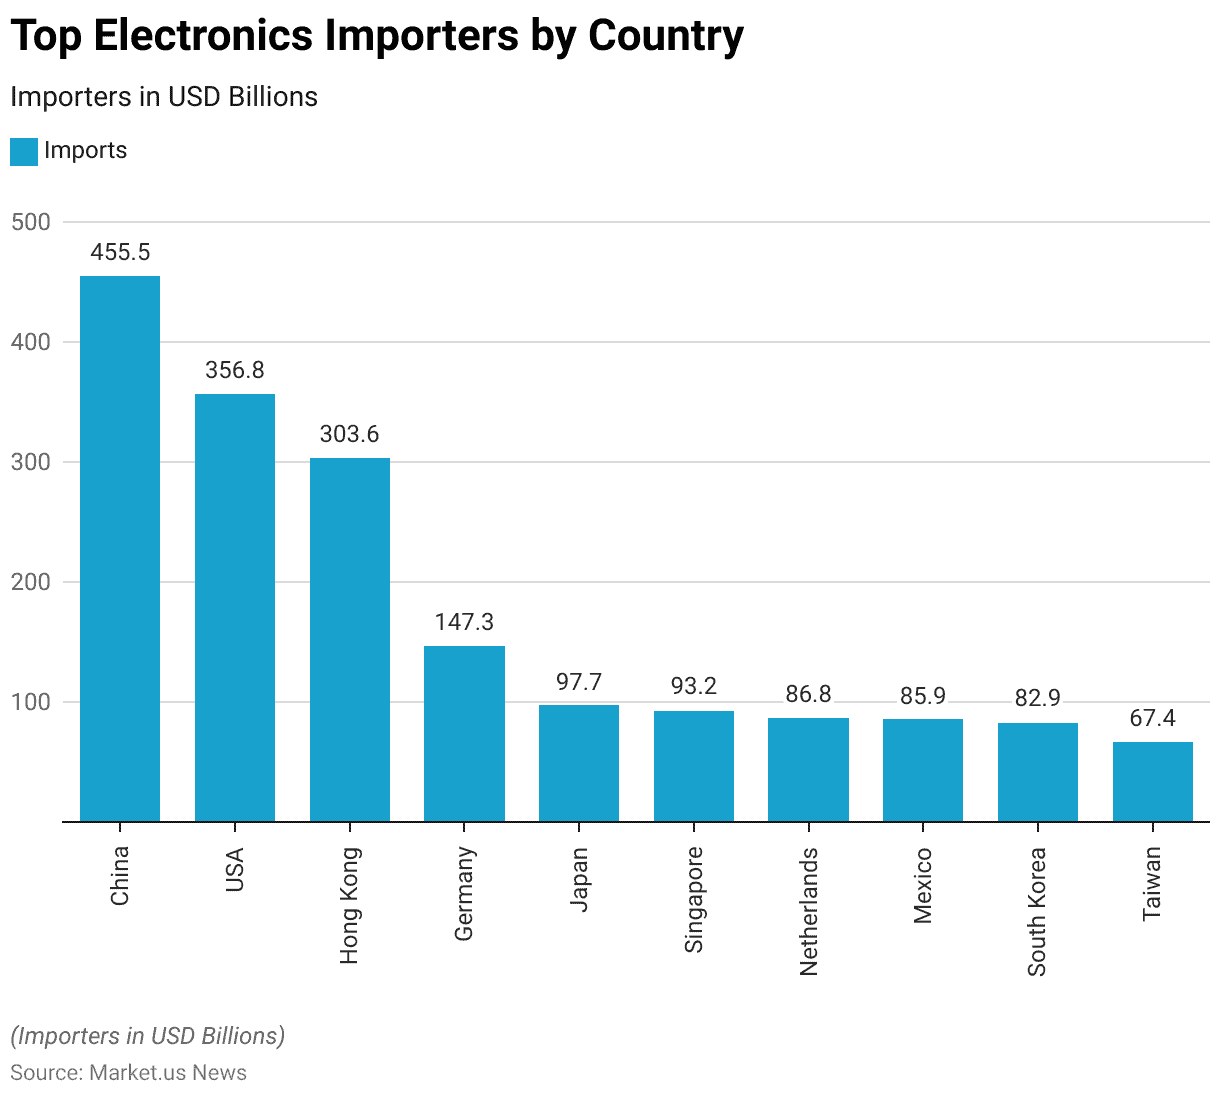
- The top electronics importers by country, measured in USD billions, reveal the major global markets for electronics products.
- China is the largest importer, with imports valued at USD 455.5 billion.
- The United States follows closely with USD 356.8 billion in imports.
- Hong Kong ranks third, importing electronics worth USD 303.6 billion.
- Germany and Japan are also significant importers, with values of USD 147.3 billion and USD 97.7 billion, respectively.
- Singapore imports electronics worth USD 93.2 billion, while the Netherlands and Mexico account for USD 86.8 billion and USD 85.9 billion, respectively.
- South Korea imports USD 82.9 billion worth of electronics, and Taiwan rounds out the top ten with USD 67.4 billion.
- This data underscores the substantial demand for electronics in these countries, reflecting their consumption patterns and the importance of electronics in their economies.
(Source: International Trade Centre)
Consumer Preferences
Consumer Device Ownership Trends
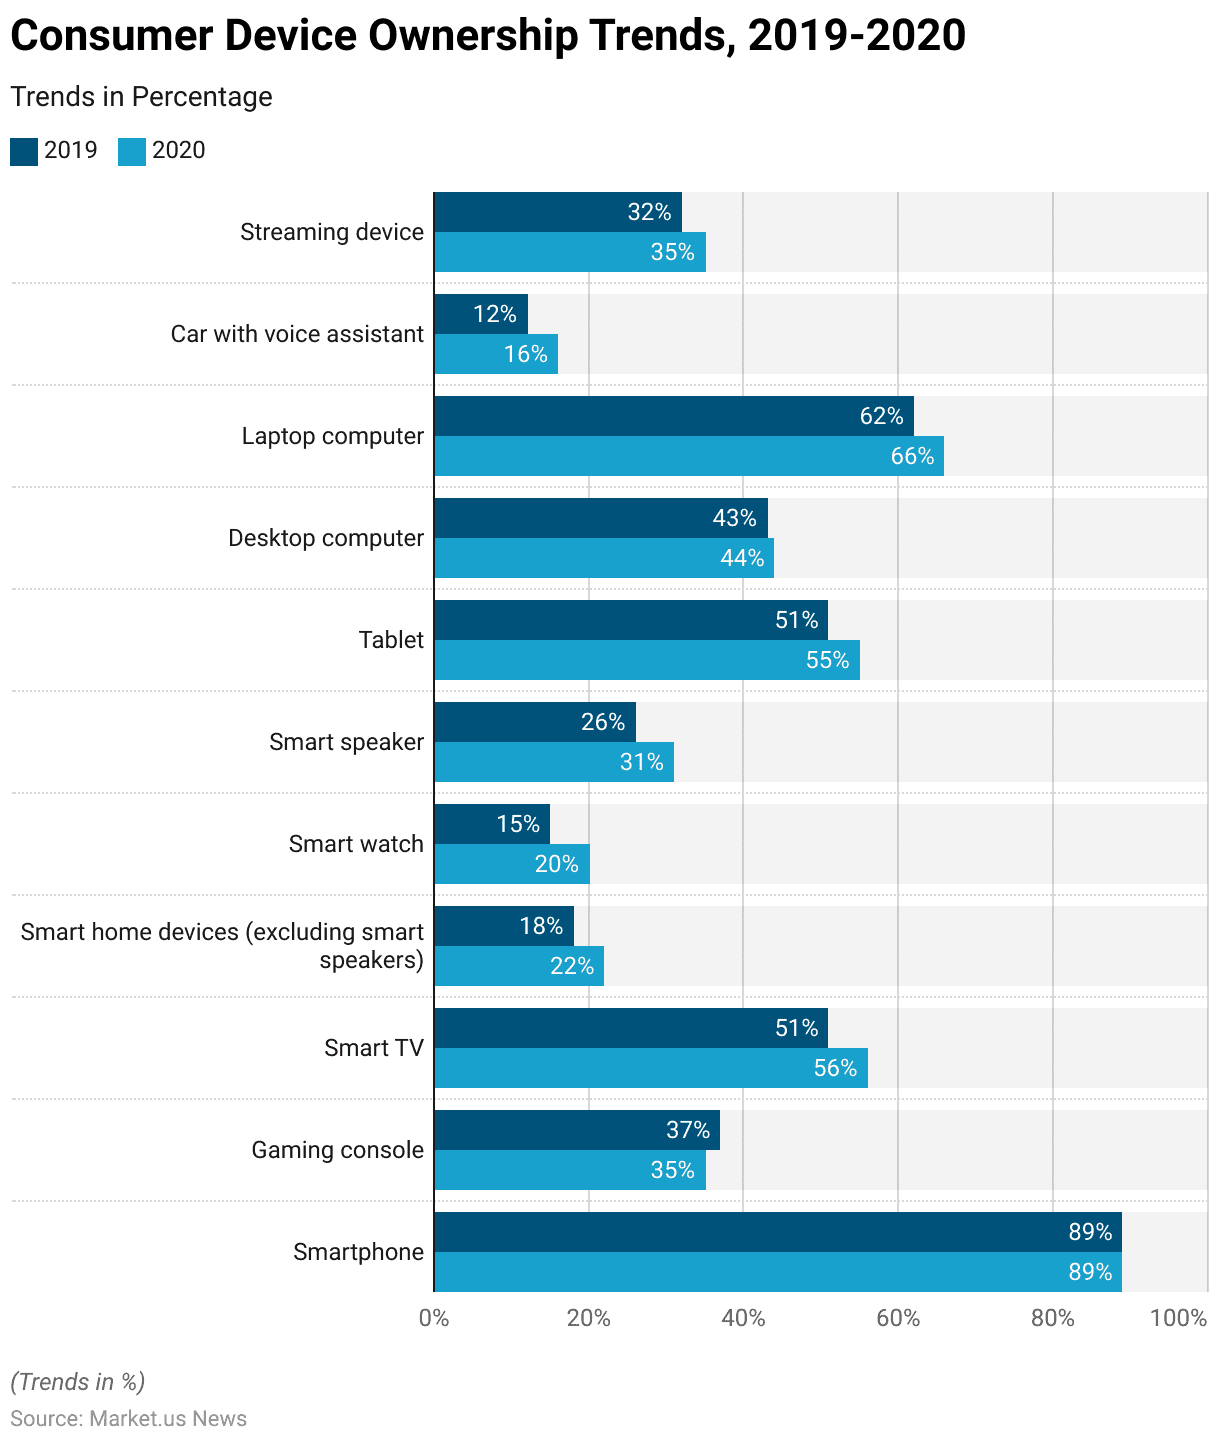
- A survey on device ownership among consumers in 2019 and 2020 revealed notable trends in the adoption of various electronic devices.
- The ownership of smartphones remained steady at 89% for both years.
- Gaming consoles saw a slight decline from 37% in 2019 to 35% in 2020.
- Smart TV ownership increased from 51% to 56%, and smart home devices (excluding smart speakers) rose from 18% to 22%.
- The adoption of smartwatches grew from 15% to 20%, and smart speakers increased from 26% to 31%.
- Tablet ownership rose from 51% to 55%, and desktop computers saw a slight increase from 43% to 44%.
- Laptop ownership also climbed from 62% in 2019 to 66% in 2020.
- Additionally, cars with voice assistants increased from 12% to 16%, and streaming devices grew from 32% to 35%.
- These trends indicate a growing integration of smart technologies into everyday life.
(Source: Adobe Digital Insights: US Consumer Electronics Report- Jan 2020)
Use of Online Reviews and Ratings
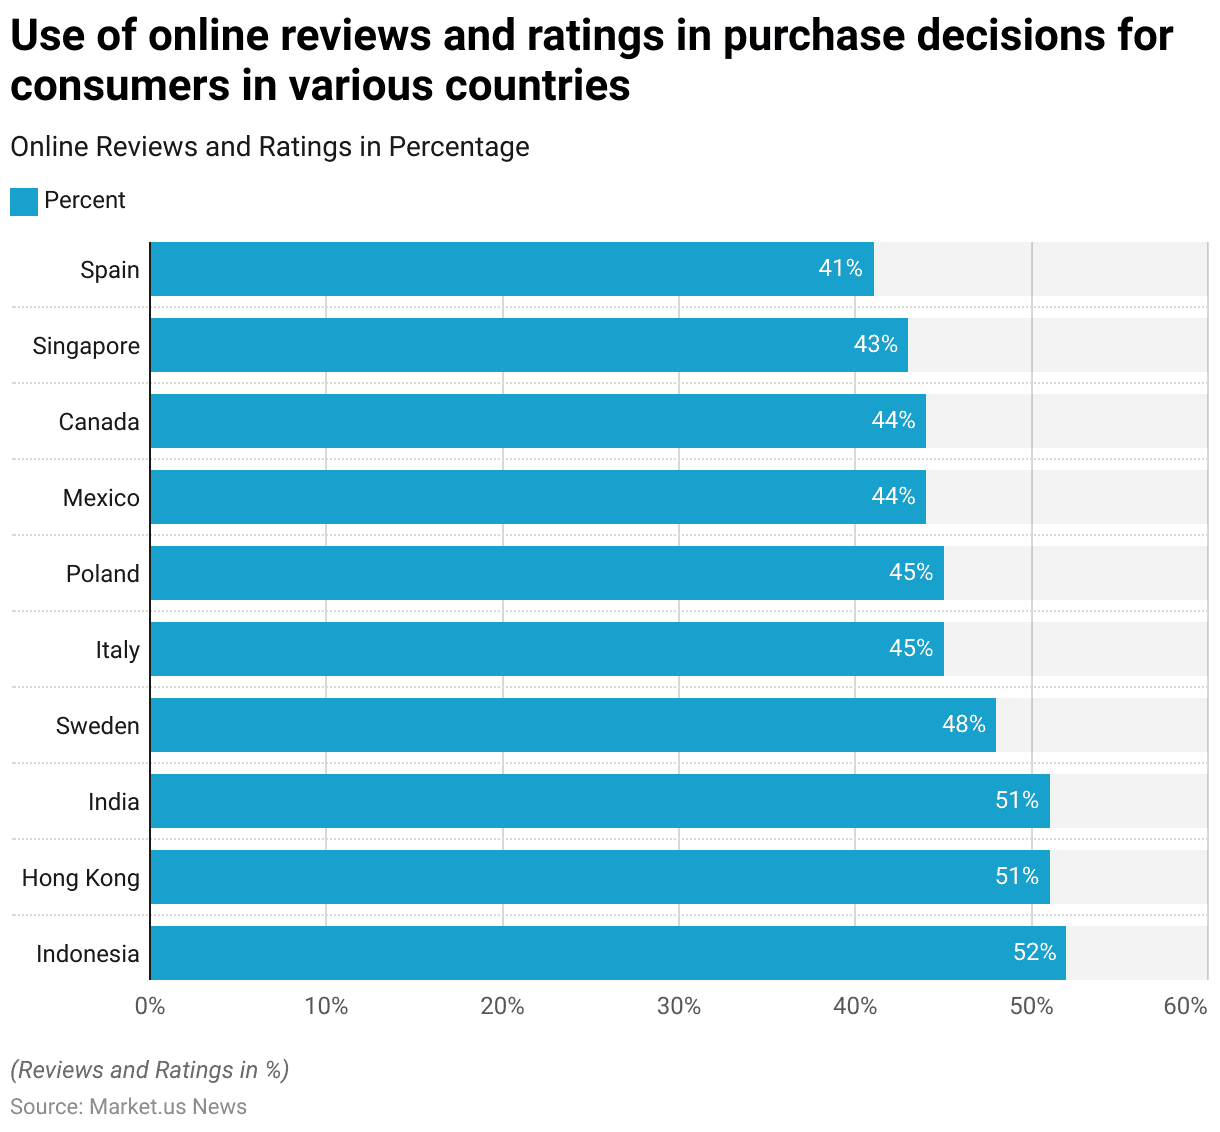
- Online reviews and ratings play a crucial role in consumer purchase decisions in various countries.
- In Indonesia, 52% of respondents regularly use online reviews and ratings provided by other consumers to aid their purchase decisions.
- Hong Kong and India follow closely, with 51% of respondents relying on such feedback.
- In Sweden, 48% of consumers turn to online reviews, while in Italy and Poland, the percentage stands at 45%.
- Mexico and Canada each have 44% of respondents utilizing online reviews, and in Singapore, 43% of consumers do the same.
- Spain rounds out the list, with 41% of respondents considering online reviews when making their purchasing decisions.
- This data highlights the significant influence of consumer reviews and ratings on purchasing behavior across different countries.
(Source: YouGov)
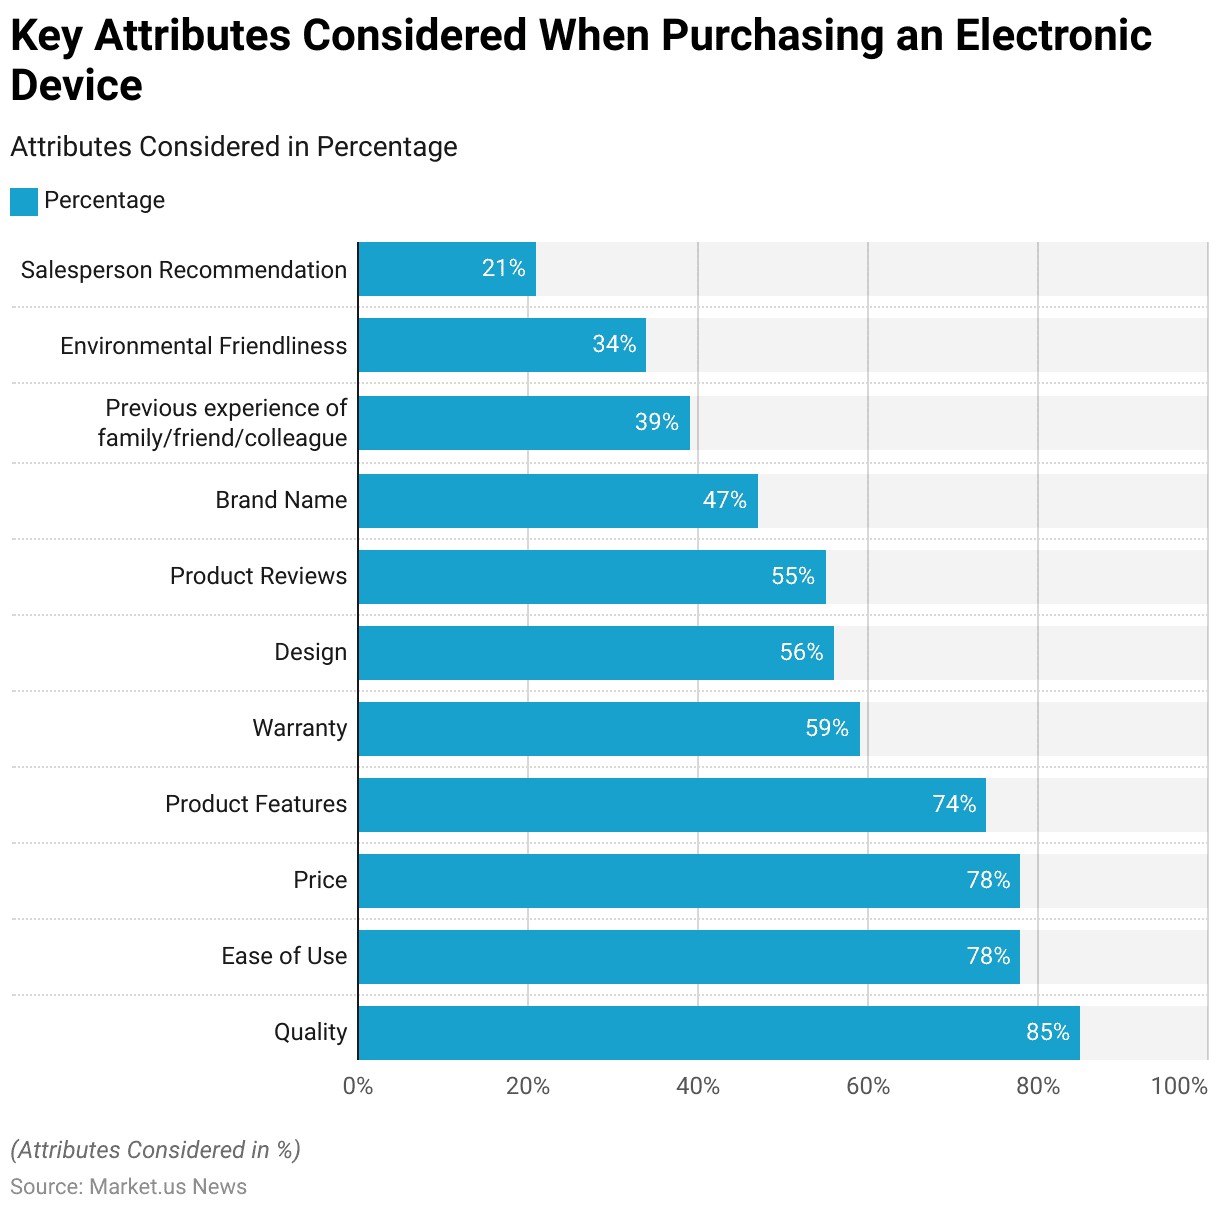
Key Attributes Considered When Purchasing an Electronic Device
- When purchasing an electronic device, consumers consider several key attributes.
- Quality is the most important factor, with 85% of respondents prioritizing it in their decision-making process.
- Ease of use and price are equally important to 78% of consumers.
- Product features are a critical consideration for 74% of respondents, while 59% look for a good warranty.
- Design is important to 56% of consumers, and 55% rely on product reviews.
- Brand name influences the decisions of 47% of respondents, and 39% consider the previous experience of family, friends, or colleagues.
- Environmental friendliness is a factor for 34% of consumers, and 21% take salesperson recommendations into account.
- This data underscores the multifaceted considerations that consumers weigh when selecting electronic devices.
(Source: Adobe Digital Insights: US Consumer Electronics Report- Jan 2020)
Impact of COVID-19 on the Consumer Electronics Sector Statistics
- During the first ten weeks of the pandemic (mid-March to the end of May), the consumer electronics sector experienced significant growth compared to early January. However, it was not as robust as the overall e-commerce growth.
- The 10-week average growth rate for consumer electronics was 33%, while overall e-commerce saw a 53% increase.
- However, due to the heightened focus on electronics during holiday sales, consumer electronics retailers surpassed the overall growth in the early part of the season, with a five-week average growth rate of 176% compared to 135% for overall e-commerce.
- In 2018, American adults spent an average of 90 minutes online daily, which increased to 2.5 hours per day in 2019. Due to the COVID-19 pandemic, this figure surged to 8 hours per day, significantly boosting the demand for electronic devices.
- Best Buy, a US-based electronics retailer, saw its US sales triple in the third quarter of 2020 as a result of the pandemic.
- Apple emerged as a major beneficiary in 2020, with its stock price nearly doubling. After experiencing stable, low growth from 2017 to 2019. Apple saw a 20% revenue increase in 2020, driven by its online store.
- Additionally, the electronics industry had a lower cart abandonment rate compared to the average of 88.05%, with a rate of 85.49%.
- According to the Coronavirus Consumer Tracker conducted by Internet Retailing. Over a quarter of UK consumers ceased online shopping for electronics entirely during the coronavirus crisis.
- Recently, the tracker indicated a modest increase in the percentage of consumers who boosted their online electronics shopping. Rising from 7.5 percent on March 25 to 14 percent in the week ending May 6.
(Source: Adobe Digital Insights: US Consumer Electronics Report- Jan 2020, Segmentify, Internet Retailing)
Recent Developments
Acquisitions:
- Google’s Acquisition of HTC’s Smartphone Division: Google acquired HTC’s smartphone division for $1.1 billion. Enhancing its hardware capabilities and supporting the development of its virtual assistant technologies.
- This acquisition allows Google to integrate hardware and software seamlessly, improving the performance and reach of Google Assistant.
New Product Launches:
- Intel’s 13th Generation Intel Core Processors: At CES 2023, Intel launched its 13th Generation Intel Core mobile processors. Introducing 32 new processors featuring hybrid performance architecture. These processors are aimed at enhancing performance in mobile computing, including gaming and content creation.
- OnePlus Pad: In April 2023, OnePlus launched its flagship tablet, the OnePlus Pad, featuring advanced design aesthetics and high-performance hardware. Including the brand’s Star Orbit metal craft and precise aluminum alloy CNC cutting techniques.
Funding:
- Ekka Electronics’ Investment in Manufacturing: Ekka Electronics announced a significant investment of $121.1 million to establish a manufacturing facility in Noida, India.
- The facility aims to produce various consumer electronics, including washing machines, smartwatches, and wearables, with plans to increase capacity to 800,000 to 900,000 units per month within three years.
Market Growth:
- Global Market Expansion: The growth is driven by the increasing adoption of smart devices, government initiatives promoting digital technology, and the expansion of online retail channels.
- Online Segment Growth: The online segment of the consumer electronics market is expected to register the fastest CAGR of 8.7% over the forecast period. The convenience of online shopping, coupled with widespread internet connectivity and mobile device usage, drives this growth.
Innovation in Technology:
- Infineon’s CES 2023 Showcase: Infineon presented a range of innovations at CES 2023, including silicon carbide-based products for automotive and power systems, smart home solutions, and advanced driver assistance systems for electric vehicles.
- These technologies highlight the integration of IoT and power management in consumer electronics.
Strategic Partnerships and Collaborations:
- Samsung and Google’s Partnership: In October 2022, Samsung partnered with Google to enable seamless connectivity between Samsung Galaxy devices and Google’s SmartThings and Google Home ecosystems.
- This partnership enhances the flexibility and integration of smart home devices across multiple platforms.
Conclusion
Consumer Electronics Statistics – The consumer electronics market has shown remarkable resilience and adaptability, driven by technological advancements and shifting consumer preferences.
The COVID-19 pandemic accelerated the shift to online shopping and increased demand for electronic devices, resulting in significant sales growth for retailers like Best Buy and brands like Apple.
Key factors influencing consumer decisions include quality, ease of use, price, and product features, with online reviews and past experiences playing a significant role.
Major markets such as the United States, China, and Japan are pivotal in both consumption and production.
As smart technologies and innovation continue to drive the industry, the market is poised for sustained growth and transformation.
FAQs
Consumer electronics are electronic devices intended for everyday use, typically in private homes. These include items such as smartphones, laptops, tablets, TVs, gaming consoles, smartwatches, and home appliances.
The COVID-19 pandemic significantly boosted the demand for consumer electronics as more people worked, studied, and entertained themselves at home. This led to a surge in online shopping and increased sales for many electronics retailers.
Current trends include the increasing adoption of smart home devices. Wearable technology like smartwatches, and advancements in AI and machine learning. There is also a growing emphasis on eco-friendly products and sustainable manufacturing practices.
The largest markets for consumer electronics include the United States, China, Japan, Germany, and South Korea. These countries have high consumption rates and are also major producers of electronic devices.
Online reviews are very important when buying consumer electronics. They provide insights into the experiences of other users. Helping consumers make informed decisions about the quality, performance, and reliability of products.


