Table of Contents
- Introduction
- Editor’s Choice
- Baby Products Market Statistics
- Baby Care Products Market Size Worldwide Statistics
- Baby and Child Skin Care Market Overview
- Baby Food Market Overview
- Baby Diapers Market Overview
- Baby Sales Statistics
- Demographic Insights of Baby Product Buyers
- Consumer Preferences and Trends
- Baby Products Usage in Different Nations
- Regulations for Baby Products
- Recent Developments
- Conclusion
- FAQs
Introduction
Baby Products Statistics: Baby products encompass a wide range of items designed to meet the needs of infants and toddlers, including health and safety items, feeding essentials, clothing, toys, developmental products, and sleep aids.
Key items include diapers, bottles, car seats, and baby monitors, along with products like teething toys, rattles, high chairs, and baby food makers.
Safety and comfort are paramount, with items like cribs, strollers, and pacifiers designed to ensure the baby’s well-being.
The market is driven by a focus on convenience, safety, and functionality, offering products that evolve with the child’s growth and developmental stages.
Editor’s Choice
- The global baby products market size is expected to reach USD 575.8 billion by 2033.
- The global baby products market relies on diverse distribution channels, with hypermarkets and supermarkets leading at 46% market share, reflecting their wide reach and one-stop shopping appeal.
- By 2026, the global baby care products market size is anticipated to reach USD 88.72 billion.
- The global organic baby food market size is projected to reach an estimated USD 14.8 billion.
- In 2022, China emerged as the leading market for baby food retail sales, generating a remarkable USD 30,148.8 million, highlighting its dominance in the global market driven by its large population and rising demand for high-quality infant nutrition products.
- In 2013, Johnson’s and Pampers were the most trusted baby product brands in the United Kingdom, each earning the trust of 77% of respondents.
- In 2021, safety (65%) and production quality (62%) were the top priorities for Russian customers when choosing baby care and hygiene products.

Baby Products Market Statistics
Global Baby Products Market Size Statistics
- The global baby products market is expected to experience consistent growth over the next decade at a CAGR of 6.0%.
- In 2023, the market size is projected to reach USD 321.5 billion, with an anticipated increase to USD 340.8 billion by 2024.
- This upward trajectory is forecasted to continue, reaching USD 361.2 billion in 2025 and USD 382.9 billion in 2026.
- By 2027, the market size is expected to grow to USD 405.9 billion, further expanding to USD 430.2 billion in 2028.
- The market is projected to surpass USD 456.1 billion in 2029 and achieve USD 483.4 billion by 2030.
- Subsequent years indicate continued growth, with the market expected to reach USD 512.4 billion in 2031, USD 543.2 billion in 2032, and culminate at USD 575.8 billion by 2033.
- This steady expansion highlights the increasing demand for baby products globally, driven by factors such as rising birth rates, evolving consumer preferences, and advancements in product offerings.
(Source: market.us)
Global Baby Products Market Size – By Product Statistics
2023-2027
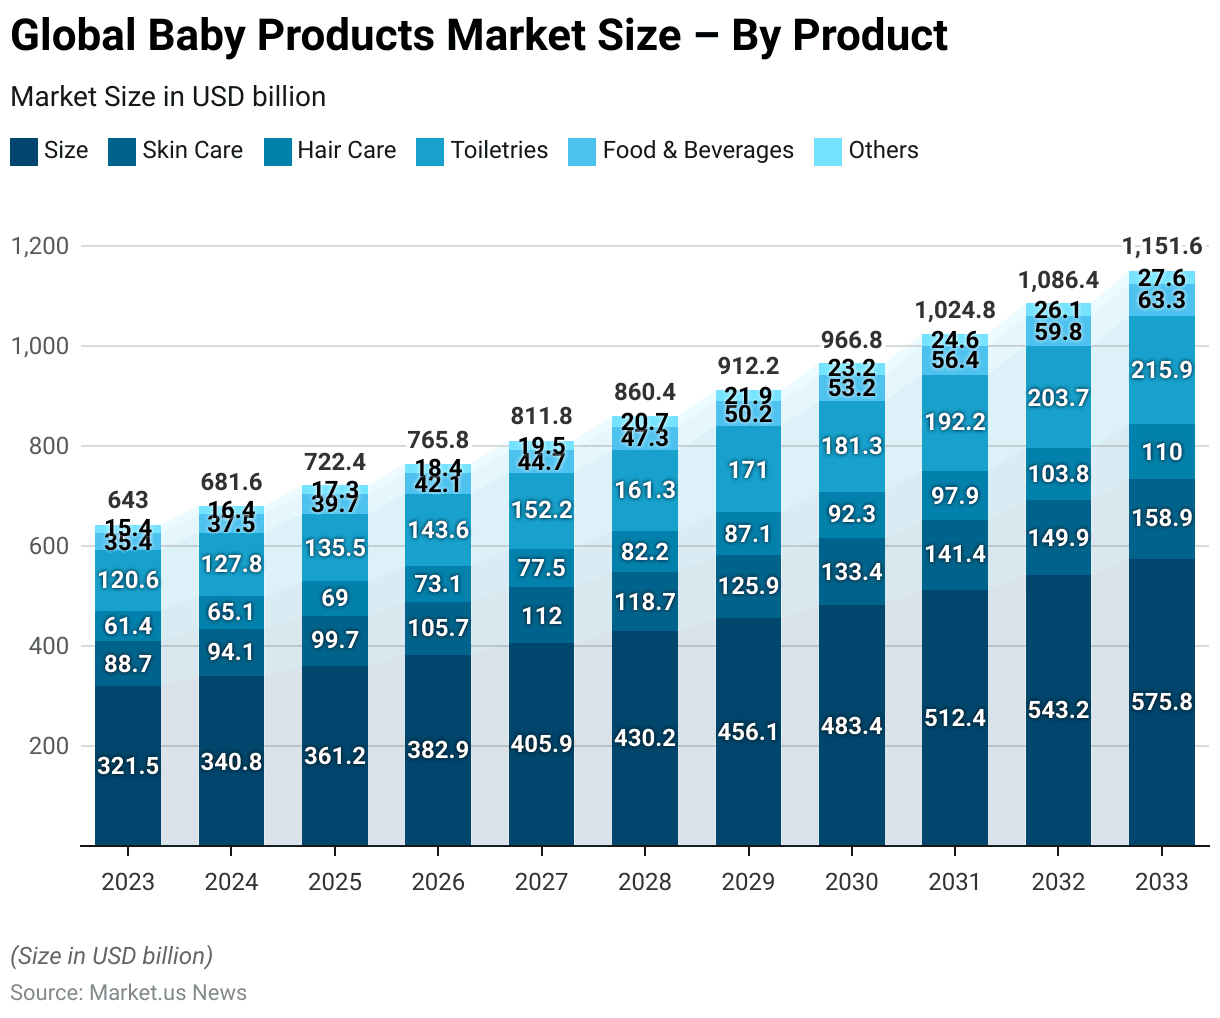
- The global baby products market, segmented by product categories, is forecasted to witness robust growth from 2023 to 2027.
- The total market size in 2023 is projected at USD 321.5 billion, with significant contributions from skincare (USD 88.73 billion), hair care (USD 61.41 billion), toiletries (USD 120.56 billion), food and beverages (USD 35.37 billion), and other products (USD 15.43 billion).
- By 2024, the market is expected to grow to USD 340.8 billion, driven by increases across all segments, including skin care at USD 94.06 billion and toiletries at USD 127.80 billion.
- The upward trend continues, with the market reaching USD 361.2 billion in 2025 and USD 382.9 billion in 2026, supported by growth in skin care (USD 105.68 billion in 2026) and food and beverages (USD 42.12 billion in 2026).
- By 2027, the market size is anticipated to grow to USD 405.9 billion, with toiletries leading at USD 152.21 billion, followed by skin care (USD 112.03 billion) and food and beverages (USD 44.65 billion).
2028-2033
- In 2028, the market size is projected at USD 430.2 billion, with significant contributions from toiletries (USD 161.33 billion) and hair care (USD 82.17 billion).
- This growth trajectory continues into 2029, with the market reaching USD 456.1 billion, propelled by skin care at USD 125.88 billion and food and beverages at USD 50.17 billion.
- By 2030, the market size is forecasted at USD 483.4 billion, with toiletries contributing USD 181.28 billion and skin care USD 133.42 billion.
- In 2031, the market is projected to reach USD 512.4 billion. By 2032, it is expected to grow to USD 543.2 billion, with food and beverages and other categories contributing USD 59.75 billion and USD 26.07 billion, respectively.
- By 2033, the total market is expected to reach USD 575.8 billion, with toiletries accounting for USD 215.93 billion, skin care USD 158.92 billion, hair care USD 109.98 billion, food and beverages USD 63.34 billion, and others USD 27.64 billion.
- This sustained growth reflects rising consumer demand for high-quality baby products across all categories.
(Source: market.us)
Global Baby Products Market Share – By Distribution Channel Statistics
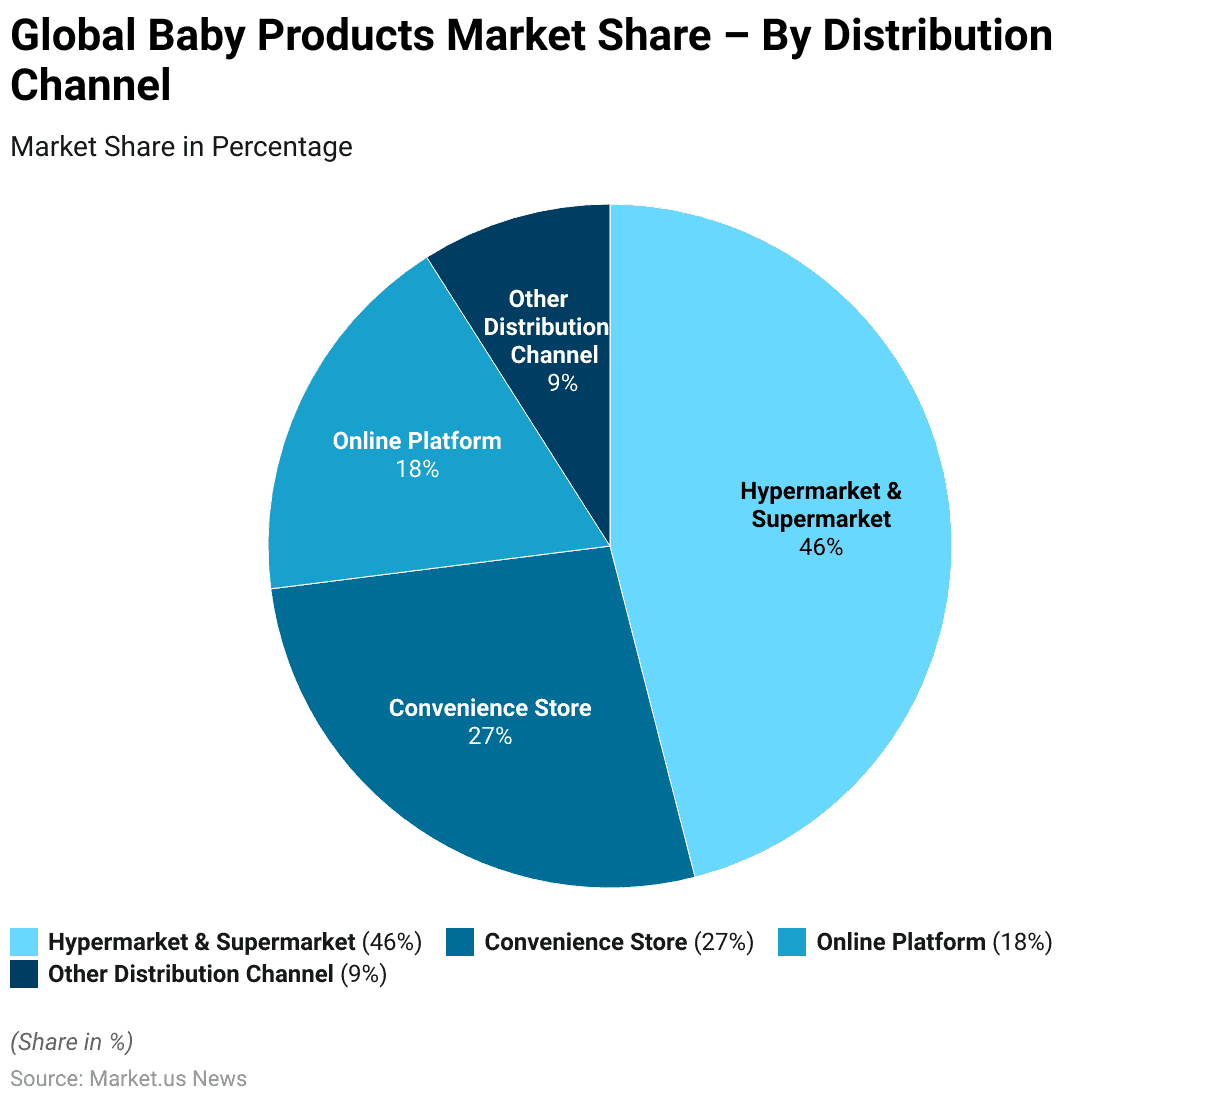
- The global baby products market is characterized by a diverse range of distribution channels, each contributing to overall market share.
- Hypermarkets and supermarkets dominate the market with a significant share of 46%, reflecting their extensive reach and consumer preference for one-stop shopping experiences.
- Convenience stores hold the second-largest share at 27%, benefiting from their accessibility and widespread presence in both urban and rural areas.
- Online platforms account for 18% of the market share, driven by the growing trend of e-commerce and consumer inclination toward convenient, home-delivery shopping options.
- Other distribution channels collectively contribute 9%, encompassing specialized retail outlets and other niche distribution methods.
- This distribution pattern highlights the prominence of traditional retail formats alongside the rising importance of digital platforms.
(Source: market.us)
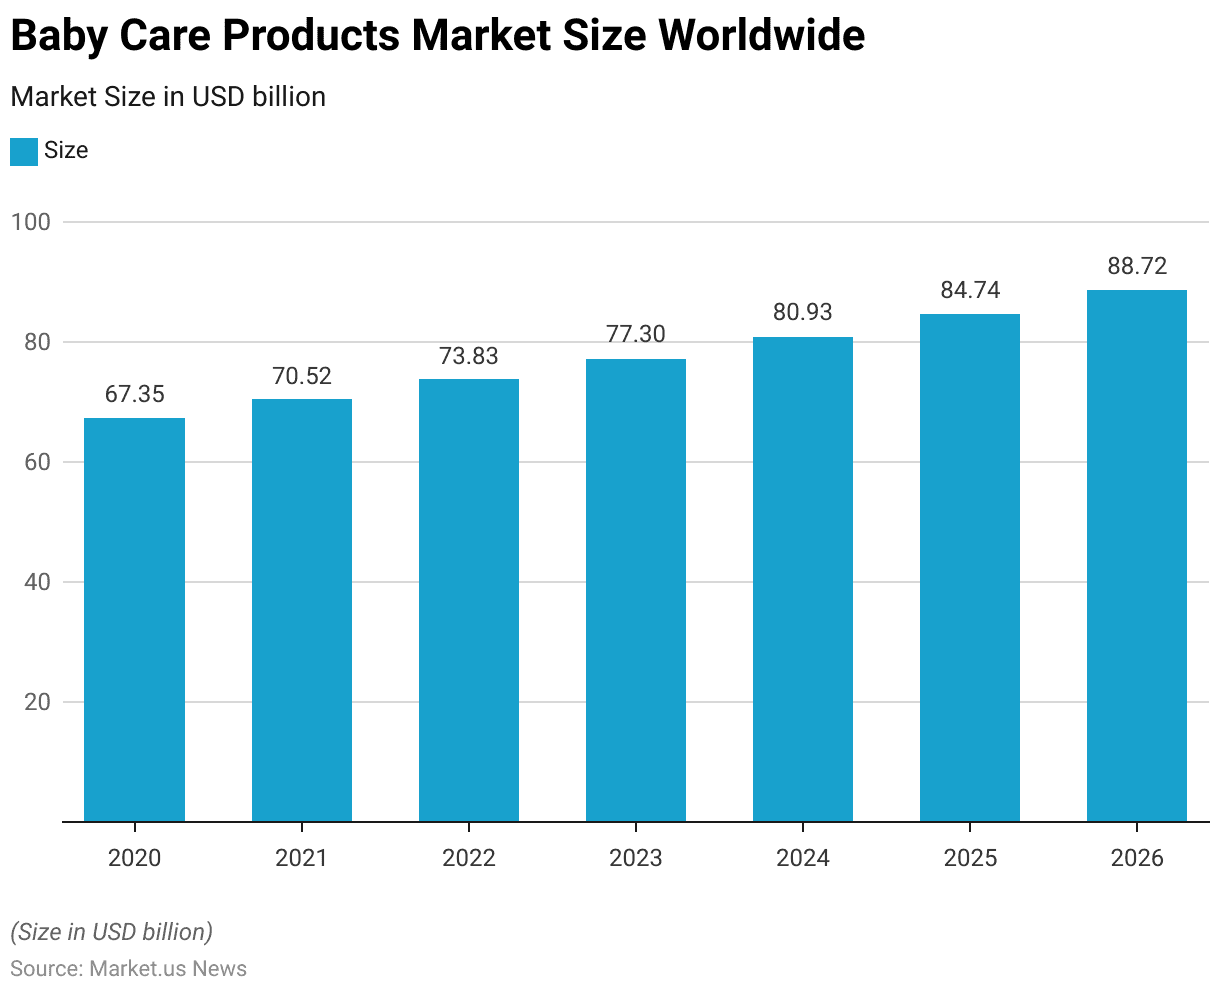
Baby Care Products Market Size Worldwide Statistics
- The global baby care products market is projected to experience steady growth from 2020 to 2026.
- In 2020, the market size was valued at USD 67.35 billion, reflecting significant demand for essential baby care items worldwide.
- This figure grew to USD 70.52 billion in 2021, demonstrating a year-on-year increase as consumer spending on baby care products continued to rise.
- The market further expanded in 2022 to USD 73.83 billion and is projected to reach USD 77.3 billion in 2023.
- This upward trend is expected to persist, with the market forecasted to grow to USD 80.93 billion by 2024 and USD 84.74 billion by 2025.
- By 2026, the global baby care products market size is anticipated to reach USD 88.72 billion.
- This consistent growth underscores the increasing demand for high-quality baby care products, driven by factors such as rising disposable incomes, heightened parental awareness, and advancements in product innovation and availability.
(Source: Statista)
Baby and Child Skin Care Market Overview
Global Baby and Child Skin Care Market Revenue
- The global baby and child skincare market has demonstrated a steady growth trajectory over the years, with revenue increasing from USD 3,931.65 million in 2018 to an anticipated USD 5,834.8 million by 2029.
- In 2019, the market revenue grew to USD 4,030.99 million, followed by a slight decline in 2020 to USD 3,902.32 million, likely reflecting disruptions from the global economic slowdown during the pandemic.
- However, the market rebounded in 2021, reaching USD 4,135.16 million, and continued to expand in 2022 to USD 4,288.75 million.
- The upward trend is expected to persist, with revenues forecasted at USD 4,560.65 million in 2023, USD 4,844.27 million in 2024, and USD 5,051.61 million in 2025.
- By 2026, the market is projected to generate USD 5,276.61 million, growing further to USD 5,532.5 million in 2027.
- This growth is anticipated to continue, with revenues reaching USD 5,694.14 million in 2028 and peaking at USD 5,834.8 million by 2029.
- This sustained expansion highlights the increasing demand for high-quality and specialized skin care products for babies and children globally, driven by growing parental awareness and product innovations in this category.
(Source: Statista)
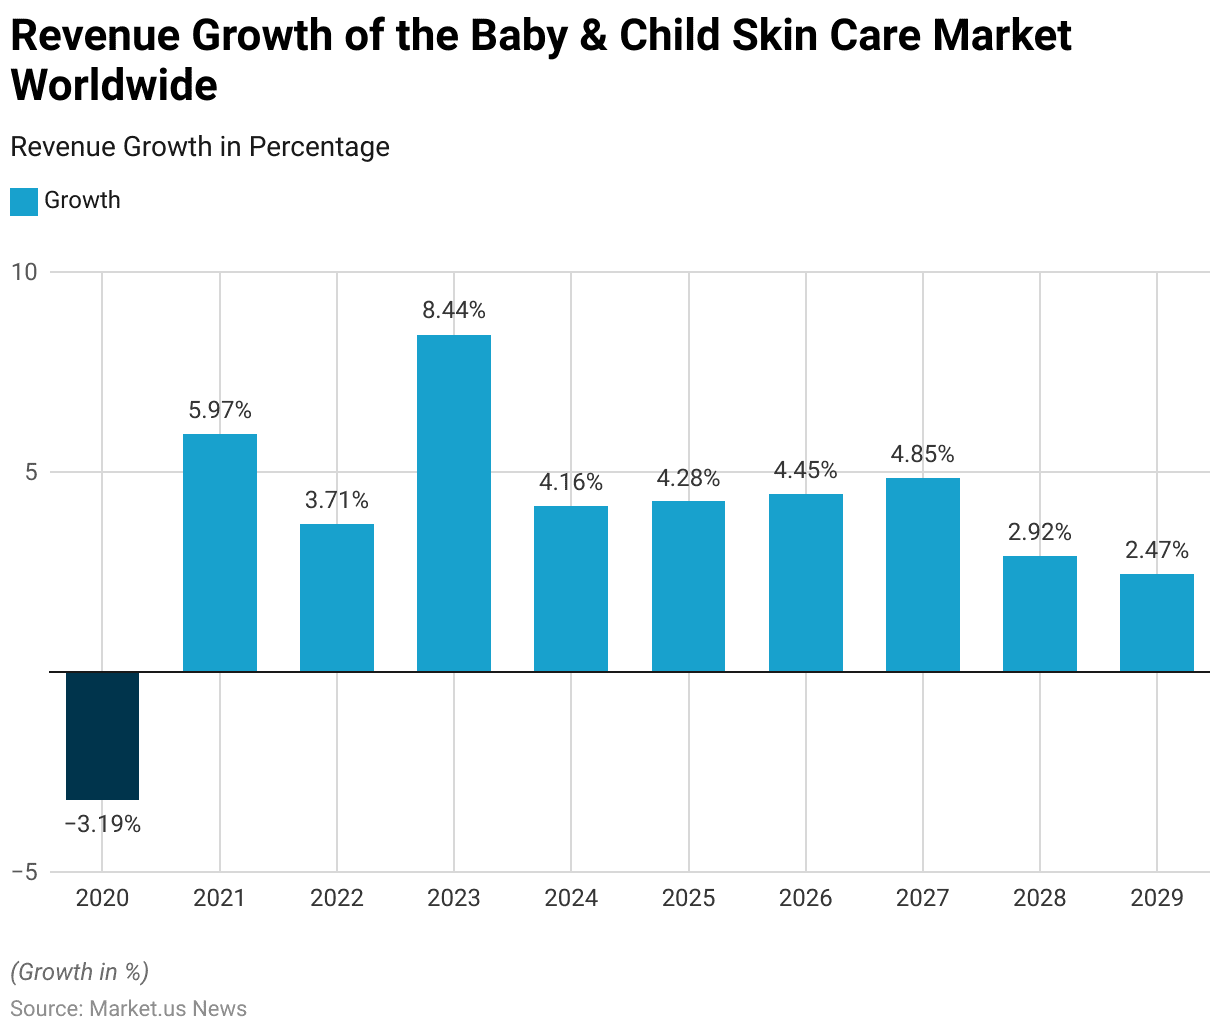
Revenue Growth of the Baby & Child Skin Care Market Worldwide
- The global baby and child skincare market has exhibited varying rates of revenue growth from 2020 to 2029, reflecting shifts in market dynamics and consumer demand.
- In 2020, the market experienced a contraction of -3.19%, likely due to economic disruptions caused by the COVID-19 pandemic.
- However, a strong recovery followed in 2021, with revenue growth rebounding to 5.97%.
- This positive momentum continued in 2022, albeit at a moderated rate of 3.71%.
- The growth rate surged in 2023, reaching a peak of 8.44%, reflecting heightened consumer interest and market expansion.
- In the subsequent years, growth stabilized, with rates of 4.16% in 2024, 4.28% in 2025, and 4.45% in 2026.
- By 2027, the market saw a slight acceleration in growth to 4.85%. In the later years, growth rates began to taper, with a projected 2.92% increase in 2028 and 2.47% in 2029.
- These figures indicate a consistent yet slowing growth trajectory as the market approaches maturity, driven by sustained consumer demand and ongoing innovations within the baby and child skin care segment.
(Source: Statista)
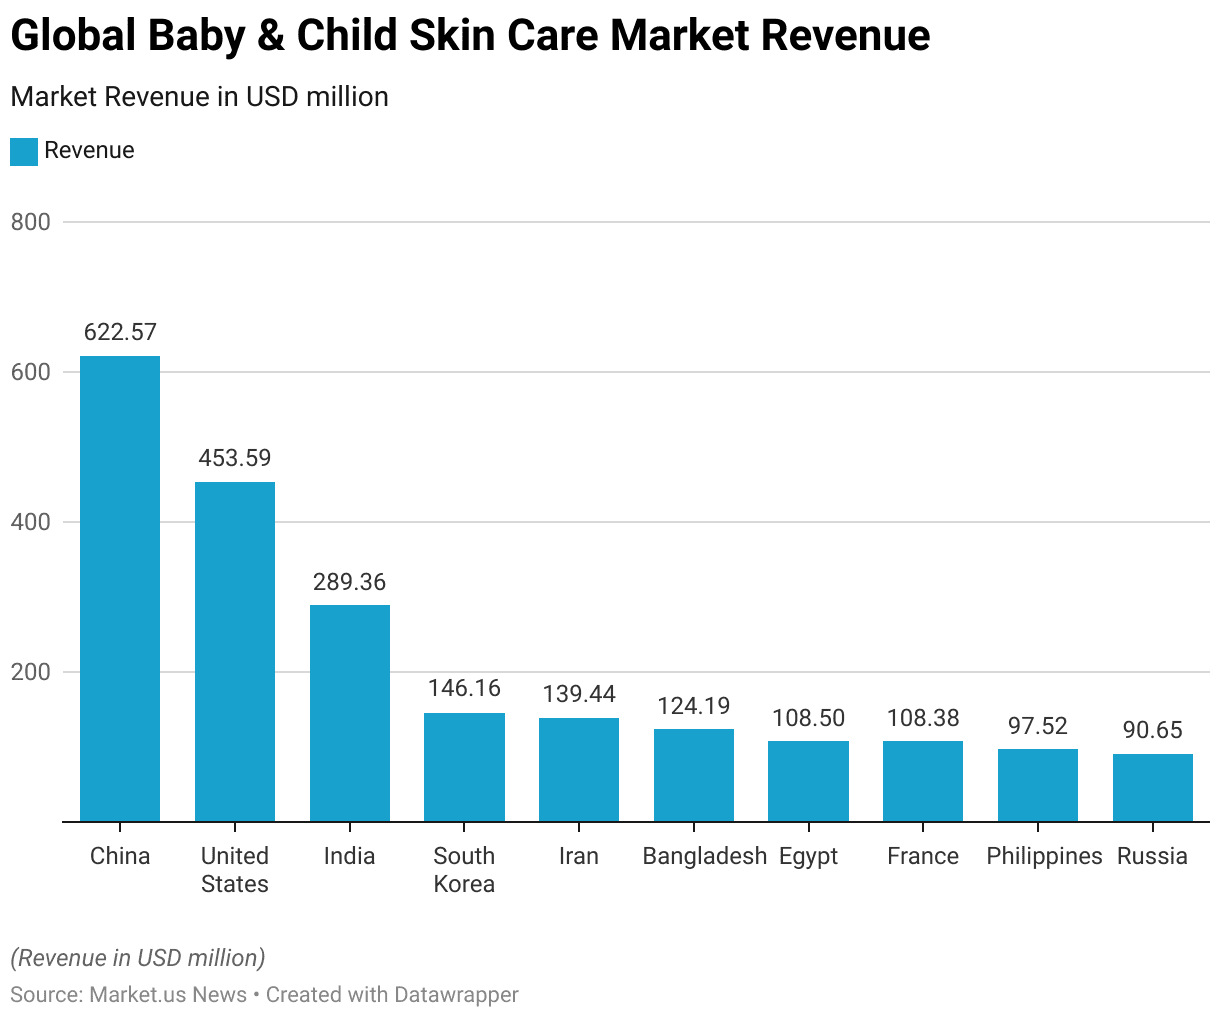
Revenue of the Baby & Child Skin Care Market Worldwide – By Country
- In 2023, the global baby and child skincare market generated significant revenue across various countries, with China leading the market at USD 622.57 million.
- The United States followed as the second-largest market, contributing USD 453.59 million in revenue.
- India ranked third with a substantial revenue of USD 289.36 million, reflecting the high demand in these populous regions.
- South Korea and Iran also recorded notable revenues of USD 146.16 million and USD 139.44 million, respectively, showcasing the growing market for premium baby care products in these countries.
- Bangladesh contributed USD 124.19 million, highlighting the rising consumer interest in baby and child skin care products in emerging economies.
- Egypt and France each generated revenues exceeding USD 108 million, with USD 108.5 million and USD 108.38 million, respectively, emphasizing their importance in the market.
- The Philippines contributed USD 97.52 million, while Russia rounded out the top ten markets with USD 90.65 million in revenue.
- This data underscores the global demand for baby and child skin care products, driven by diverse consumer bases and increasing awareness of specialized skin care solutions.
(Source: Statista)
Baby Food Market Overview
Global Baby Food Market Revenue
- The global baby food market has exhibited consistent growth since 2018 and is projected to continue its upward trajectory through 2029.
- In 2018, the market revenue was valued at USD 53.69 billion, increasing to USD 56.12 billion in 2019 and USD 59.37 billion in 2020, driven by rising awareness of infant nutrition and the growing demand for high-quality baby food products.
- This trend gained momentum in 2021, with revenues reaching USD 64.25 billion, followed by USD 67.42 billion in 2022.
- The market is forecasted to expand further, with projected revenues of USD 71.39 billion in 2023, USD 75.59 billion in 2024, and USD 79.74 billion in 2025.
- By 2026, the market size is expected to reach USD 84.31 billion, and by 2027, it is anticipated to grow to USD 88.83 billion.
- Continued growth is predicted for 2028, with revenue expected at USD 94.21 billion, culminating in an estimated USD 100.1 billion by 2029.
- This sustained expansion highlights the increasing global demand for diverse and fortified baby food products, supported by innovations in product development and growing consumer awareness of the importance of infant health and nutrition.
(Source: Statista)
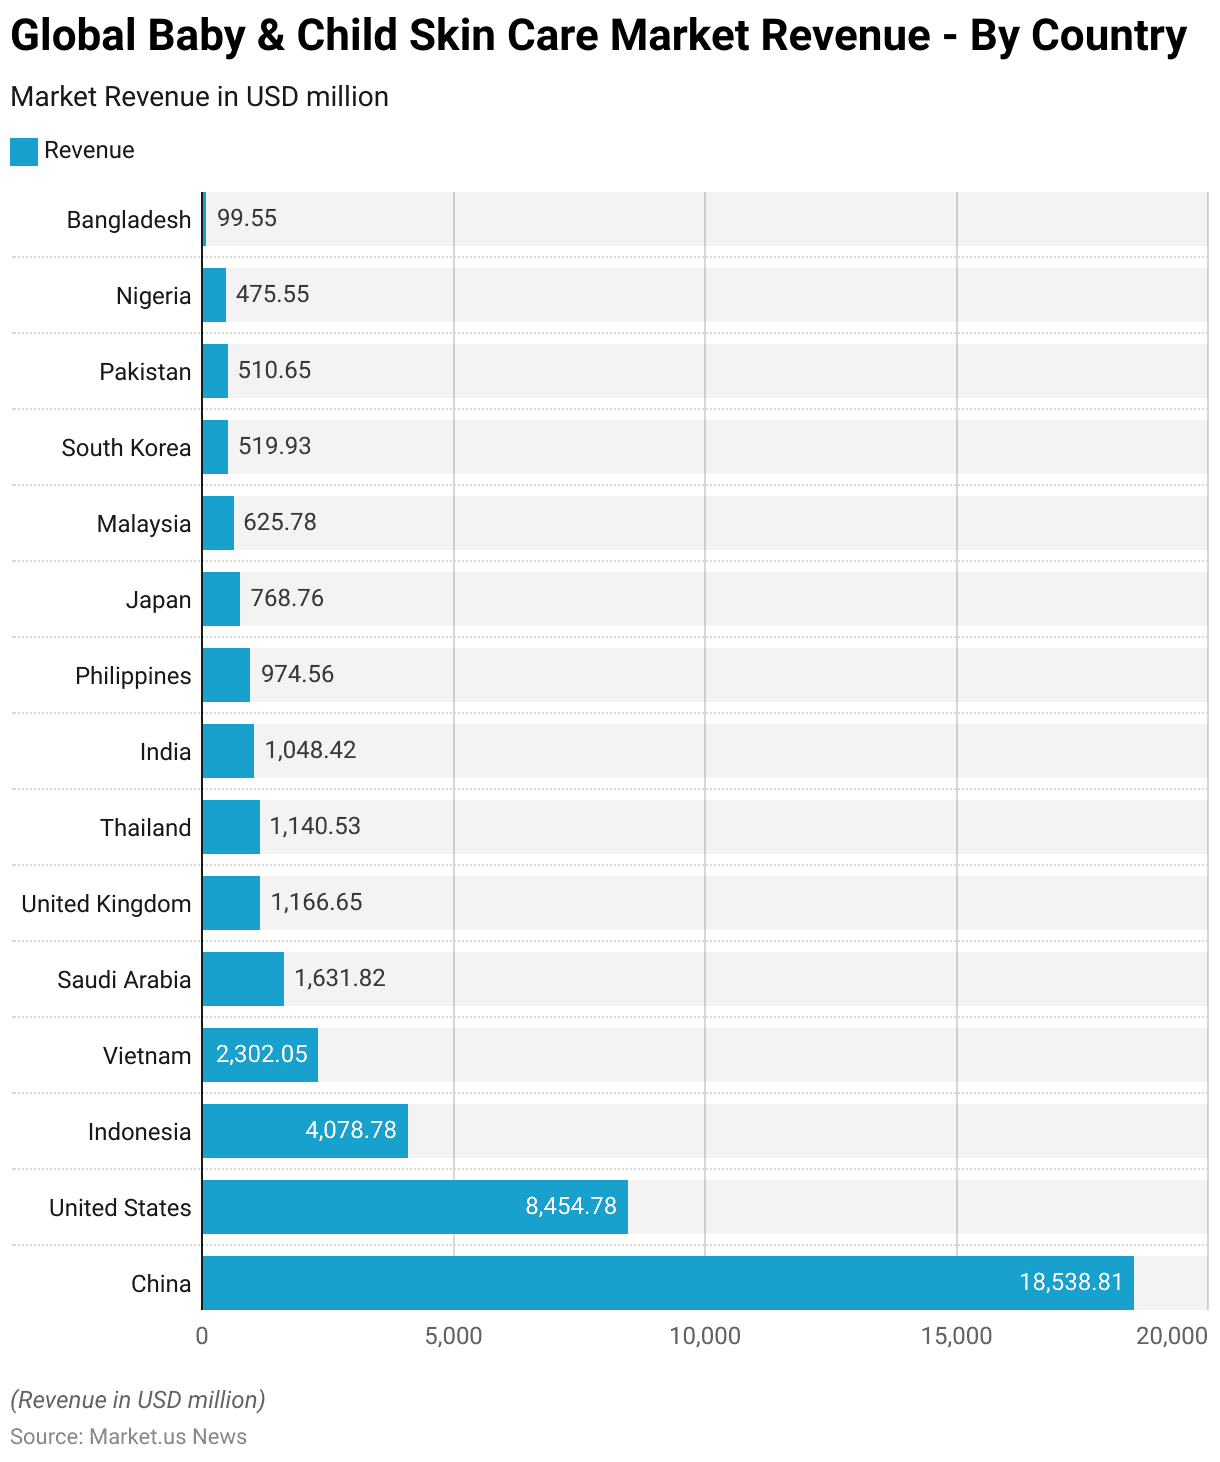
Revenue of the Baby Food Market Worldwide – By Country
- In 2023, the global baby food market exhibited substantial revenue contributions from various countries, with China leading by a wide margin at USD 18,538.81 million, underscoring its dominance in the sector due to its large population and growing consumer spending on infant nutrition.
- The United States ranked second with USD 8,454.78 million, driven by high demand for premium baby food products.
- Indonesia followed with USD 4,078.78 million, reflecting significant market potential in Southeast Asia.
- Vietnam contributed USD 2,302.05 million, highlighting its growing market for baby food.
- Other notable contributors include Saudi Arabia, which has USD 1,631.82 million, and the United Kingdom, which has USD 1,166.65 million, showcasing the demand for baby food in both emerging and developed economies.
- Thailand and India contributed USD 1,140.53 million and USD 1,048.42 million, respectively, further emphasizing the importance of Asia as a key market region.
- The Philippines recorded USD 974.56 million, while Japan accounted for USD 768.76 million, demonstrating steady demand in East Asia.
- Additional contributions came from Malaysia (USD 625.78 million), South Korea (USD 519.93 million), and Pakistan (USD 510.65 million), reflecting regional growth trends.
- Nigeria contributed USD 475.55 million, representing significant growth potential in Africa, while Bangladesh rounded out the list with USD 99.55 million, indicating its emerging market status.
- These figures underscore the diverse and growing global demand for baby food across both developed and developing nations.
(Source: Statista)
Global Organic Baby Food Market Size
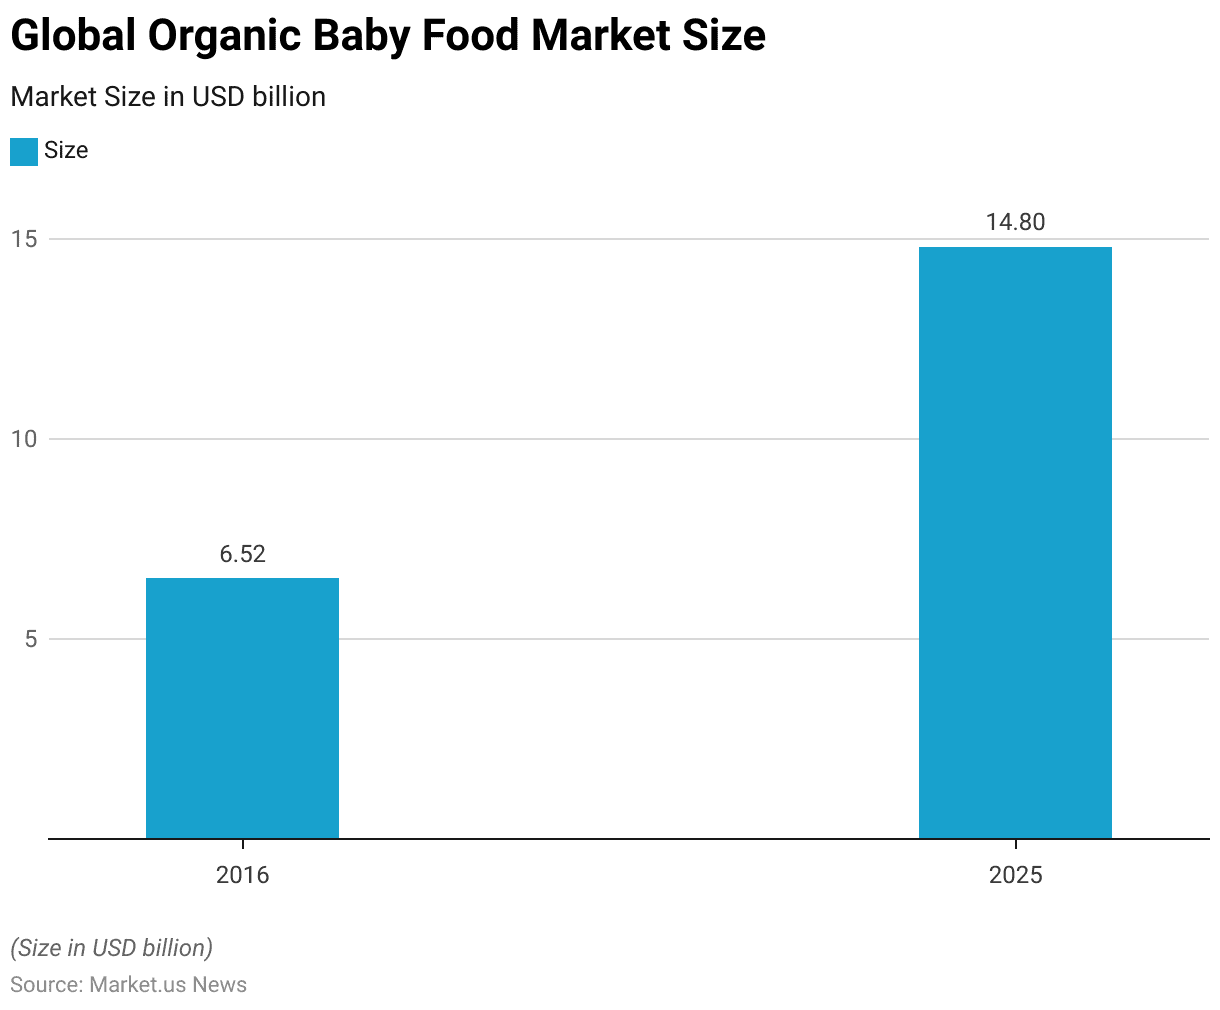
- The global organic baby food market has experienced significant growth and is projected to continue its upward trajectory.
- In 2016, the market was valued at USD 6.52 billion, reflecting the growing consumer preference for organic and chemical-free food options for infants.
- By 2025, the market size is expected to more than double, reaching an estimated USD 14.8 billion.
- This substantial growth highlights the increasing awareness among parents regarding the benefits of organic baby food, including its nutritional value and absence of harmful additives, as well as the expanding availability of organic options worldwide.
(Source: Statista)
Baby Diapers Market Overview
Revenue in the Baby Diapers Segment Worldwide
- The baby diapers segment within the global tissue and hygiene paper market has shown a dynamic growth pattern from 2019 to 2029.
- In 2019, the segment generated revenue of USD 45.76 billion, followed by a decline in 2020 to USD 42.41 billion, likely influenced by economic challenges during the pandemic.
- The market recovered in 2021, with revenue increasing to USD 44.94 billion, and continued its upward trajectory in 2022, reaching USD 47.76 billion.
- By 2023, revenue in the segment is projected to rise significantly to USD 53.04 billion, reflecting robust consumer demand.
- The growth is expected to continue in subsequent years, with revenue forecasted to reach USD 56.9 billion in 2024 and USD 60.75 billion in 2025.
- By 2026, the market size is anticipated to grow to USD 64.69 billion, increasing further to USD 68.59 billion in 2027.
- The upward momentum is projected to persist through 2028 and 2029, with revenues expected to reach USD 72.23 billion and USD 75.59 billion, respectively.
- This sustained growth highlights the increasing demand for baby diapers worldwide, driven by rising birth rates in developing regions, improved product innovations, and growing awareness of hygiene standards among consumers.
(Source: Statista)
Revenue of the Baby Diapers Market Worldwide – By Country
- In 2023, the global baby diapers market generated significant revenue across various countries, with China leading the market at USD 11,024.1 million, highlighting its dominance due to its large population and increasing demand for hygiene products.
- The United States followed as the second-largest contributor with USD 7,736.3 million, driven by strong consumer spending and widespread product availability.
- India ranked third with USD 6,505.67 million, reflecting robust growth in emerging markets. Other notable contributors included Indonesia (USD 1,631.02 million), Japan (USD 1,441.21 million), and Brazil (USD 1,354.49 million).
- The United Kingdom generated USD 1,194.51 million, followed by Mexico with USD 1,055.02 million, underscoring the importance of these markets.
- The Philippines, Germany, and Russia contributed USD 936.56 million, USD 876.06 million, and USD 825.27 million, respectively, showcasing significant demand across diverse regions. Nigeria added USD 813.22 million, highlighting growing adoption in African markets, while France recorded USD 800.07 million in revenue.
- Iran, Canada, and Italy contributed USD 720.9 million, USD 699.87 million, and USD 677.08 million, respectively, while Bangladesh (USD 601.32 million) and Turkey (USD 574.95 million) also demonstrated significant market presence.
- Vietnam and Spain followed closely with USD 556.61 million and USD 510.09 million, respectively, while Poland generated USD 505.37 million.
- South Korea (USD 478.13 million), Pakistan (USD 411.1 million), Saudi Arabia (USD 406.92 million), and Argentina (USD 314.9 million) rounded out the list, reflecting diverse demand across global markets for baby diapers.
- This data highlights the widespread and growing demand for baby diapers driven by increasing awareness of hygiene and rising disposable incomes.
(Source: Statista)
Baby Sales Statistics
Leading Markets Worldwide Based On Baby Food Retail Sales
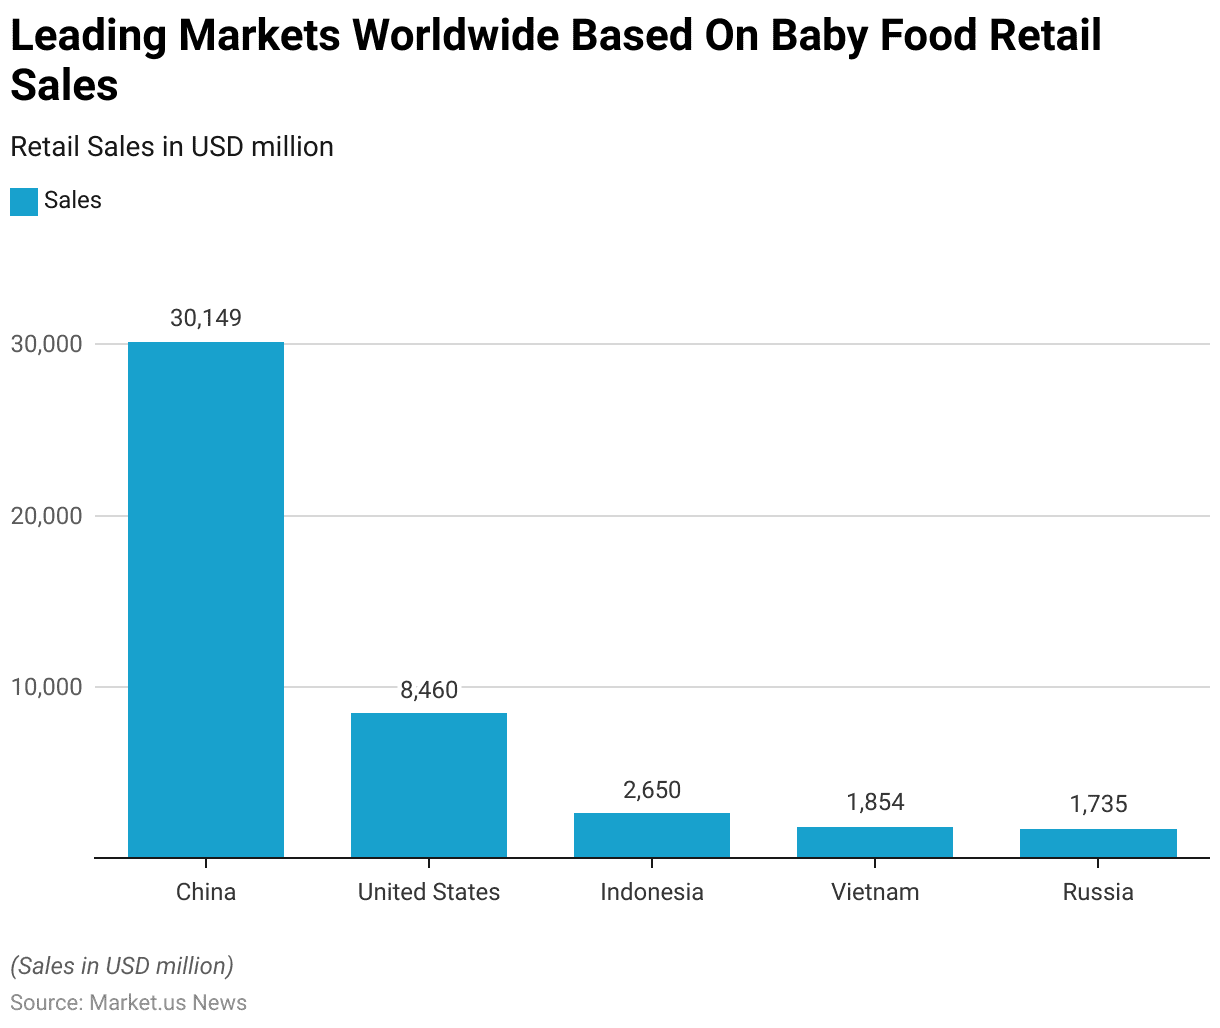
- In 2022, China emerged as the leading market for baby food retail sales, generating a remarkable USD 30,148.8 million, highlighting its dominance in the global market driven by its large population and rising demand for high-quality infant nutrition products.
- The United States ranked second with USD 8,460 million in sales, reflecting strong consumer spending and a well-established retail network.
- Indonesia followed as the third-largest market, recording sales of USD 2,650.3 million, emphasizing the growing demand for baby food in Southeast Asia.
- Vietnam and Russia also demonstrated significant market presence, with retail sales of USD 1,854 million and USD 1,735.4 million, respectively.
- These figures illustrate the importance of both emerging and developed markets in shaping the global baby food industry, driven by increasing parental awareness and evolving consumer preferences.
(Source: Statista)
Johnson & Johnson’s Baby Care Sales Worldwide
- Johnson & Johnson’s global baby care sales experienced a declining trend from 2011 to 2022.
- In 2011, the company reported sales of USD 2,340 million, which decreased slightly to USD 2,254 million in 2012 and then increased marginally to USD 2,295 million in 2013.
- The peak was observed in 2014, with sales reaching USD 2,346 million.
- However, a gradual decline began after that, with sales dropping to USD 2,157 million in 2015 and further to USD 2,001 million in 2016.
- From 2017 onwards, the decline continued, with sales recorded at USD 1,916 million in 2017 and USD 1,858 million in 2018.
- By 2019, sales had decreased further to USD 1,675 million, and the impact of changing consumer preferences and market dynamics became evident as sales dropped to USD 1,517 million in 2020 during the pandemic.
- A slight recovery was noted in 2021, with sales reaching USD 1,566 million, but the downward trend resumed in 2022, with sales falling to USD 1,461 million.
- This consistent decline highlights the challenges faced by Johnson & Johnson in the baby care segment amidst evolving market conditions and competitive pressures.
(Source: Statista)
Global Sales of Procter & Gamble’s Baby, Feminine, and Family Care Segment
- Procter & Gamble’s global sales in the baby, feminine, and family care segment have shown a dynamic trend between 2011 and 2024.
- In 2011, the segment reported sales of USD 15.61 billion, which increased significantly to USD 19.71 billion in 2012 and further to USD 20.48 billion in 2013. The segment reached its peak in 2014, with sales of USD 20.95 billion.
- However, a slight decline followed, with sales falling to USD 20.25 billion in 2015 and further dropping to USD 18.51 billion in 2016.
- Between 2017 and 2019, the segment experienced continued decline, with sales recorded at USD 18.25 billion in 2017, USD 18.08 billion in 2018, and USD 17.81 billion in 2019.
- In 2020, sales rebounded slightly to USD 18.36 billion, followed by steady increases in subsequent years.
- By 2021, sales reached USD 18.85 billion and continued to grow to USD 19.74 billion in 2022.
- The positive trajectory is expected to persist, with sales projected at USD 20.22 billion in 2023 and further rising slightly to USD 20.28 billion in 2024.
- These figures reflect Procter & Gamble’s resilience and ability to adapt to evolving market conditions, maintaining a strong presence in the baby, feminine, and family care segment.
(Source: Statista)
Kimberly-Clark’s Baby and Child Care Product Sales Worldwide
- Kimberly-Clark’s global sales of baby and childcare products have shown fluctuations between 2011 and 2023.
- In 2011, sales were recorded at USD 6.8 billion, increasing to USD 7.1 billion in 2012 before stabilizing at USD 7 billion in both 2013 and 2014.
- However, sales declined to USD 6.6 billion in 2015 and further decreased to USD 6.4 billion in 2016.
- This downward trend continued into 2017 and 2018, with sales stabilizing at USD 6.3 billion during these years, a figure that persisted through 2019.
- In 2020, sales showed a slight rebound to USD 6.4 billion, followed by a notable increase to USD 7.2 billion in 2021, marking the highest revenue during this period.
- This figure remained steady in 2022, but sales dipped slightly to USD 7.1 billion in 2023.
- These trends reflect the impact of changing market conditions and consumer demand on Kimberly-Clark’s baby and childcare segment over the years, with recent performance indicating a recovery from earlier declines.
(Source: Statista)
Annual Revenue of Mothercare Worldwide
- Mothercare’s annual revenue worldwide has seen a significant decline from 2011 to 2023.
- In 2011, the company recorded revenue of GBP 793.6 million, which increased slightly to GBP 812.7 million in 2012.
- However, this marked the beginning of a downward trend, with revenue falling to GBP 749.4 million in 2013 and further decreasing to GBP 724.9 million in 2014.
- By 2015, revenue had dropped to GBP 713.9 million, and this decline continued into 2016 and 2017, with sales reaching GBP 682.3 million and GBP 667.4 million, respectively.
- The steepest declines occurred from 2018 onwards, when revenue fell to GBP 580.6 million, followed by a sharp decrease to GBP 199.8 million in 2019 as the company faced increasing financial and operational challenges.
- This downward trajectory persisted, with revenue dropping to GBP 164.7 million in 2020, GBP 85.8 million in 2021, and GBP 82.5 million in 2022.
- By 2023, Mothercare’s revenue had fallen further to GBP 73.1 million, reflecting the company’s struggles in a highly competitive and evolving retail environment.
- These figures underscore the challenges Mothercare has faced over the years, including market shifts and operational restructuring efforts.
(Source: Statista)
Demographic Insights of Baby Product Buyers
Age
- As of May 2017, baby care product purchase channels in the United States varied significantly by age group.
- Among respondents aged 18-29, department stores were the most popular purchase channel, with 63% of this group using them, followed by supermarkets at 56% and drug stores at 44%.
- Discount stores were utilized by 23% of this age group, while 21% purchased products from online stores and 19% used pharmacies. Other channels like kiosks, perfumeries, and beauty salons were less frequently used, each accounting for 1-7%.
- For the 30-59 age group, supermarkets were the leading channel, used by 47% of respondents, followed by discount stores at 38%, department stores at 38%, and drug stores at 39%. Online stores were chosen by 18%, and pharmacies by 17%.
- Channels like beauty salons and perfumeries accounted for 4-5%, while mail order/catalogs and kiosks were used by 3%.
- Among respondents aged 60 years and older, discount stores were the most popular purchase channel, with 55% of this age group using them, followed by drug stores at 45% and supermarkets at 21%.
- Other channels, such as online stores (2%), pharmacies (10%), and department stores (14%), were less commonly used. Channels like kiosks, perfumeries, and beauty salons had minimal or no usage in this age group.
- This distribution highlights varying shopping preferences across age groups, with younger consumers favoring department stores and online channels, while older consumers leaned more toward discount and drug stores.
(Source: Statista)
Gender
- As of August 2019, the responsibility for purchasing daily baby products in families in China predominantly fell on mothers, with significant involvement from fathers in some categories.
- Among respondents, 88% of mothers reported being responsible for buying daily necessities for infants, compared to 69% of fathers.
- Similarly, 78% of mothers and 60% of fathers took responsibility for purchasing infant food.
- When it came to toys and services for infants, 80% of mothers and 59% of fathers were involved in the purchasing decision.
- In the area of infant education products and services, the disparity was more pronounced, with 73% of mothers assuming responsibility compared to 38% of fathers.
- For infant clothing and shoes, 83% of mothers reported making purchases, while only 35% of fathers took on this role.
- These figures highlight the significant role of mothers in managing the purchase of baby products in Chinese families, with fathers playing a supporting role, particularly in categories such as daily necessities and food.
(Source: Statista)
Household Income
- As of January 2022, the distribution of maternity and baby care product buyers in China varied significantly based on monthly household income.
- The largest share of respondents, 27.3%, belonged to households earning between 20,001 and 30,000 yuan per month.
- Close behind, 26.8% of buyers came from households with an income range of 15,001 to 20,000 yuan.
- Households earning between 10,001 and 15,000 yuan accounted for 15.8% of buyers, while those in the higher income bracket of 30,001 to 50,000 yuan comprised 13.8% of respondents.
- Buyers from households with incomes above 50,000 yuan represented 6% of the total, reflecting a smaller but significant segment of high-income consumers.
- Meanwhile, 8.9% of buyers came from households earning 5,000 to 10,000 yuan, and only 1.4% of respondents were from households with incomes below 5,000 yuan.
- These figures illustrate that the majority of maternity and baby care product buyers in China are concentrated in middle- to upper-middle-income households, highlighting the impact of disposable income on purchasing behavior in this market.
(Source: Statista)
Household Type
- In 2018, the purchase incidence of baby products in the United States varied significantly by household type.
- Households with children aged 0-1 year exhibited the highest purchasing activity, with 94% of respondents reporting the purchase of baby products.
- This was followed by households with children aged 1-5 years, where 66% of respondents purchased baby products.
- In contrast, only 16% of households without children under the age of 6 reported buying baby products.
- These figures highlight the strong correlation between the presence of young children in a household and the likelihood of purchasing baby-related items, with a notable drop-off in households without young children.
(Source: Statista)
Consumer Preferences and Trends
Key Criteria for Choosing Baby Care Products
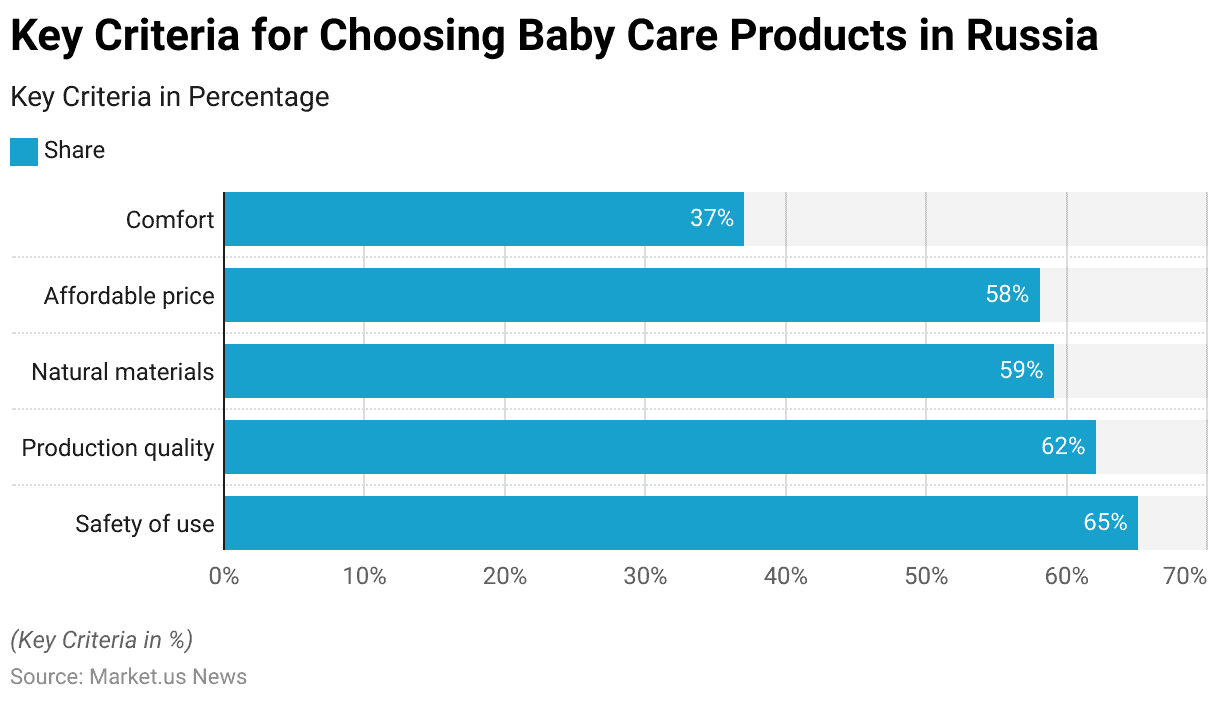
- In 2021, the most important characteristics for customers in Russia when choosing baby care and hygiene products were dominated by considerations of safety and quality.
- Safety of use was the top priority, cited by 65% of respondents, followed closely by production quality, which was important to 62%.
- The use of natural materials was also a key factor for 59% of customers, reflecting growing awareness of environmentally friendly and non-toxic options.
- Affordable pricing was a priority for 58% of respondents, highlighting the importance of cost-effectiveness in purchase decisions.
- Comfort was deemed important by 37% of respondents, making it a less critical but still notable consideration.
- These preferences underline the emphasis Russian consumers place on safe, high-quality, and sustainable products for their children, balanced with affordability.
(Source: Statista)
Brand Preference Among Baby Care Shoppers – By Brand Type
- In 2023, baby care shoppers in the United States demonstrated varied brand preferences.
- National brands were the most popular, preferred by 39% of respondents, reflecting trust in established and widely recognized brands.
- Store brands were chosen by 22% of shoppers, highlighting the appeal of affordability and convenience associated with retailer-specific products.
- Additionally, 22% of respondents expressed no preference for a specific brand, indicating flexibility in their purchasing decisions.
- These figures suggest a competitive market where brand loyalty to national brands coexists with a growing acceptance of store brands and non-branded options.
(Source: Statista)
Most Trusted Baby Product Brands
- In 2013, Johnson’s and Pampers were the most trusted baby product brands in the United Kingdom, each earning the trust of 77% of respondents.
- Huggies followed as the third most trusted brand, with 67% of respondents expressing confidence in its products.
- These rankings reflect the strong reputation and widespread recognition of these brands in the UK market, with Johnson’s and Pampers standing out as leaders in consumer trust for baby care products.
(Source: Statista)
Preference for Premium Baby Products Statistics
- In 2018, the willingness to pay for higher-quality baby products in Africa varied across countries.
- Ethiopia led the region, with 37% of respondents expressing a willingness to spend more on premium baby products.
- Cote d’Ivoire followed at 23%, while Angola and Nigeria each recorded 19%.
- In Ghana, 16% of consumers were willing to pay more for better quality, while Kenya saw 14% of respondents expressing the same sentiment.
- Morocco, Tanzania, and South Africa each had 10% of respondents willing to invest in higher-quality baby products.
- In Egypt and Algeria, the figure was slightly lower at 8%, while Uganda had the smallest share of respondents, at 7%.
- These figures indicate varying levels of prioritization for quality in baby products, with Ethiopia standing out as a market with the highest demand for premium options.
(Source: Statista)
Reasons Baby Care Shoppers Switch to Store Brands
- In 2023, baby care shoppers in the United States reported various reasons for switching to store brands.
- The most common reason, cited by 41% of respondents, was the availability of store-brand products, highlighting their accessibility.
- Additionally, 30% of respondents indicated that they chose store brands because they believed them to offer the best quality.
- Price sensitivity also played a role, with 24% preferring the lowest-priced items and 25% expressing annoyance with price changes in national brands.
- Speed and convenience influenced 21% of shoppers, who selected items they could get the fastest.
- Meanwhile, 5% of respondents reported none of these factors influenced their decision, suggesting other less common motivations.
- These findings underline a mix of practical considerations, including price, availability, and perceived quality, driving the shift toward store brands in the baby care market.
(Source: Statista)
Baby Skin Care Product Brand Preferences by Consumers
- As of July 2017, consumer preferences for baby skin care products in China demonstrated a notable inclination toward local brands.
- Among respondents, 30% somewhat preferred local brands, while an additional 28% expressed a strong preference for local brands, making local products the majority choice.
- In contrast, 25% of consumers somewhat preferred foreign brands, while only 17% strongly preferred foreign brands.
- These figures highlight a significant preference for domestic baby skin care products among Chinese consumers, with foreign brands appealing to a smaller yet considerable segment of the market.
(Source: Statista)
Baby Products Usage in Different Nations
India Baby Products Statistics
- In India, the usage of various baby products for children under 36 months exhibited shifts between 2016 and 2018.
- Disposable taped nappies were used by 6.69% of respondents in 2018, reflecting a slight decline from 7.20% in 2017 and 7.29% in 2016.
- Similarly, the usage of disposable pull-on pants increased marginally to 7.18% in 2018, remaining stable at 6.94% in both 2017 and 2016.
- Cloth nappies saw a steady increase, rising from 5.79% in 2016 to 6.67% in 2018, while cloth pull-on pants also gained popularity, growing from 3.11% in 2016 to 4.27% in 2018.
- Instant formula milk usage increased slightly, from 4.35% in 2016 to 4.98% in 2018.
- Grow-up formula milk usage rose steadily, from 3.71% in 2016 to 4.57% in 2018.
- The consumption of ready-prepared baby food also increased, reaching 5.46% in 2018 from 4.65% in 2016.
- Baby wipes remained the most frequently used product, with usage rising from 8.05% in 2016 to 8.79% in 2018.
- The proportion of respondents not using any of the listed products increased from 6.94% in 2016 to 8.59% in 2018.
- Respondents who reported not having children declined from 38.42% in 2016 to 30.93% in 2018, indicating growing engagement among parents.
- Those preferring not to answer remained relatively consistent at around 6.3%-6.6%.
- These trends highlight a gradual increase in the adoption of various baby products in India, driven by evolving consumer preferences and availability.
(Source: Statista)
United States Baby Products Statistics
- The usage of baby wash and bath products among the U.S. population has shown fluctuations between 2011 and 2024.
- In 2011, approximately 53.31 million consumers reported using these products, while 237.64 million did not, and 20.63 million were uncertain or did not respond.
- Usage peaked in 2013 with 63.65 million consumers, while the number of non-users slightly decreased to 234.83 million, and those uncertain dropped to 17.58 million.
- From 2014 to 2016, usage remained relatively steady, with 63.52 million consumers in 2015, but declined to 59.51 million in 2016 as the number of non-users rose to 244.17 million.
- Between 2017 and 2020, there was a gradual decline in users, with 58.02 million in 2017 and a drop to 53.74 million in 2020. During this period, the number of non-users steadily increased, reaching 260.65 million in 2020.
- From 2021 to 2024, the number of users stabilized at around 52 million, with 52.71 million projected in 2024. Meanwhile, the number of non-users grew consistently, reaching 270.71 million by 2024.
- The share of those uncertain or not responding remained relatively constant, ranging between 17.39 million and 20.63 million throughout the period.
- These trends suggest a gradual decrease in the usage of baby wash and bath products, with an increasing portion of the population opting not to use them or switching to alternatives.
(Source: Statista)
Saudi Arabia Baby Products Statistics
- In Saudi Arabia, the usage of baby products among households with children under 36 months exhibited notable changes between 2017 and 2018.
- Disposable taped nappies saw a decline in usage, dropping from 17.28% in 2017 to 14.35% in 2018, while disposable pull-on pants increased in popularity from 3.35% to 5.18%.
- Cloth nappies also saw a rise, from 2.49% in 2017 to 4.52% in 2018, and cloth pull-on pants grew modestly, from 7.62% to 8.09%.
- The use of instant formula milk increased from 7.80% in 2017 to 8.85% in 2018, while follow-on milk usage grew from 6.05% to 7.58%.
- Grow-up formula milk also gained traction, rising from 7.28% to 8.67%.
- Ready-prepared baby food saw a similar trend, with usage increasing from 6.62% in 2017 to 7.56% in 2018.
- Baby wipes remained consistently popular, though their usage decreased slightly from 14.22% in 2017 to 13.93% in 2018.
- The share of respondents not using any of these products grew from 2.92% to 4.91%, while those preferring not to answer decreased from 5.19% to 4.47%.
- The proportion of respondents without children dropped significantly, from 19.17% in 2017 to 11.90% in 2018, reflecting increased engagement in baby product usage during this period.
- These trends indicate evolving preferences and growing adoption of a variety of baby products among Saudi Arabian households.
(Source: Statista)
Thailand Baby Products Statistics
- In Thailand, the usage of baby products among households with children under 36 months demonstrated gradual changes between 2016 and 2018. Disposable taped nappies saw a steady increase in usage, rising from 6.59% in 2016 to 7.77% in 2018.
- Similarly, disposable pull-on pants remained the most popular choice, with a consistent usage rate of approximately 15.97% in 2018 compared to 15.65% in 2017 and 15.73% in 2016.
- Cloth nappies also gained popularity, increasing from 10.24% in 2016 to 11.59% in 2018, while cloth pull-on pants saw a modest rise from 2.25% in 2016 to 3% in 2018.
- Instant formula milk usage grew steadily, from 11.22% in 2016 to 12.26% in 2018, and follow-on milk consumption rose from 1.77% in 2016 to 2.99% in 2018.
- Grow-up formula milk showed a slight increase, from 6.14% in 2016 to 6.70% in 2018. Ready-prepared baby food usage also increased, reaching 10% in 2018 from 8.97% in 2016.
- Baby wipes consistently remained among the most widely used products, with usage increasing from 13.68% in 2016 to 14.51% in 2018.
- The proportion of respondents not using any baby products declined slightly, from 2.10% in 2016 to 1.99% in 2018. Similarly, the percentage of respondents without children dropped significantly, from 18.39% in 2016 to 11.63% in 2018. Respondents preferring not to answer decreased from 2.92% in 2016 to 1.59% in 2018.
- These trends reflect a growing adoption of baby products among Thai households, with consistent preferences for specific categories like disposable pull-on pants, wipes, and formula milk.
(Source: Statista)
Regulations for Baby Products
- Regulations for baby products are designed to ensure the safety, quality, and well-being of infants and young children, and they vary significantly by country.
- In the United States, the Consumer Product Safety Commission (CPSC) regulates baby products such as cribs, strollers, and toys under the Consumer Product Safety Act. For example, the CPSC mandates that cribs meet specific safety standards, including non-toxic finishes and secure slats.
- In the European Union, baby products must adhere to the European Standard EN 71 for toys, which specifies safety requirements for materials and construction.
- Additionally, the EU’s General Product Safety Directive (GPSD) ensures that all consumer products, including baby goods, are safe for use.
- In Australia, the Australian Competition and Consumer Commission (ACCC) oversees regulations like the Australian Standard AS/NZS 8124 for toys, requiring that they be free from choking hazards and toxic substances.
- Meanwhile, in China, the National Standards of China (GB) set specific guidelines for baby clothing, feeding bottles, and other infant products, with particular attention to chemical safety and durability.
- These regulations are enforced through mandatory testing, labeling requirements, and certification processes to protect consumers, with penalties for non-compliance.
- Given the global nature of the baby product market, manufacturers must navigate these diverse regulatory landscapes to ensure product safety, minimize recalls, and build consumer trust.
(Sources: CPSC, European Union, ACCC, National Standards of China (GB))
Recent Developments
Acquisitions and Mergers:
- In 2023, Pampers, one of the leading brands in baby care, acquired Lumi Pampers, a smart baby monitor company, to expand its product portfolio in the connected baby care space.
- The acquisition is expected to bring an innovative range of tech-enabled baby products to the market, including smart diapers and baby monitors, aligning with the growing demand for integrated health-tracking solutions for infants.
Product Launches:
- Cradlewise, a startup offering a smart crib designed to monitor a baby’s sleep and automatically adjust to soothe them, launched in 2023.
- The company reported a 50% increase in sales within the first six months of launch, as more parents sought tech-enabled solutions to improve sleep quality for their babies.
- The crib also comes with a mobile app that provides real-time updates on the baby’s sleep patterns.
Funding and Investments:
- Babylist: Babylist, a leading baby registry platform, raised $25 million in Series C funding in 2023. This funding is expected to accelerate Babylist’s growth by enhancing its personalized baby product recommendation engine and expanding its consumer reach through targeted marketing efforts and strategic partnerships with brands.
- Market Insights: Investors are increasingly focusing on digital-first platforms in the baby care market, where convenience, personalization, and seamless shopping experiences are key differentiators. The rise of online baby product platforms has led to a 28% increase in venture capital investments in 2023, with over $900 million raised across digital baby startups.
Partnerships and Collaborations:
- In 2023, Huggies partnered with Amazon to launch a subscription-based service offering Huggies products at a discounted price for Prime members.
- The collaboration aims to provide parents with a convenient and affordable way to access essential baby products while promoting brand loyalty.
- Since its launch, the service has seen a 40% increase in subscription sign-ups within the first three months.
Conclusion
Baby Products Statistics – The global baby products market is experiencing steady growth, driven by increasing awareness of child health, rising disposable incomes, and evolving consumer preferences.
Key trends include a growing demand for premium and organic products, with safety, quality, and affordability as top priorities for parents.
Regional differences shape the market, with developed regions favoring eco-friendly options and emerging markets emphasizing affordability.
Supermarkets, hypermarkets, and online platforms dominate distribution, reflecting consumer preference for convenience.
Despite challenges like price sensitivity and shifting behaviors, the market is poised for continued expansion, fueled by urbanization, e-commerce growth, and product innovation.
FAQs
Essential products include diapers, baby wipes, clothing, baby bottles, pacifiers, a crib or bassinet, baby blankets, car seats, and a stroller. Additionally, items like baby shampoo, soap, lotion, and formula milk (if not breastfeeding) are commonly needed.
Parents should prioritize safety, product quality, and suitability for the baby’s age. Other factors include price, brand reputation, hypoallergenic materials, and whether the product is eco-friendly or organic.
Organic baby products, such as food, clothing, and skincare, are often free from harmful chemicals, pesticides, and artificial additives, making them a safer choice for babies with sensitive skin or allergies. However, the decision depends on individual preferences and budgets.
Popular brands include Pampers, Johnson’s, Huggies, Gerber, Chicco, and Aveeno Baby, which are known for their reliability and safety standards. Brand preferences vary by region and product type.
Skincare products labeled as hypoallergenic, dermatologically tested, and free of parabens, sulfates, and artificial fragrances are generally safer for babies. Brands like Cetaphil Baby and Aveeno Baby are popular choices.
Discuss your needs with our analyst
Please share your requirements with more details so our analyst can check if they can solve your problem(s)


