

Table of Contents
- Introduction
- Editor’s Choice
- Agricultural and Food Production Output Across Major Nations
- Global Food and Nutrition Consumption Statistics
- Global Food and Nutrition Consumption – By Food Product Group Statistics
- Ideal Food and Nutrition Intake Requirements and Guidelines Statistics
- Ideal Intake of Essential Nutrients
- Global Food Energy Intake
- Calorie Consumption – By Nation
- Basic Facts Related to Hunger and Nutrition
- Global Hunger Index (GHI) Score
- Malnutrition and Undernutrition Statistics
- Global Food and Nutrition with Obesity Statistics
- Food and Nutrition Security Statistics
- Food Prices and Its Impact on Nutrition Statistics
- Food and Nutrition Environmental Impact Statistics
- Latest Food and Nutrition Trends and Statistics
- Recent Developments
- Conclusion
- FAQs
Introduction
Food and Nutrition Statistics: Understanding food and nutrition is crucial for maintaining health.
Macronutrients like carbohydrates, proteins, and fats provide energy and support bodily functions, while micronutrients such as vitamins and minerals are essential for various physiological processes.
Adequate hydration is also vital. Dietary guidelines advocate for a balanced diet rich in fruits, vegetables, whole grains, lean proteins, and healthy fats while limiting added sugars, sodium, and saturated fats.
Nutritional labeling helps individuals make informed choices about packaged foods. A balanced diet not only reduces the risk of chronic diseases but also enhances energy levels and overall well-being.
Special considerations must be taken for specific populations and medical conditions. By grasping these fundamentals, individuals can make healthier dietary choices and improve their quality of life.
Editor’s Choice
- The global dietary supplements market size is expected to be worth around USD 306 billion by 2033, from USD 156 billion in 2023, growing at a CAGR of 7.0% during the forecast period from 2023 to 2033.
- In 2022, China maintained its position as the foremost agricultural powerhouse globally, boasting an impressive annual output worth $1.66 trillion, with $1.62 trillion dedicated to food production.
- In 2022, bread and cereal products led to food consumption with 645.27 million metric tons, followed by vegetables at 513.94 million metric tons.
- In 2018, Ireland led the world in average daily dietary energy consumption per capita, with an intake of 16,520 kilojoules.
- Bahrain led with the highest average daily calorie intake in 2021, where individuals consumed 4,012 kilocalories per day.
- Global hunger showed little change from 2021 to 2022 but remained significantly higher than pre-COVID-19 levels, affecting approximately 9.2% of the global population in 2022 compared to 7.9% in 2019.
- In 2022, around 390 million adults globally were underweight, while a staggering 2.5 billion were overweight, with 890 million classified as obese.
- In 2021, the share of the population that could not afford a healthy diet remained alarmingly high in several countries. Madagascar led with 97.8% of its population unable to afford a healthy diet, up from 97.1% in 2020.

Agricultural and Food Production Output Across Major Nations
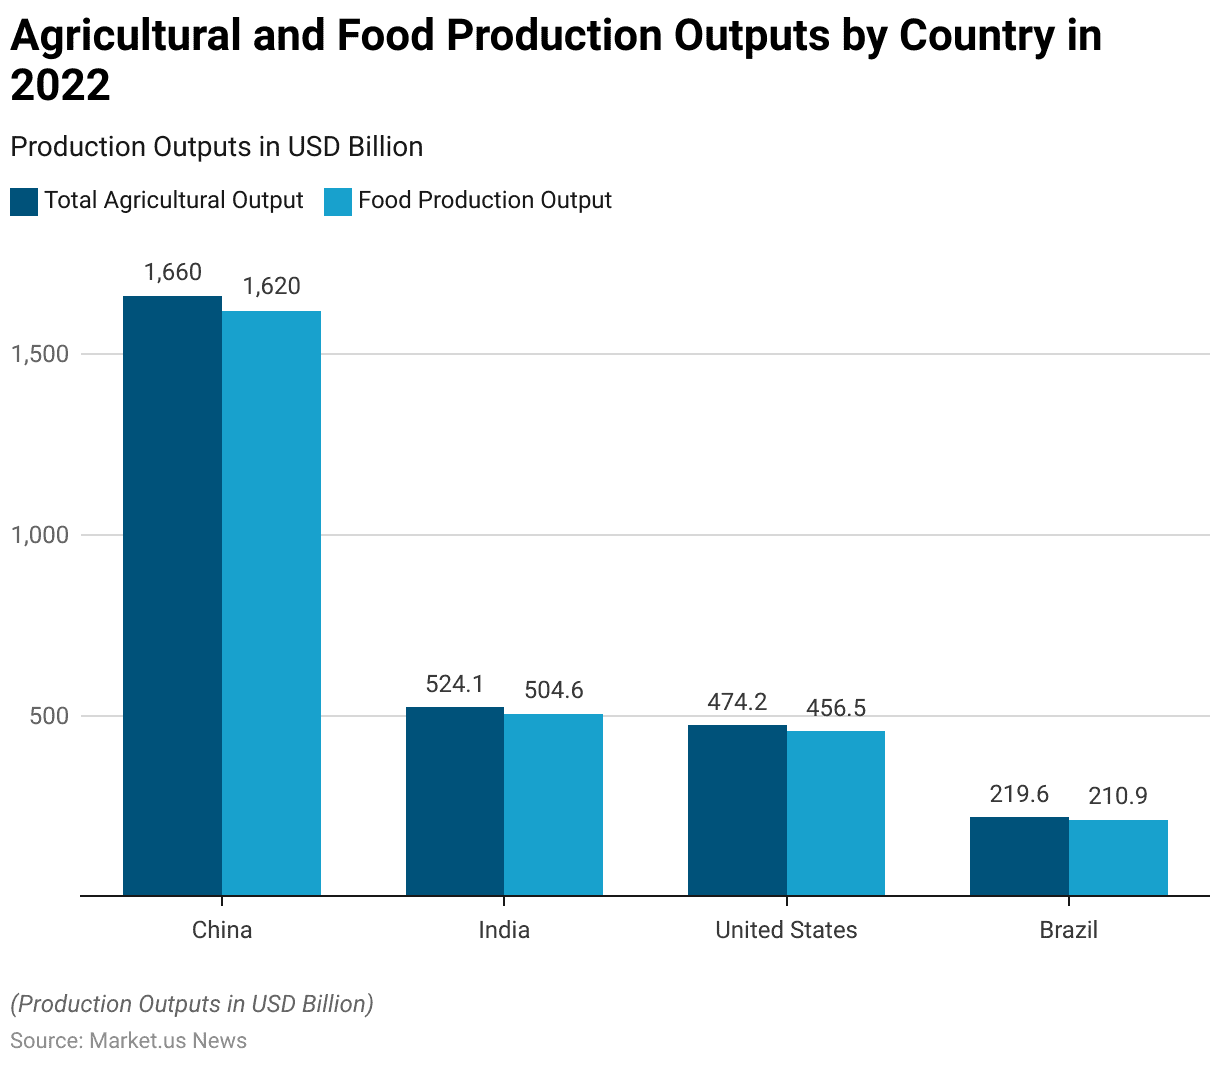
- In 2022, China maintained its position as the foremost agricultural powerhouse globally, boasting an impressive annual output worth $1.66 trillion, with $1.62 trillion dedicated to food production, as reported by the Food and Agriculture Organization (FAO) of the United Nations.
- Following closely, India, the world’s most populous nation, secured the second spot with an agricultural output valued at $524.1 billion, of which $504.6 billion was attributed to food.
- Despite a significantly smaller agricultural workforce compared to China and India, the United States clinched the third position with an output of $474.2 billion, $456.5 billion of which contributed to food production.
- Brazil secured the fourth position with an agricultural output worth $219.6 billion, with $210.9 billion allocated to food production.
(Source: Food and Agriculture Organization (FAO) of the United Nations)
Global Food and Nutrition Consumption Statistics
Global Per Capita Food and Nutrition Consumption Across Various Categories Statistics
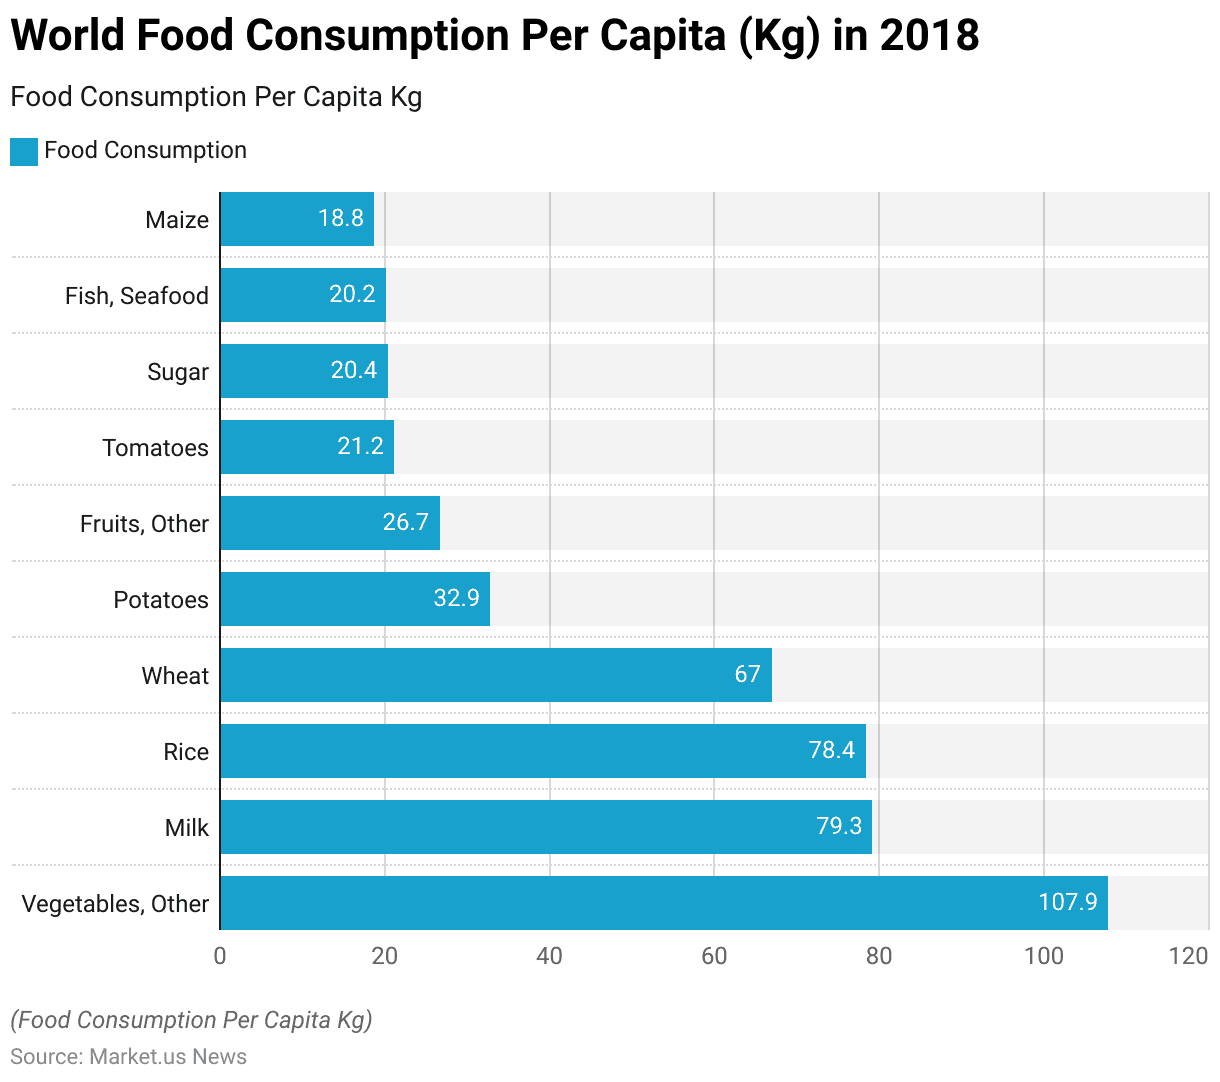
- In 2018, global per capita food consumption demonstrated diverse dietary patterns across various food categories.
- Vegetables, other than tomatoes, topped the list with an average consumption of 107.9 kilograms per person.
- Milk followed as a significant component of diets worldwide, with a per capita consumption of 79.3 kilograms.
- Rice and wheat were also staple foods, consumed at 78.4 and 67 kilograms per person, respectively.
- Potatoes had a considerable presence in global diets, with a consumption rate of 32.9 kilograms per capita.
- Other fruits were consumed at 26.7 kilograms per person, while tomatoes specifically accounted for 21.2 kilograms per capita.
- Sugar was a notable part of the diet, with a consumption rate of 20.4 kilograms per person, closely followed by fish and seafood at 20.2 kilograms.
- Maize rounded out the list with an average consumption of 18.8 kilograms per person.
- This data illustrates the varied dietary preferences and the importance of different food categories in global consumption patterns for the year 2018.
(Source: Food and Agriculture Organization (FAO) of the United Nations)
Average Amount of Food and Nutrition Consumed Per Person – By Continent Statistics
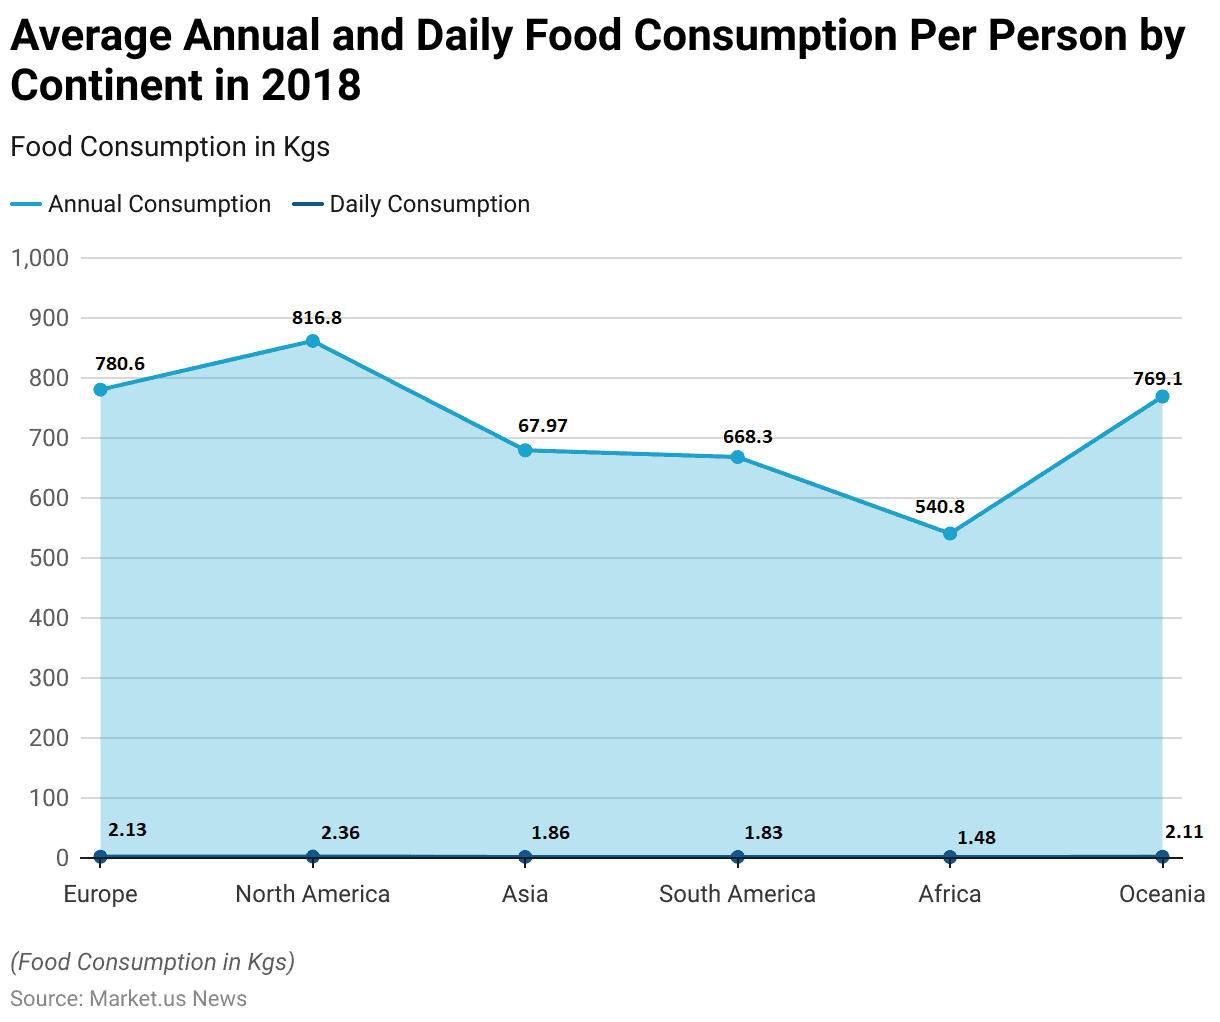
- In 2018, the average amount of food consumed per person varied significantly across continents.
- North America, encompassing the USA and Canada, had the highest annual per capita food consumption at 861.8 kilograms, averaging 2.36 kilograms per day.
- Europe followed with an annual consumption of 780.6 kilograms per person, or 2.13 kilograms daily.
- Oceania also showed high consumption levels, with an average of 769.1 kilograms per person annually, translating to 2.11 kilograms per day.
- Asia’s per capita food consumption was 679.7 kilograms per year, or 1.86 kilograms per day, while South America recorded 668.3 kilograms annually, equating to 1.83 kilograms daily.
- Africa had the lowest average, with 540.8 kilograms consumed per person annually, or 1.48 kilograms per day.
- These figures reflect the diverse dietary patterns and food availability across different regions of the world.
(Source: Food and Agriculture Organization (FAO) of the United Nations)
Global Food and Nutrition Consumption – By Food Product Group Statistics
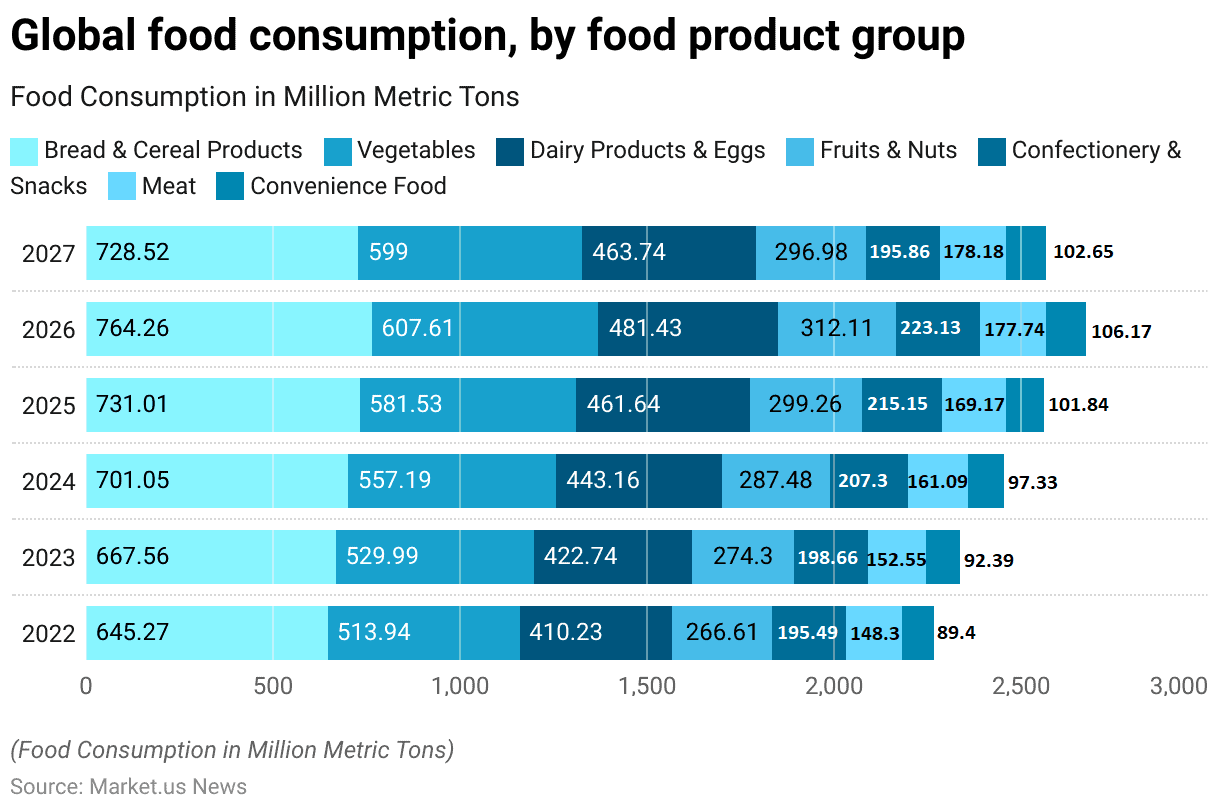
- Global food consumption across various food product groups has shown notable trends from 2022 to 2027. In 2022, bread and cereal products led consumption with 645.27 million metric tons, followed by vegetables at 513.94 million metric tons.
- Dairy products and eggs, fruits and nuts, confectionery and snacks, meat, and convenience food were consumed in quantities of 410.23, 266.61, 195.49, 148.3, and 89.4 million metric tons, respectively.
- The following year, 2023, saw increases across all categories, with bread and cereal products rising to 667.56 million metric tons, vegetables to 529.99 million metric tons, and dairy products and eggs to 422.74 million metric tons.
- Fruits and nuts, confectionery and snacks, meat, and convenience food also increased to 274.3, 198.66, 152.55, and 92.39 million metric tons, respectively.
- This upward trend continued into 2024, with bread and cereal products reaching 701.05 million metric tons and vegetables 557.19 million metric tons. Dairy products and eggs grew to 443.16 million metric tons, while fruits and nuts reached 287.48 million metric tons.
- Confectionery and snacks, meat, and convenience food consumption also increased to 207.3, 161.09, and 97.33 million metric tons, respectively.
(Source: Statista)
Food and Nutrition Future Projections Statistics
- The growth is expected to persist through 2025, with bread and cereal products at 731.01 million metric tons and vegetables at 581.53 million metric tons. Dairy products and eggs are anticipated to climb to 461.64 million metric tons, with fruits and nuts at 299.26 million metric tons.
- Confectionery and snacks, meat, and convenience food are expected to further increase to 215.15, 169.17, and 101.84 million metric tons, respectively.
- By 2026, bread and cereal products consumption is likely to rise to 764.26 million metric tons, vegetables to 607.61 million metric tons, and dairy products and eggs to 481.43 million metric tons.
- Fruits and nuts consumption is expected to grow to 312.11 million metric tons, with confectionery and snacks reaching 223.13 million metric tons, meat 177.74 million metric tons, and convenience food 106.17 million metric tons.
- However, in 2027, a slight decrease is expected in bread and cereal products, which is projected to fall to 728.52 million metric tons, and vegetables, which is likely to drop to 599 million metric tons.
- Dairy products and eggs consumption is also expected to decrease to 463.74 million metric tons, while fruits and nuts decline to 296.98 million metric tons.
- Confectionery and snack consumption are expected to decrease to 195.86 million metric tons, but meat and convenience food consumption slightly adjust to 178.18 and 102.65 million metric tons, respectively.
- This data highlights dynamic consumption patterns and varying growth rates across different food product groups over the five years.
(Source: Statista)
Ideal Food and Nutrition Intake Requirements and Guidelines Statistics
For Adults
- A nutritious adult diet includes a variety of fruits, vegetables, legumes, nuts, and whole grains like maize, millet, oats, wheat, and brown rice.
- Aim for at least 400 grams of fruits and veggies daily, excluding starchy roots.
- Keep free sugars to less than 10% of total energy intake, ideally under 5%, and minimize fats to under 30% of total energy intake.
- Choose unsaturated fats from sources like fish, avocado, nuts, and certain oils over saturated fats found in fatty meats and dairy.
- Limit saturated fats to less than 10% of total energy intake and trans-fats to less than 1%, avoiding industrially-produced trans-fats altogether.
- Lastly, limit salt to less than 5 grams per day, ensuring it’s iodized for added health benefits.
(Source: World Health Organization (WHO)
For Infants and Young Children
- In the initial two years of a child’s life, proper nutrition supports healthy growth and cognitive development and lowers the risk of obesity and non-communicable diseases in the future.
- Guidance for a healthy diet in infants and young children mirrors that of adults, with specific emphasis on exclusive breastfeeding for the first six months, continued breastfeeding until at least two years of age, and introduction of diverse, safe, and nutrient-rich foods alongside breast milk starting from six months onwards.
- This comprehensive approach ensures optimal nourishment for their development and well-being.
(Source: World Health Organization (WHO))
Ideal Intake of Essential Nutrients
- Daily values for nutrients serve as guidelines for maintaining a balanced diet and optimal health. These values include recommendations for various essential nutrients such as calcium, iron, vitamins, and minerals.
- For instance, it’s suggested to limit added sugars to 50 grams per day and saturated fat to 20 grams.
- Conversely, nutrients like calcium, potassium, and dietary fiber should be consumed in higher quantities, with recommended daily values of 1300 milligrams, 4700 milligrams, and 28 grams, respectively.
- These values help individuals make informed choices about their dietary intake to meet their nutritional needs and support overall well-being.
(Source: Food and Drug Administration (FDA))
Global Food Energy Intake
Food Energy Intake – By Country
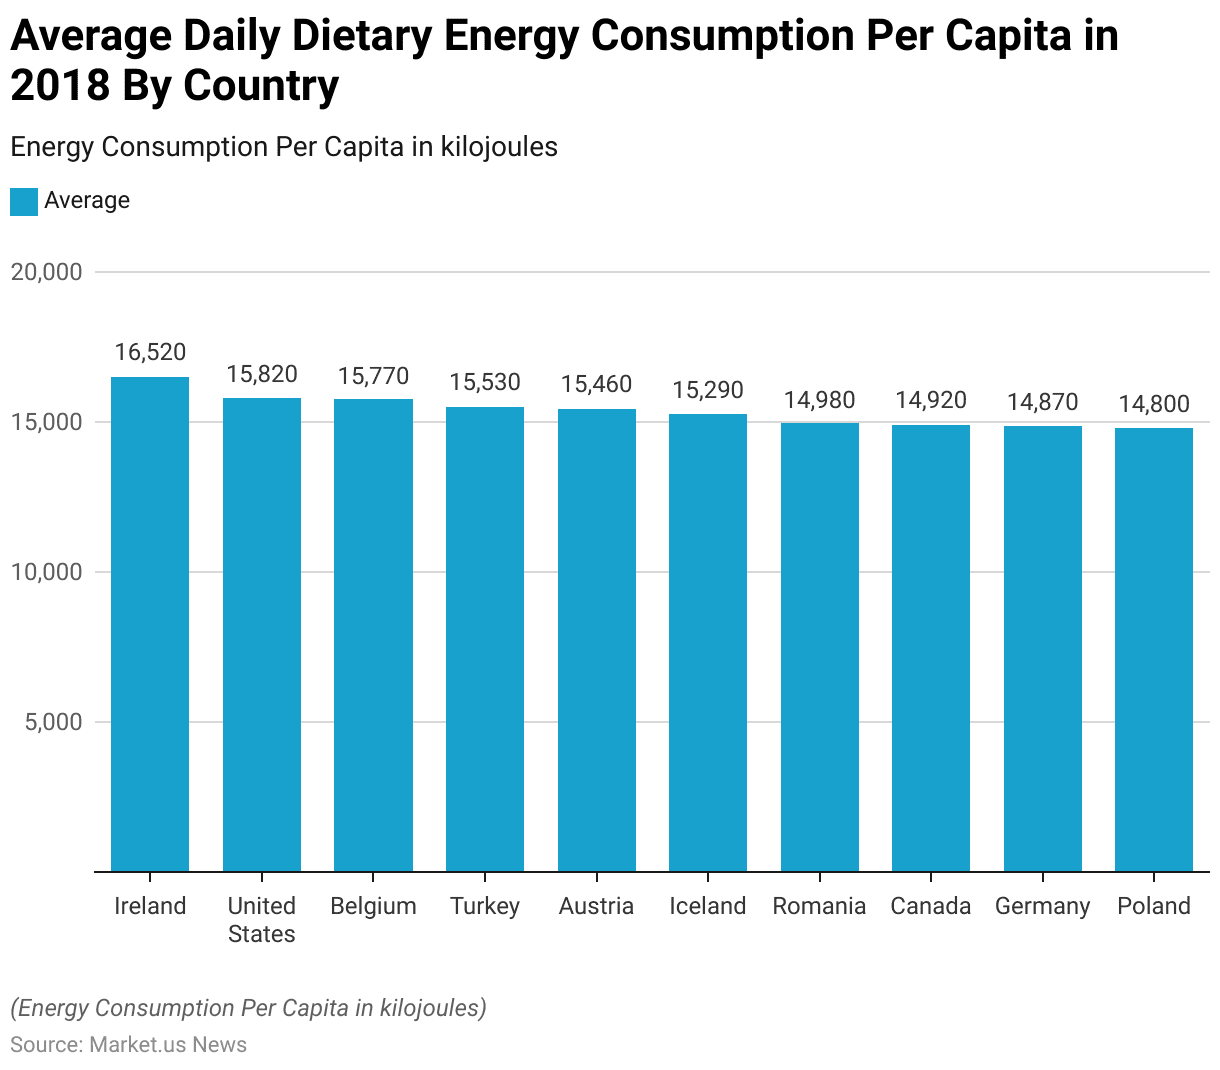
- In 2018, Ireland led the world in average daily dietary energy consumption per capita, with an intake of 16,520 kilojoules.
- The United States followed closely, where individuals consumed an average of 15,820 kilojoules per day.
- Belgium was not far behind, with an average daily consumption of 15,770 kilojoules per person. Turkey and
- Austria also ranked high on the list, with daily intakes of 15,530 and 15,460 kilojoules, respectively. Iceland’s average consumption stood at 15,290 kilojoules per capita.
- Romania, Canada, Germany, and Poland had slightly lower but still substantial daily energy intakes, with averages of 14,980, 14,920, 14,870, and 14,800 kilojoules per person, respectively.
- These figures reflect the dietary energy patterns in various countries, highlighting significant variations in daily energy consumption across the globe in 2018.
(Source: Food and Agriculture Organization (FAO) of the United Nations)
Food Energy Intake – By Region
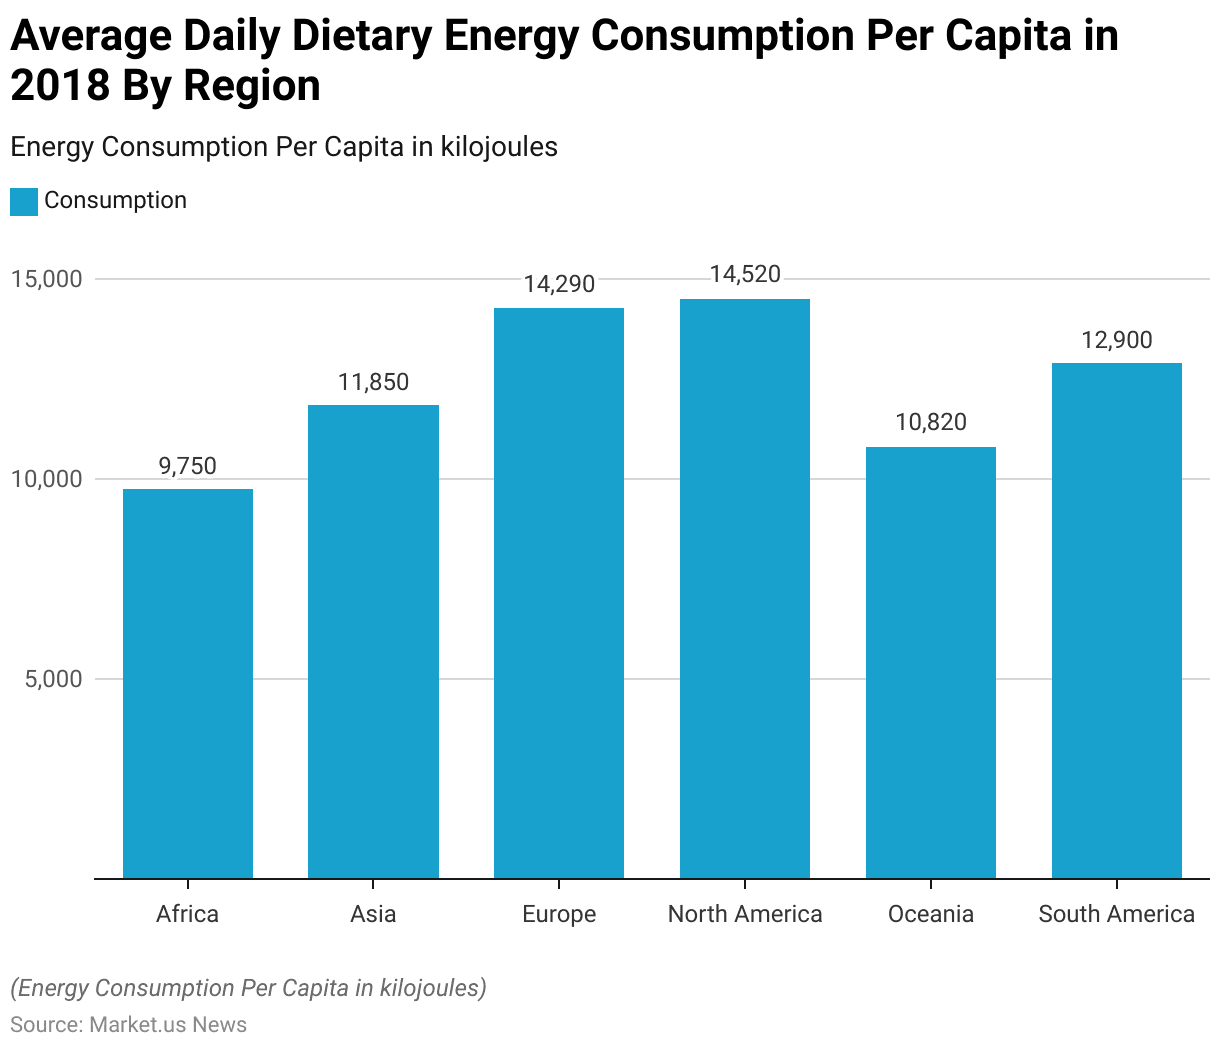
- In 2018, global dietary energy consumption per capita exhibited significant regional variations.
- North America had the highest average daily energy intake, with individuals consuming 14,520 kilojoules per day.
- Europe followed closely with an average consumption of 14,290 kilojoules per capita.
- South America also reported substantial dietary energy intake, averaging 12,900 kilojoules per person daily.
- In Asia, the average daily energy consumption per capita was 11,850 kilojoules, reflecting moderate dietary energy levels.
- Oceania’s average intake stood at 10,820 kilojoules per person, while Africa had the lowest average daily energy consumption, with individuals consuming 9,750 kilojoules per day.
- These figures illustrate the diverse dietary energy consumption patterns across different regions of the world in 2018.
(Source: Food and Agriculture Organization (FAO) of the United Nations)
Per Capita Kilocalorie Supply from All Foods Per Day
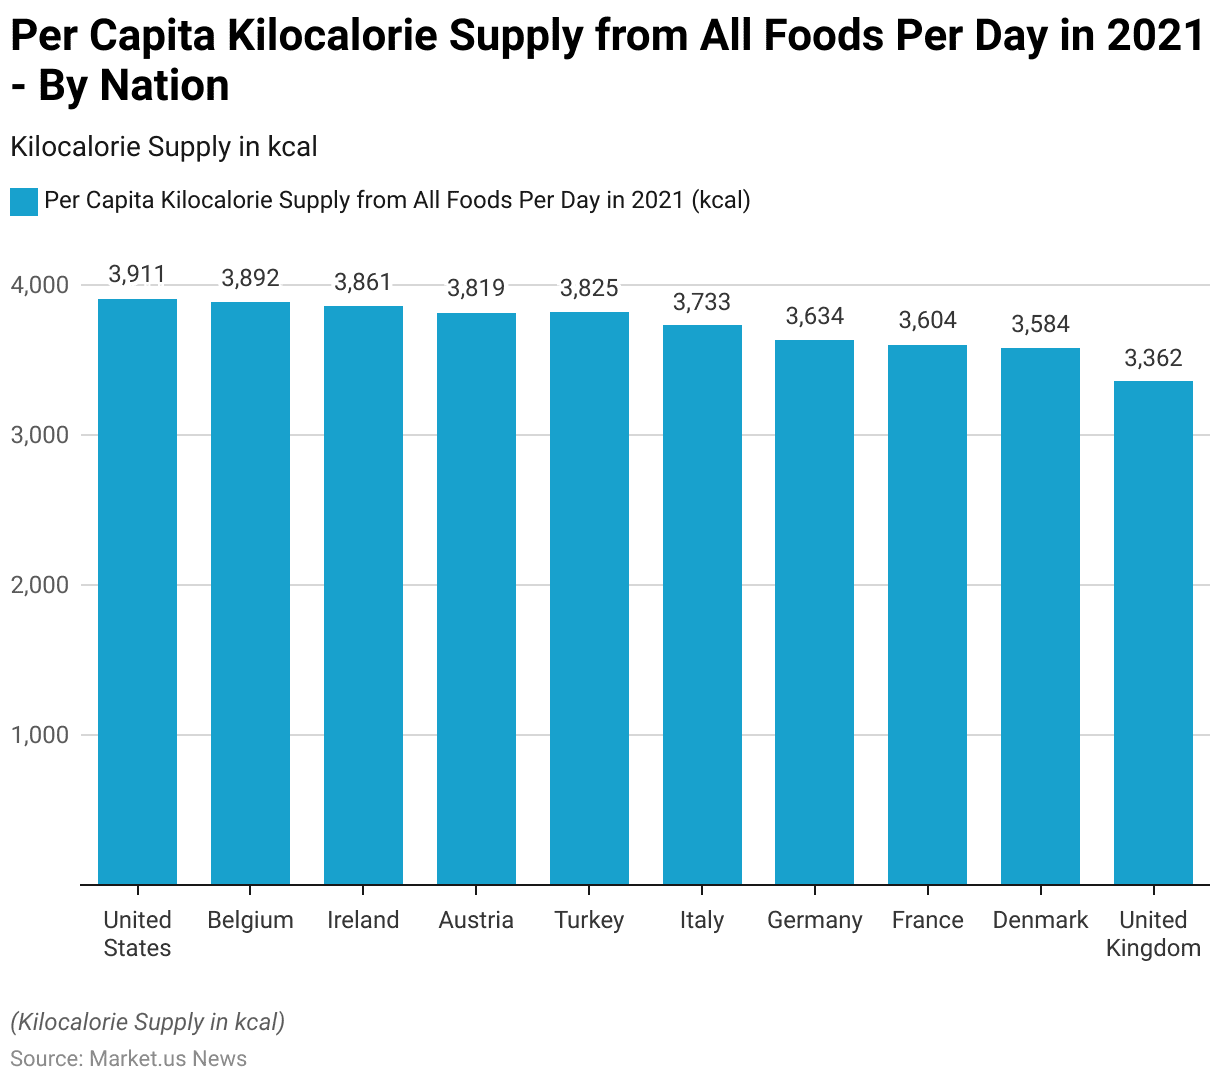
- In 2021, the per capita kilocalorie supplies from all foods varied significantly among different countries.
- The United States led with the highest daily intake, averaging 3,911 kilocalories per person. Belgium followed closely with 3,892 kilocalories per capita per day.
- Ireland and Austria also had high caloric supplies, with 3,861 and 3,819 kilocalories, respectively.
- Turkey and Italy reported substantial daily intakes of 3,825 and 3,733 kilocalories per person, respectively.
- Germany and France had daily supplies of 3,634 and 3,604 kilocalories per capita.
- Denmark recorded an average of 3,584 kilocalories per person per day, while the United Kingdom rounded out the list with 3,362 kilocalories.
- These figures highlight the differences in daily food energy availability across these countries.
(Source: Our World in Data)
Calorie Consumption – By Nation
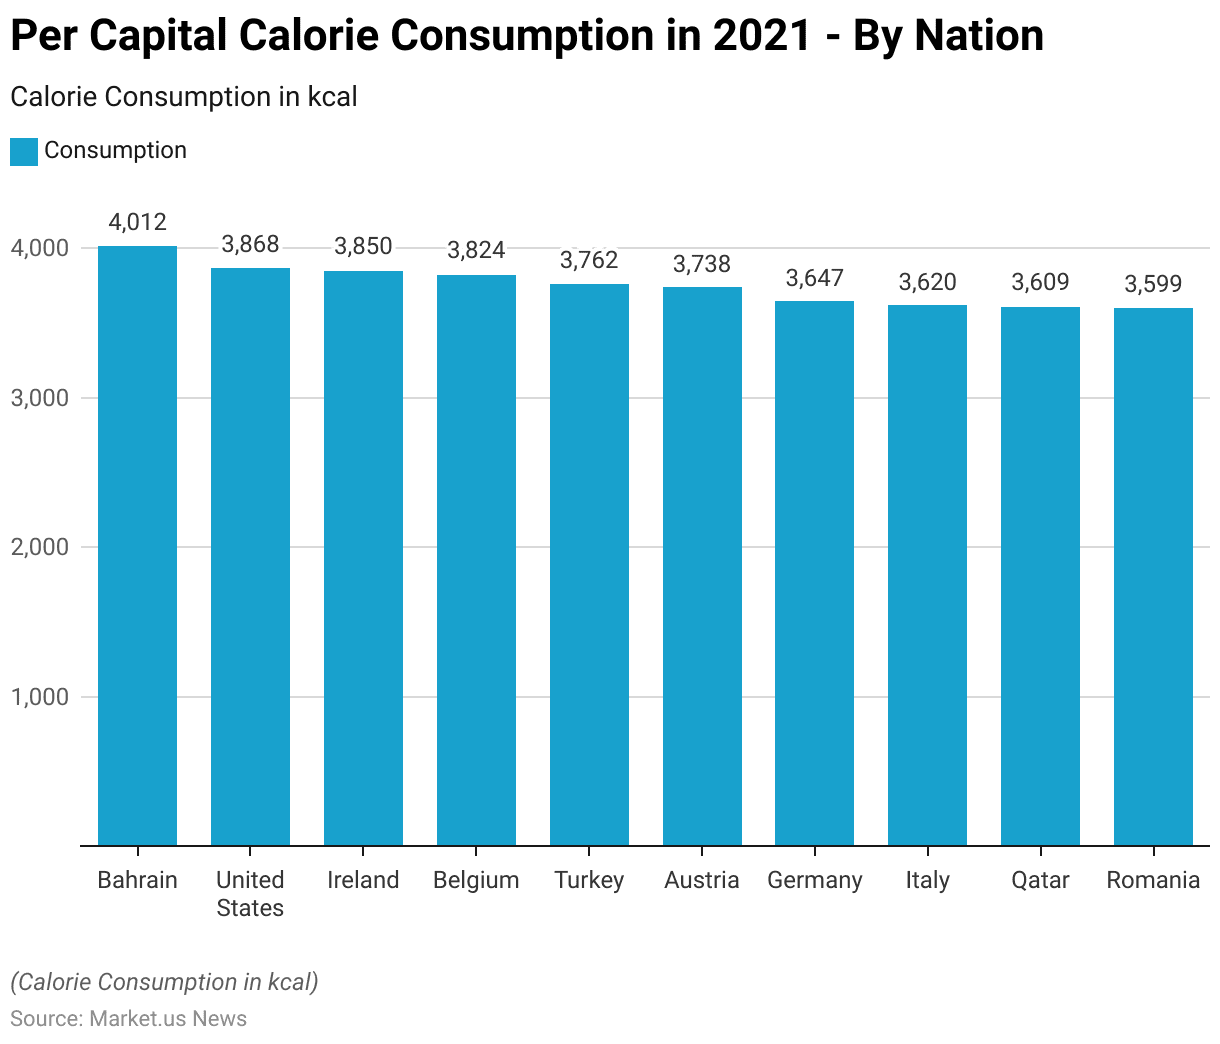
- In 2021, per capita calorie consumption varied widely among different countries.
- Bahrain led with the highest average daily intake, where individuals consumed 4,012 kilocalories per day.
- The United States followed with an average consumption of 3,868 kilocalories per person.
- Ireland and Belgium also reported high-calorie intakes, with averages of 3,850 and 3,824 kilocalories per day, respectively.
- Turkey and Austria recorded per capita intakes of 3,762 and 3,738 kilocalories, respectively.
- Germany’s average daily consumption stood at 3,647 kilocalories, while Italy reported 3,620 kilocalories per person.
- Qatar had a similar intake level with an average of 3,609 kilocalories per capita, and Romania rounded out the list with a daily average of 3,599 kilocalories.
- These figures highlight the substantial differences in dietary energy consumption across these nations in 2021.
(Source: Our World in Data)
Basic Facts Related to Hunger and Nutrition
- Global hunger showed little change from 2021 to 2022 but remained significantly higher than pre-COVID-19 levels, affecting approximately 9.2% of the global population in 2022 compared to 7.9% in 2019.
- Projections indicate that nearly 600 million people will suffer from chronic undernourishment by 2030, with the pandemic and the conflict in Ukraine contributing to an additional 119 million undernourished individuals.
- Food insecurity varied across regions, with one-third of rural adults experiencing moderate to severe food insecurity in 2022, compared to 28.8% in peri-urban areas and 26% in urban areas.
- The global gender gap in food insecurity narrowed from 3.8 to 2.4 percentage points between 2021 and 2022.
- Urbanization poses challenges such as the prevalence of unhealthy fast food, limited access to fresh produce, marginalization of small-scale farmers, and environmental degradation due to urban expansion.
- In eleven African countries examined, processed food consumption is more common in urban areas but remains significant in peri-urban and rural regions.
(Source: United Nations (UN))
Global Hunger Index (GHI) Score
Variation in World GHI Scores
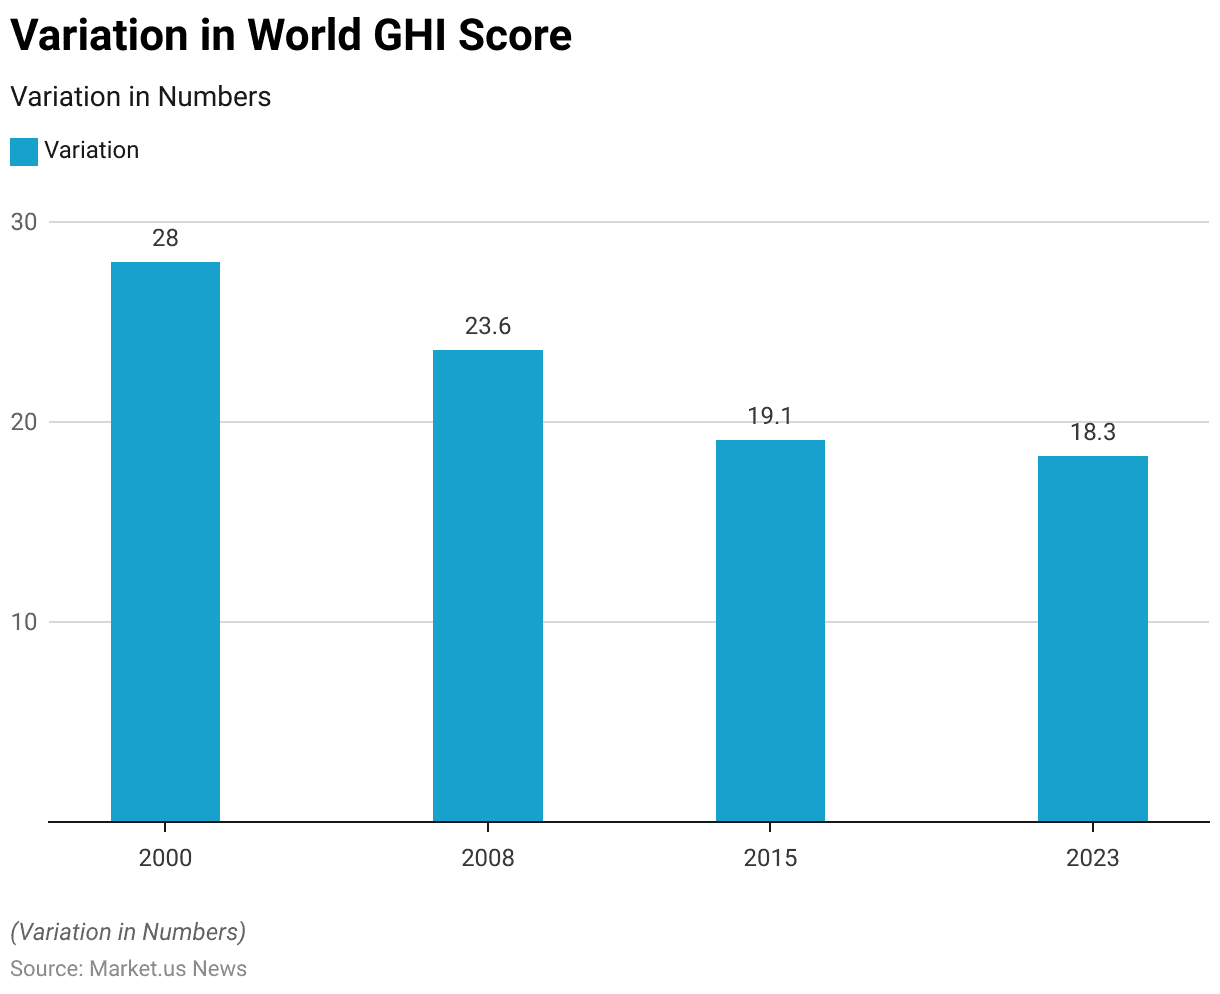
- The Global Hunger Index (GHI) score has shown a significant decline over the years, reflecting improvements in global hunger levels.
- In 2000, the world GHI score was 28, indicating a high level of hunger.
- By 2008, this score had decreased to 23.6, marking a notable improvement.
- Continued progress was observed in 2015, with the GHI score further reducing to 19.1.
- By 2023, the world GHI score had reached 18.3, demonstrating a steady reduction in global hunger over the past two decades.
- These trends highlight the positive strides made in addressing food security and nutrition worldwide.
(Source: 2023 Global Hunger Index Report)
GHI Score – By Region
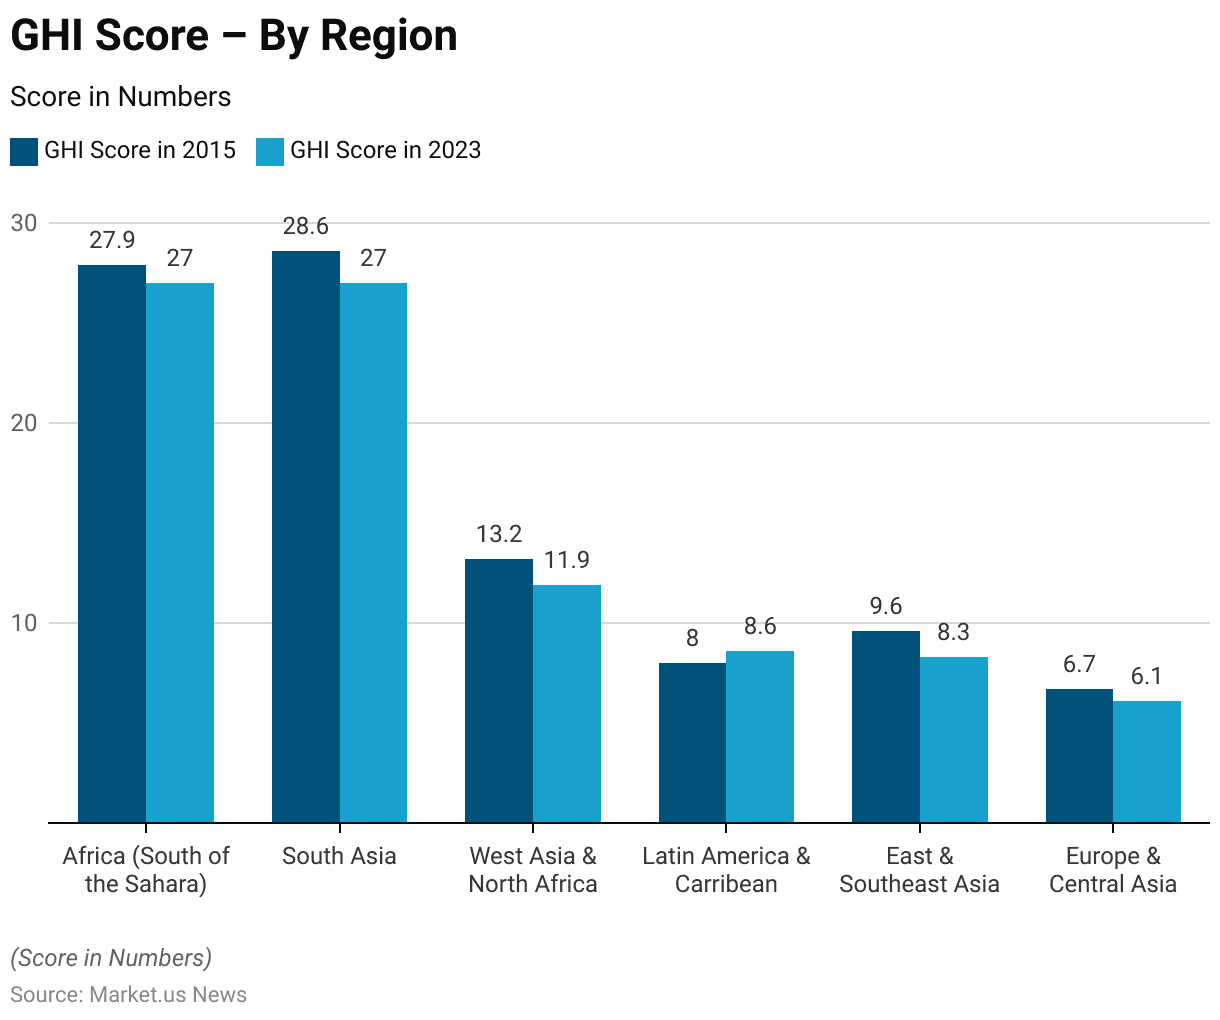
- Between 2015 and 2023, the Global Hunger Index (GHI) scores across various regions exhibited both progress and challenges in reducing hunger.
- In Africa, south of the Sahara, the GHI score slightly improved from 27.9 in 2015 to 27 in 2023.
- Similarly, South Asia saw a reduction in its GHI score from 28.6 to 27 during the same period.
- West Asia and North Africa experienced a modest improvement, with the GHI score decreasing from 13.2 to 11.9.
- Conversely, Latin America and the Caribbean faced a slight increase in hunger levels, as the GHI score rose from 8 to 8.6.
- East and Southeast Asia showed positive progress, reducing their GHI score from 9.6 to 8.3.
- Europe and Central Asia maintained relatively low hunger levels, with the GHI score improving from 6.7 to 6.1.
- These variations illustrate the differing degrees of success in combating hunger across regions over the eight years.
(Source: 2023 Global Hunger Index Report)
Malnutrition and Undernutrition Statistics
- In 2022, around 390 million adults globally were underweight, while a staggering 2.5 billion were overweight, with 890 million classified as obese.
- Among children and teenagers aged 5-19 years, 390 million were overweight, including 160 million diagnosed with obesity, and an additional 190 million faced thinness.
- Additionally, an estimated 149 million children under five years old suffered from stunting, while 37 million dealt with being overweight or obese.
- It’s distressing to note that nearly half of all deaths among children under five years old are linked to undernutrition, and sadly, these tragedies are disproportionately concentrated in low- and middle-income countries.
(Source: World Health Organization (WHO))
Prevalence of Stunting Among Children Under 5 Years of Age
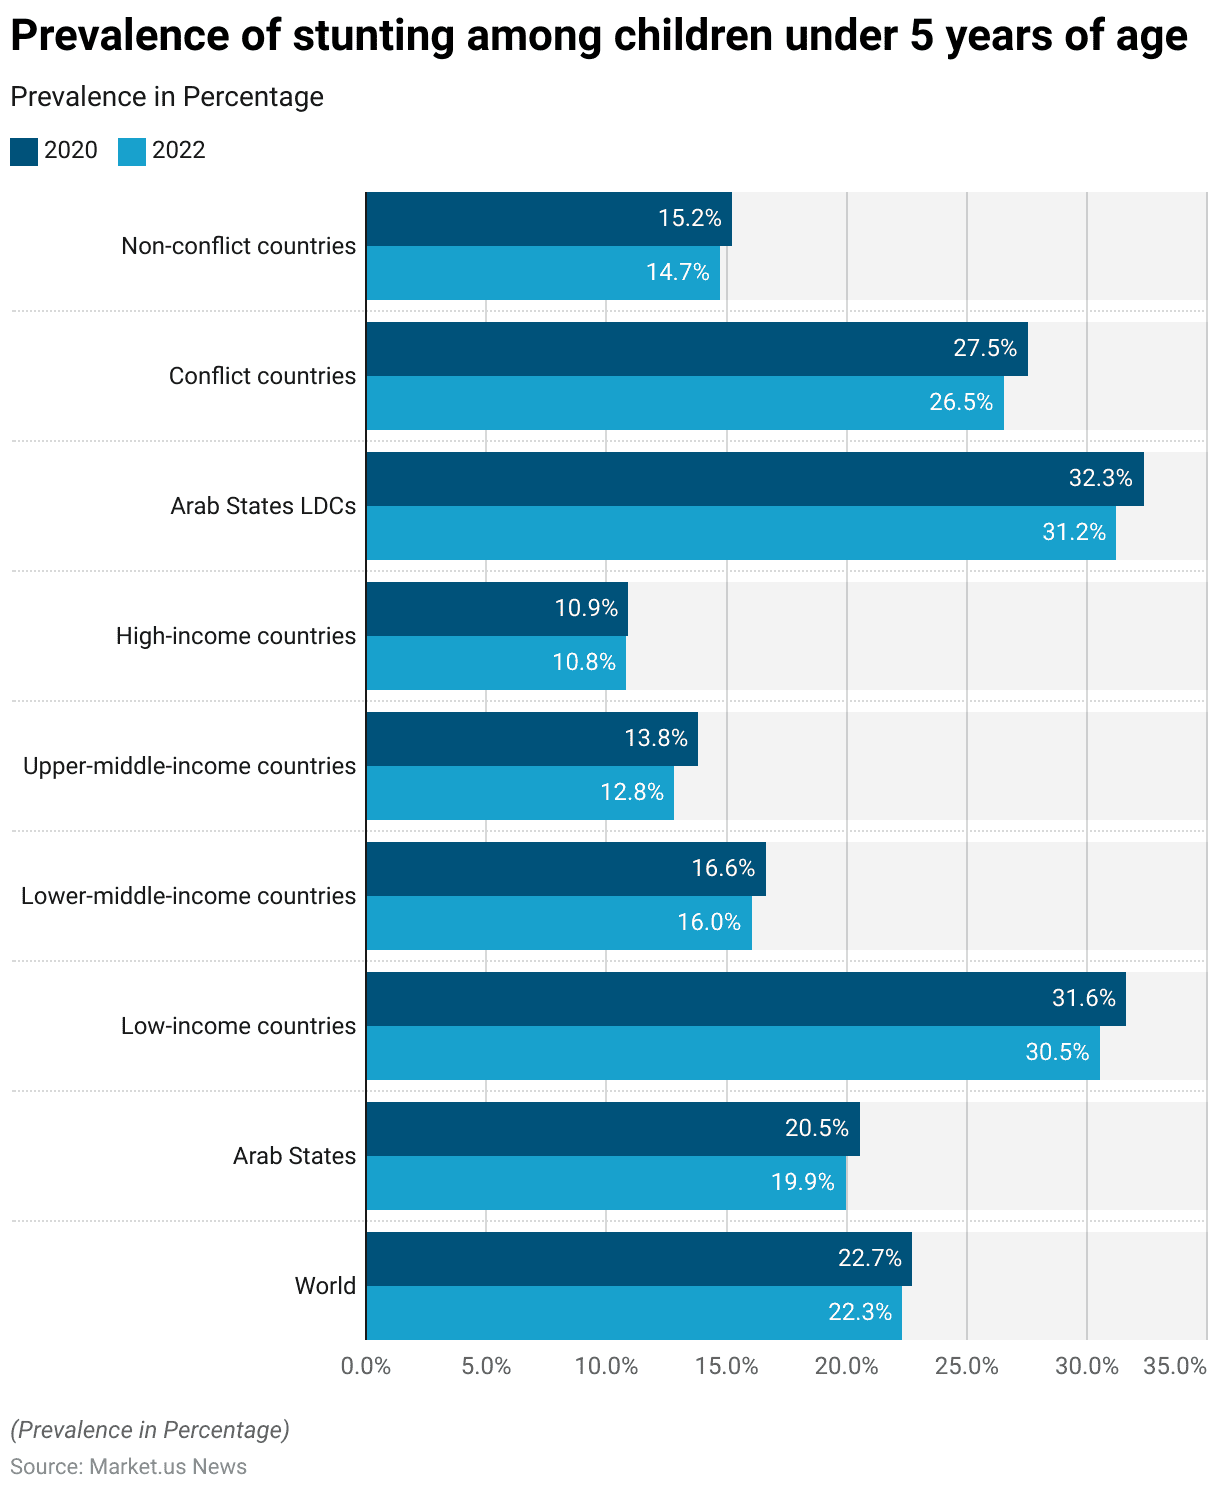
- The prevalence of stunting among children under five years of age showed a slight decline between 2020 and 2022 across various regions.
- Globally, stunting rates decreased from 22.7% in 2020 to 22.3% in 2022.
- In the Arab States, the prevalence dropped from 20.5% to 19.9%.
- Low-income countries experienced a reduction from 31.6% to 30.5%, while lower-middle-income countries saw a decrease from 16.6% to 16%.
- Upper-middle-income countries improved from 13.8% to 12.8%, and high-income countries saw a marginal decline from 10.9% to 10.8%.
- Among Arab States classified as least developed countries (LDCs), the stunting rate fell from 32.3% to 31.2%.
- In conflict-affected countries, the prevalence decreased from 27.5% to 26.5%, and in non-conflict countries, it reduced from 15.2% to 14.7%.
- These figures highlight ongoing efforts to combat child malnutrition, though challenges remain, particularly in low-income and conflict-affected regions.
(Source: UNICEF)
Global Food and Nutrition with Obesity Statistics
- In 2022, the global overweight population among adults aged 18 and older reached 2.5 billion, with 890 million suffering from obesity, marking a significant increase from 1990.
- This equates to 43% of adults being overweight, up from 25% in 1990.
- Overweight prevalence varied by region, ranging from 31% in certain areas to 67% in others.
- Additionally, about 16% of adults worldwide were classified as obese in 2022, more than double the rate in 1990.
- The issue extends beyond adults, with approximately 37 million children under five years and over 390 million children and adolescents aged 5–19 years worldwide being overweight.
- This represents a sharp rise from 1990, with overweight prevalence among this age group increasing from 8% to 20%.
- Furthermore, while only 2% of children and adolescents were obese in 1990, the figure rose to 8% by 2022, affecting 160 million young people globally.
- This trend is particularly alarming as it’s no longer confined to high-income countries, with low- and middle-income nations also experiencing significant increases in overweight and obesity rates.
(Source: World Health Organization (WHO))
Diet and Obesity
- Between the early 1970s and late 1990s, global food energy availability per person per day increased in all regions except Eastern Europe.
- In 1996, the United States led with 3,654 calories per person, rising to 3,754 by 2003.
- Europeans had 3,394 calories, while Asian and sub-Saharan African regions had fewer calories per person.
- Despite the availability of dietary guidelines, overeating, and poor dietary choices persisted.
- From 1971 to 2000, obesity rates in the United States surged from 14.5% to 30.9%.
- During this period, women consumed an average of 335 more calories per day, and men consumed 168 more calories, mainly from increased carbohydrate intake rather than fat.
(Source: United States Department of Agriculture (USDA), Statistics Canada)
Food and Nutrition Security Statistics
- In 2018, 14.3 million households in the U.S. faced food insecurity, indicating they lacked the financial means to access adequate food.
- This affected 37.2 million individuals, with 6.8% experiencing low food security and 4.3% facing very low food security.
- Additionally, 29.7 million people lived in food deserts, defined as low-income areas more than one mile away from a supermarket.
- In 2021, 118.5 million U.S. households, or 89.9%, were food secure, according to the USDA. However, 13.5 million households, or 10.2%, encountered food insecurity at some point during the year.
- Among them, 8.4 million households experienced low food security, and 5.1 million had inadequate food security.
- Regarding households with children under 18, 87.5% were food secure in 2021.
- However, food insecurity affected 12.5% of such households, with 6.3% experiencing insecurity among adults only and 6.2% facing insecurity among both adults and children.
(Source: United States Department of Agriculture (USDA))
Food Prices and Its Impact on Nutrition Statistics
Population Around the Globe That Cannot Afford a Healthy Diet
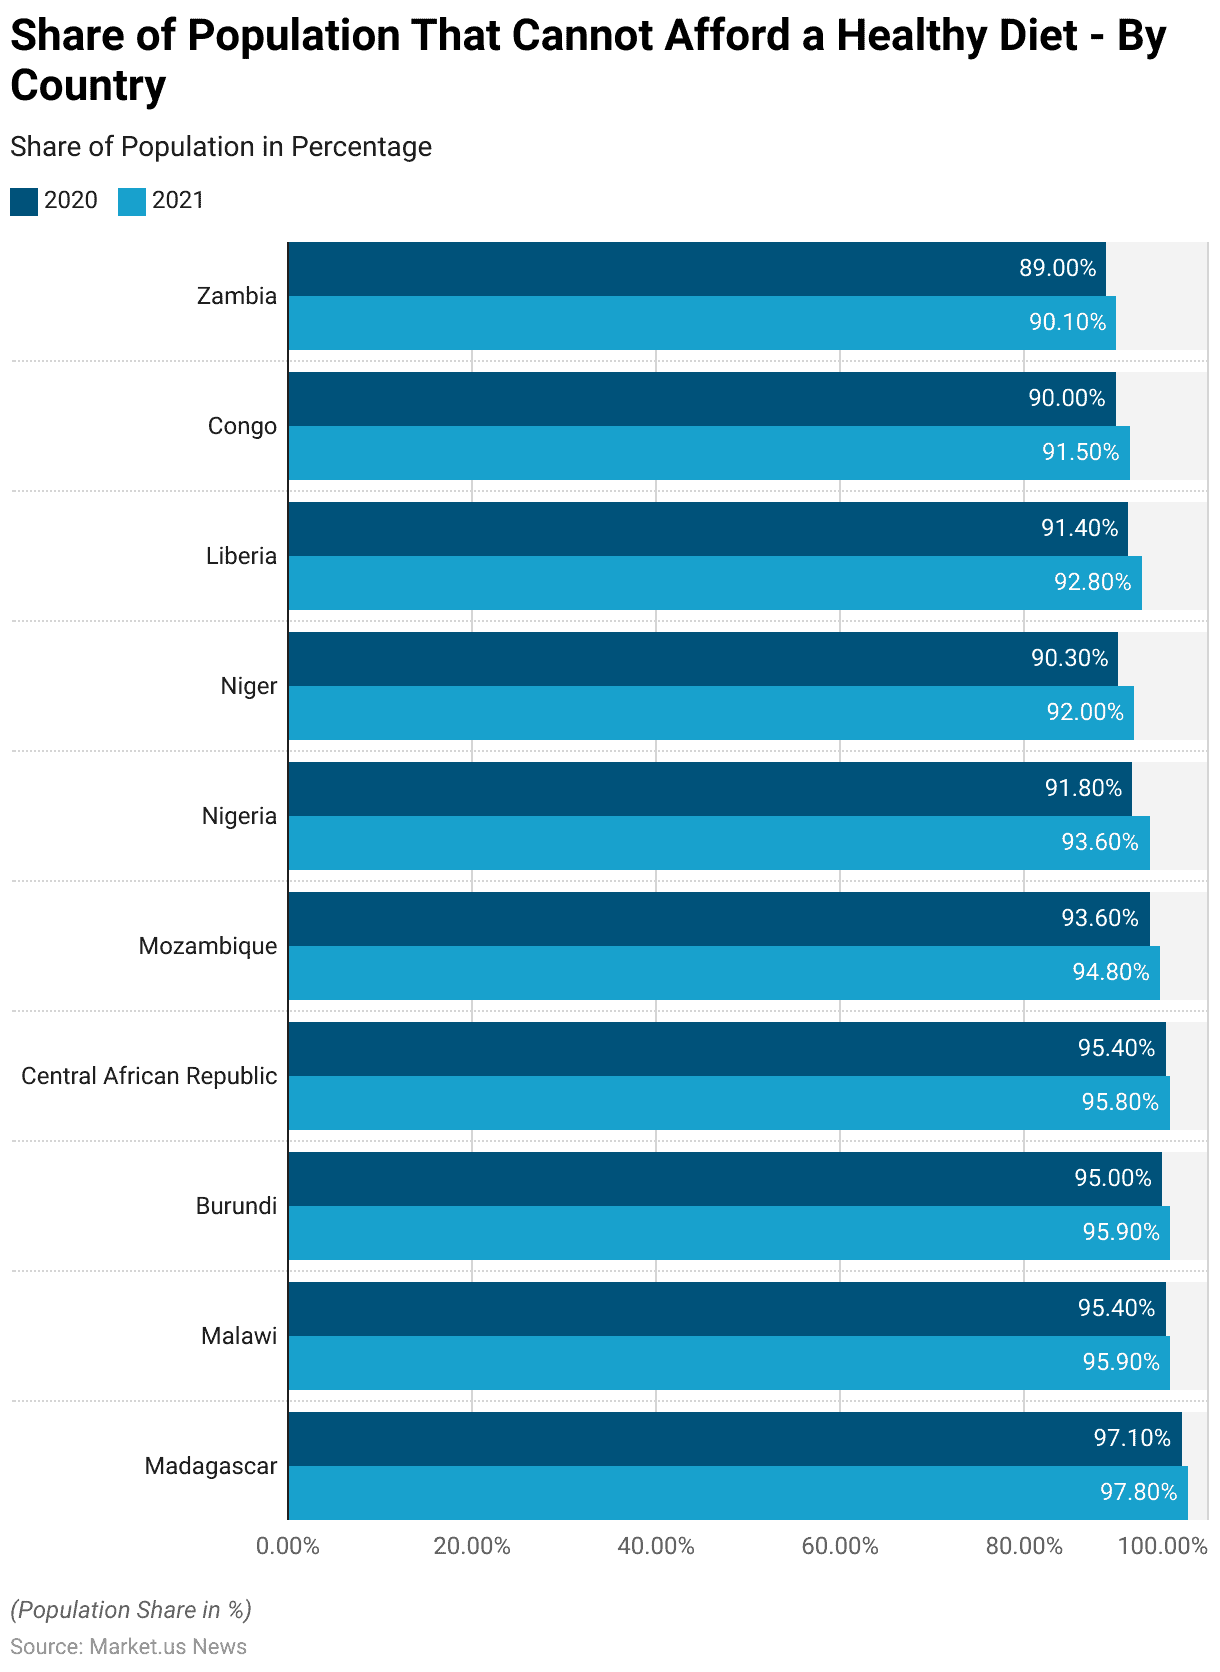
- In 2021, the share of the population that could not afford a healthy diet remained alarmingly high in several countries.
- Madagascar led with 97.8% of its population unable to afford a healthy diet, up from 97.1% in 2020.
- Similarly, Malawi and Burundi both saw increases, with rates rising to 95.9% from 95.4% and 95.0%, respectively.
- The Central African Republic also experienced a slight increase, with the rate rising from 95.4% to 95.8%.
- Mozambique followed, with 94.8% of its population unable to afford a healthy diet, up from 93.6%.
- In Nigeria, the rate increased from 91.8% to 93.6%, while Niger saw a rise from 90.3% to 92.0%.
- Liberia’s rate increased from 91.4% to 92.8%, and the Congo saw an increase from 90.0% to 91.5%.
- Zambia also experienced an increase, with the rate rising from 89.0% to 90.1%.
- These figures highlight the critical issue of food affordability in these countries.
(Source: Our World in Data)
Food and Nutrition Environmental Impact Statistics
Greenhouse Gas Emissions Per Kilogram of Food Product
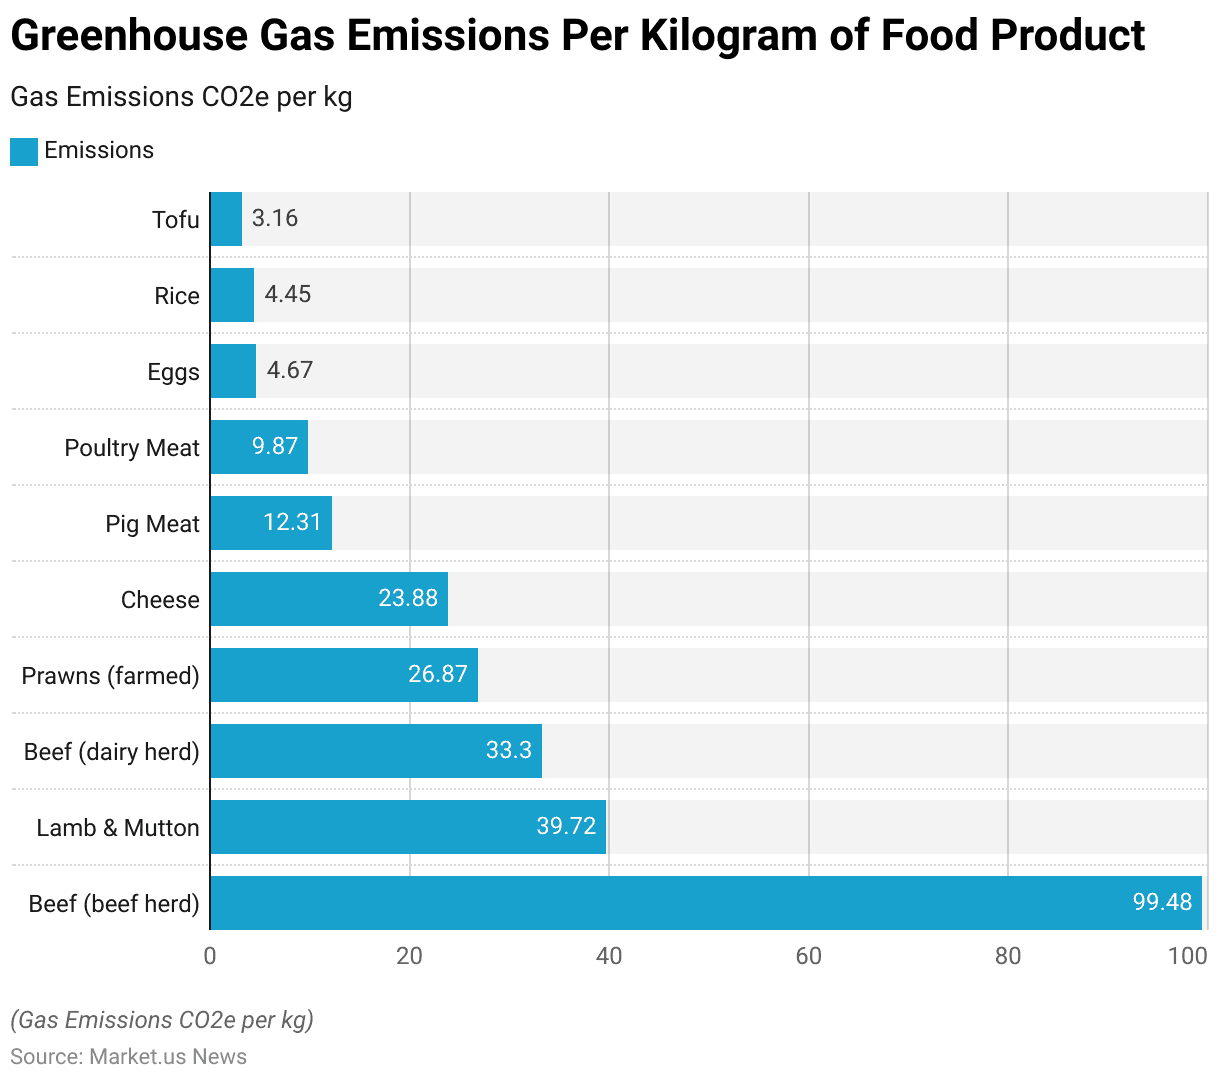
- Greenhouse gas emissions vary significantly across different food products.
- Beef from beef herds is the highest emitter, producing 99.48 kg of CO2 equivalent per kilogram.
- Lamb and mutton follow with 39.72 kg CO2e per kg, while beef from dairy herds emits 33.3 kg CO2e per kg.
- Farmed prawns produce 26.87 kg CO2e per kg, and cheese emits 23.88 kg CO2e per kg.
- Pig meat results in 12.31 kg CO2e per kg, and poultry meat emits 9.87 kg CO2e per kg.
- Among lower-emission foods, eggs generate 4.67 kg CO2e per kg, rice produces 4.45 kg CO2e per kg, and tofu results in 3.16 kg CO2e per kg.
- These figures illustrate the wide range of environmental impacts associated with different types of food.
(Source: Our World in Data)
Latest Food and Nutrition Trends and Statistics
- 52% of survey participants consider the ingredient list when purchasing food and beverages.
- Half of Generation Z and 65% of Millennials believe their food choices have an impact on the environment.
- Nearly four in ten Americans, or 39%, take environmental sustainability into account when buying food and beverages.
- Generation Z is unique in asserting that foods, beverages, and nutrients contribute to their emotional and mental well-being.
- About 30% of Americans have adjusted their diet and nutrition habits to manage stress.
- 73% of Americans snack daily, primarily due to hunger or thirst (34%) or as a treat (25%).
- Individuals experiencing stress are more likely to snack three or more times daily.
- 37% of Americans seek energy and reduce fatigue from the foods, nutrients, and beverages they consume.
- Among younger generations, 31% of Generation Z and 30% of Millennials prefer low or no-calorie sweeteners compared to older generations.
- 73% of Americans are attempting to limit or avoid sugar intake.
(Source: Food Insight)
Recent Developments
Acquisitions:
- Nestlé’s Acquisition of Orgain: In February 2022, Nestlé Health Science acquired a majority stake in Orgain, a leader in plant-based nutrition. This acquisition expands Nestlé’s portfolio in the health and nutrition segment, allowing them to meet growing consumer demand for organic and plant-based nutritional products.
- Post Holdings’ Acquisition of Pet Food Brands: In April 2023, Post Holdings acquired several pet food brands from The J.M. Smucker Co., including Rachael Ray Nutrish and Nature’s Recipe, for $235 million. This acquisition enhances Post Holdings’ offerings in the natural and organic pet food market.
New Product Launches:
- Dole’s New Product Lines: Dole Packaged Foods launched several new products in 2023, including Dole Good Crunch™, sustainably produced dehydrated fruit snacks, and Dole Digestive Bliss™ Fruit Juice Drink, a beverage designed to support gut health. These innovations align with consumer demand for healthier and functional food options.
- Nestlé’s New HMO Product in China: Nestlé introduced its first product containing human milk oligosaccharides (HMOs) in China in November 2023. This growing-up milk solution is part of Nestlé’s effort to advance early-life nutrition and reinforce its leadership in nutrition science.
Funding:
- Dole’s Investment in Healthier Food Options: Dole has invested significantly in developing new healthy food products. This includes launching probiotic sodas and fruit-powered vitamin chews under a new brand, emphasizing their commitment to nutrition and wellness.
- FDA’s Funding Request for Food Safety and Nutrition: The FDA requested $7.2 billion in funding to enhance food safety and nutrition, advance medical product safety, and support supply chain resiliency. This funding will help the agency implement its New Era of Smarter Food Safety initiative.
Market Growth:
- Expansion of the Global Nutrition Market: The global food and nutrition market is expected to continue its growth trajectory, driven by increasing consumer awareness of health and wellness. The market is projected to grow significantly, with a focus on organic, plant-based, and functional foods leading the charge.
Innovation in Food and Nutrition Statistics:
- Functional Beverages and Supplements: Companies are innovating in the functional beverages and supplements category to meet consumer demand for products that offer health benefits beyond basic nutrition. This includes drinks with reduced sugar content and supplements designed to support mental wellness and digestive health.
- Advancements in Sustainable Packaging: Dole and other companies are working towards eliminating fossil-based plastic packaging by 2025, aiming for more sustainable practices in product packaging to reduce environmental impact.
Conclusion
Food and Nutrition Statistics – The analysis of food and nutrition data reveals significant disparities in dietary patterns, food affordability, and greenhouse gas emissions.
In 2022, millions of adults and children worldwide were affected by being underweight, overweight, and obese, with stunting remaining a critical issue in low- and middle-income countries.
Food affordability remains a pressing concern, particularly in Sub-Saharan Africa and South Asia. Additionally, the environmental impact of food production varies greatly, with animal-based products like beef and lamb having the highest emissions.
Addressing these challenges requires improving food security, promoting sustainable agriculture, and ensuring access to nutritious foods to achieve better health outcomes and sustainability.
FAQs
The main global nutritional challenges include undernutrition, overweight, and obesity, with significant disparities across different regions. Stunting in children under five remains a critical issue, particularly in low- and middle-income countries.
Food affordability is a major concern, especially in regions like Sub-Saharan Africa and South Asia, where a significant portion of the population cannot afford a healthy diet. This leads to poor nutrition and associated health problems.
The environmental impact of food products varies widely. Animal-based products, particularly beef and lamb, have the highest greenhouse gas emissions, while plant-based foods like tofu have much lower environmental footprints.
In 2022, approximately 390 million adults were underweight, while 2.5 billion were overweight, including 890 million living with obesity. Among children and adolescents aged 5-19, 390 million were overweight, with 160 million living with obesity.
Stunting in children is primarily caused by chronic undernutrition, often linked to food insecurity, poor maternal health, inadequate infant and young child feeding practices, and repeated infections.
Discuss your needs with our analyst
Please share your requirements with more details so our analyst can check if they can solve your problem(s)