

Table of Contents
- Introduction
- Editor’s Choice
- Bicycle Market Statistics
- Global Bicycle Sales Statistics
- Countries with The Highest Bicycle Usage Statistics
- Bicycles Exports by Country Statistics
- Bicycles Imports by Country Statistics
- Bicycle Brand Representation in Bike Shops Statistics
- Bicyclist’ Demographic Characteristics
- General Bicycle Use Characteristics
- Bicycling and Not Bicycling Reasons
- Frequency of Bicycle Use for Transportation in Various Countries Statistics
- Public Bicycle Statistics
- Effects on Bicycling During and After the COVID-19 Pandemic
- Bicycle Market Trends
- Recent Developments
- Conclusion
- FAQs
Introduction
Bicycle Statistics: The bicycle industry, comprising conventional and electric models, is experiencing steady growth driven by health consciousness, environmental concerns, and urbanization.
Technological advancements, such as smart features and lightweight materials, are enhancing performance and safety.
As cities invest in bike infrastructure and consumers seek sustainable transportation, bicycles are becoming integral to urban mobility.
Challenges include regulatory hurdles and supply chain disruptions, but opportunities abound in emerging markets and innovative product development.
By embracing innovation and market diversification, industry stakeholders can capitalize on the growing demand for bicycles as a sustainable and efficient mode of transportation and recreation.
Editor’s Choice
- The global bicycle market revenue is projected to reach USD 70.00 billion by 2029.
- China leads the market with a revenue of USD 12,370 million.
- Bicycle unit sales are expected to reach 138.30 million by 2029.
- In 2019, several countries stood out for their high rates of bicycle ownership among their populations. The Netherlands led the list with an impressive 99% of people owning a bicycle.
- Between 2021 and 2022, Germany led the fastest-growing importers of bicycles, which saw an increase of USD 253 million.
- The purposes for bicycling among respondents vary widely. Exercising is the most common reason, with 94% of respondents cycling for this purpose (excluding stationary exercise bicycles).
- A 2022 survey by the Allgemeiner Deutscher Fahrrad-Club (ADFC) in Germany found that 96% of respondents owned bicycles.
Bicycle Market Statistics
Global Bicycle Market Size Statistics
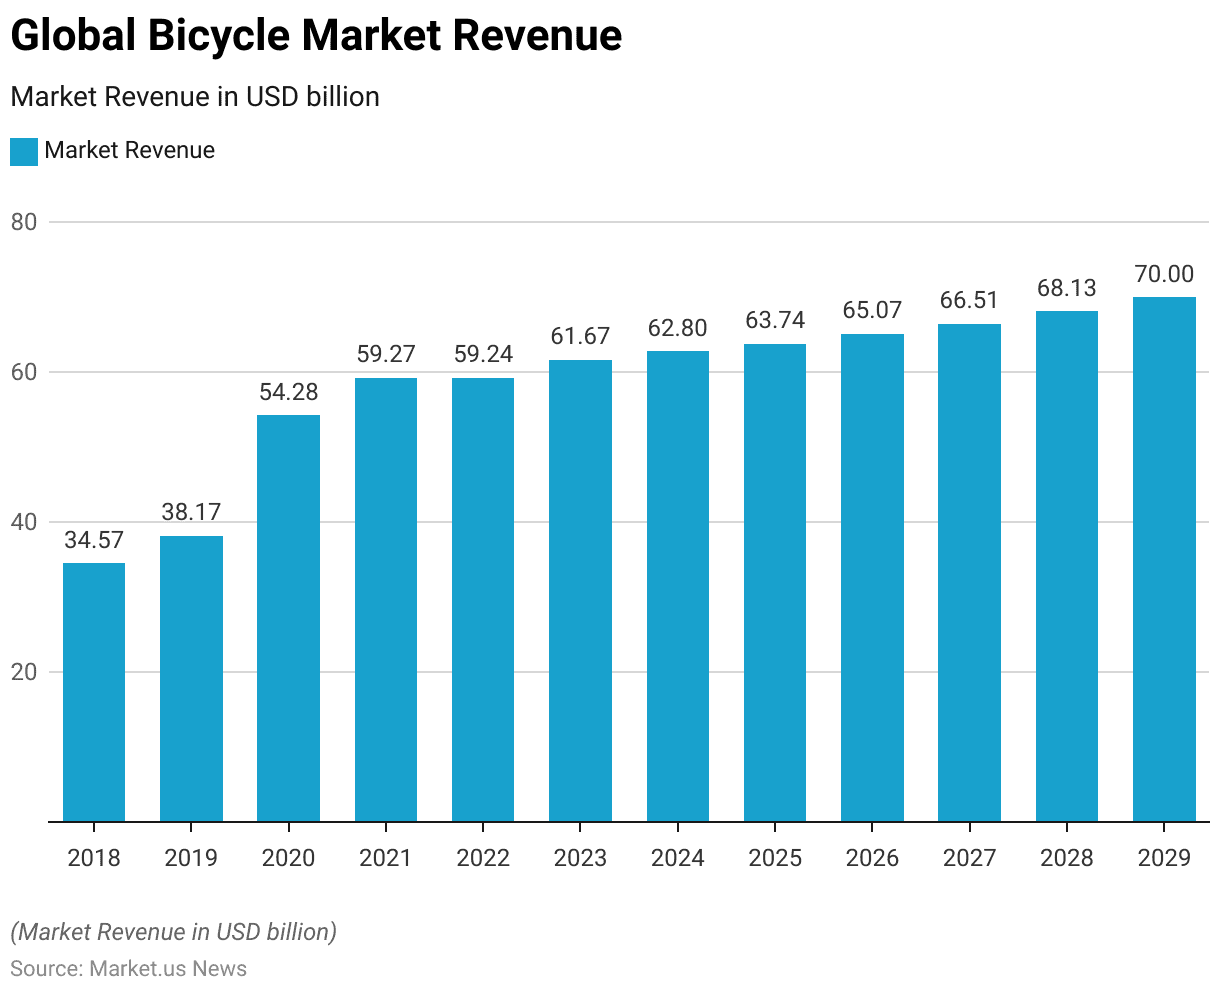
- The global bicycle market has experienced notable fluctuations and growth over the past decade at a CAGR of 2.1%.
- In 2018, the market revenue was USD 34.57 billion, increasing to USD 38.17 billion in 2019.
- A substantial surge occurred in 2020, with revenues reaching USD 54.28 billion, followed by a slight rise to USD 59.27 billion in 2021.
- The market stabilized somewhat in 2022 at USD 59.24 billion but resumed growth in subsequent years, reaching USD 61.67 billion in 2023 and USD 62.80 billion in 2024.
- Projections indicate continued growth, with the market expected to hit USD 63.74 billion in 2025, USD 65.07 billion in 2026, and USD 66.51 billion in 2027.
- Further growth is anticipated, with revenues projected to reach USD 68.13 billion in 2028 and USD 70.00 billion by 2029.
- This trend underscores the sustained demand for bicycles worldwide.
(Source: Statista)
Global Bicycle Market Revenue Change Statistics
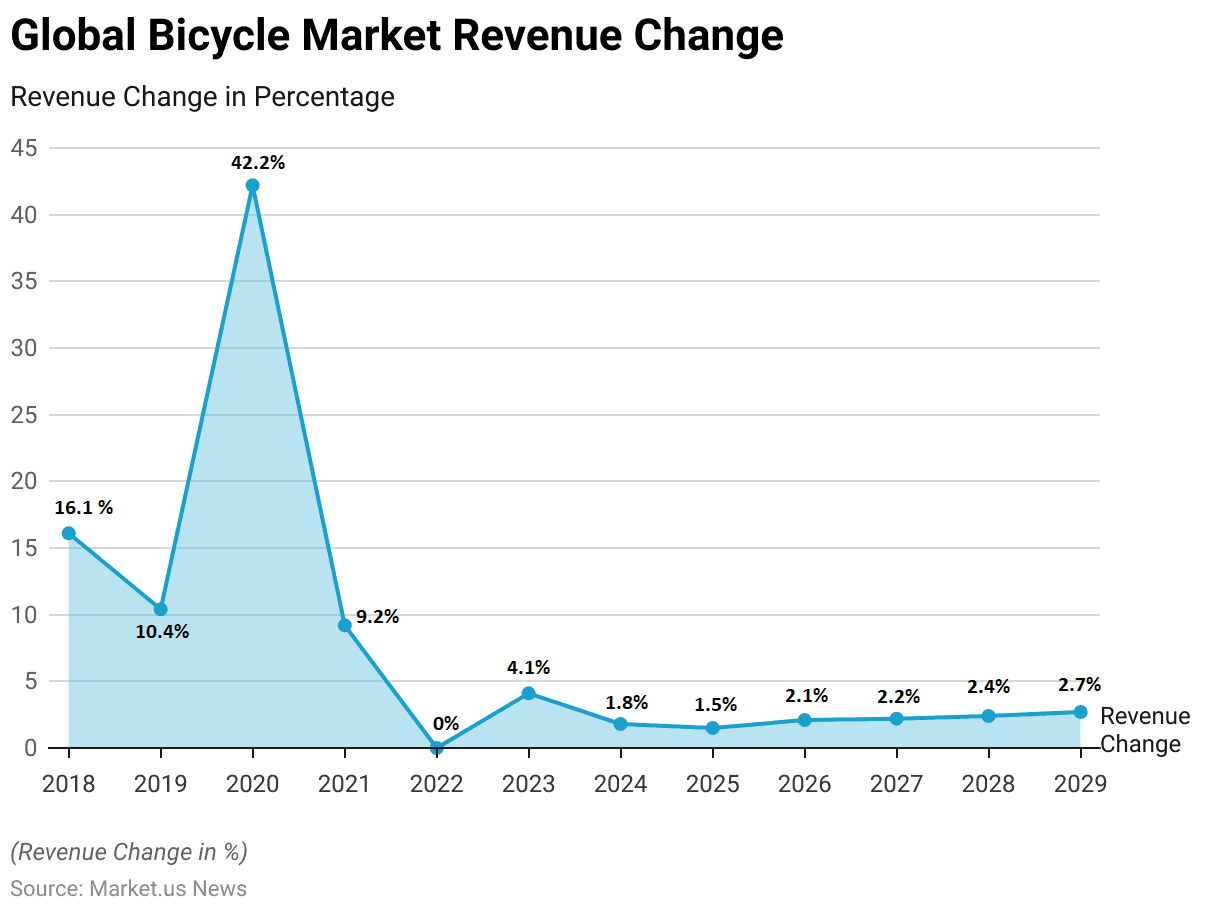
- The global bicycle market has exhibited varying rates of revenue change over the years.
- In 2018, the market saw a substantial increase of 16.1%, followed by a growth of 10.4% in 2019.
- The year 2020 experienced a remarkable surge of 42.2%, reflecting a significant rise in demand.
- However, the growth rate slowed to 9.2% in 2021 and remained stagnant at 0.0% in 2022.
- In 2023, the market resumed growth with a 4.1% increase, followed by a modest rise of 1.8% in 2024.
- The growth rates for the subsequent years are projected to be 1.5% in 2025, 2.1% in 2026, and 2.2% in 2027.
- Further gradual increases are expected, with growth rates of 2.4% in 2028 and 2.7% in 2029.
- This pattern indicates a stabilization of the market with steady, incremental growth.
(Source: Statista)
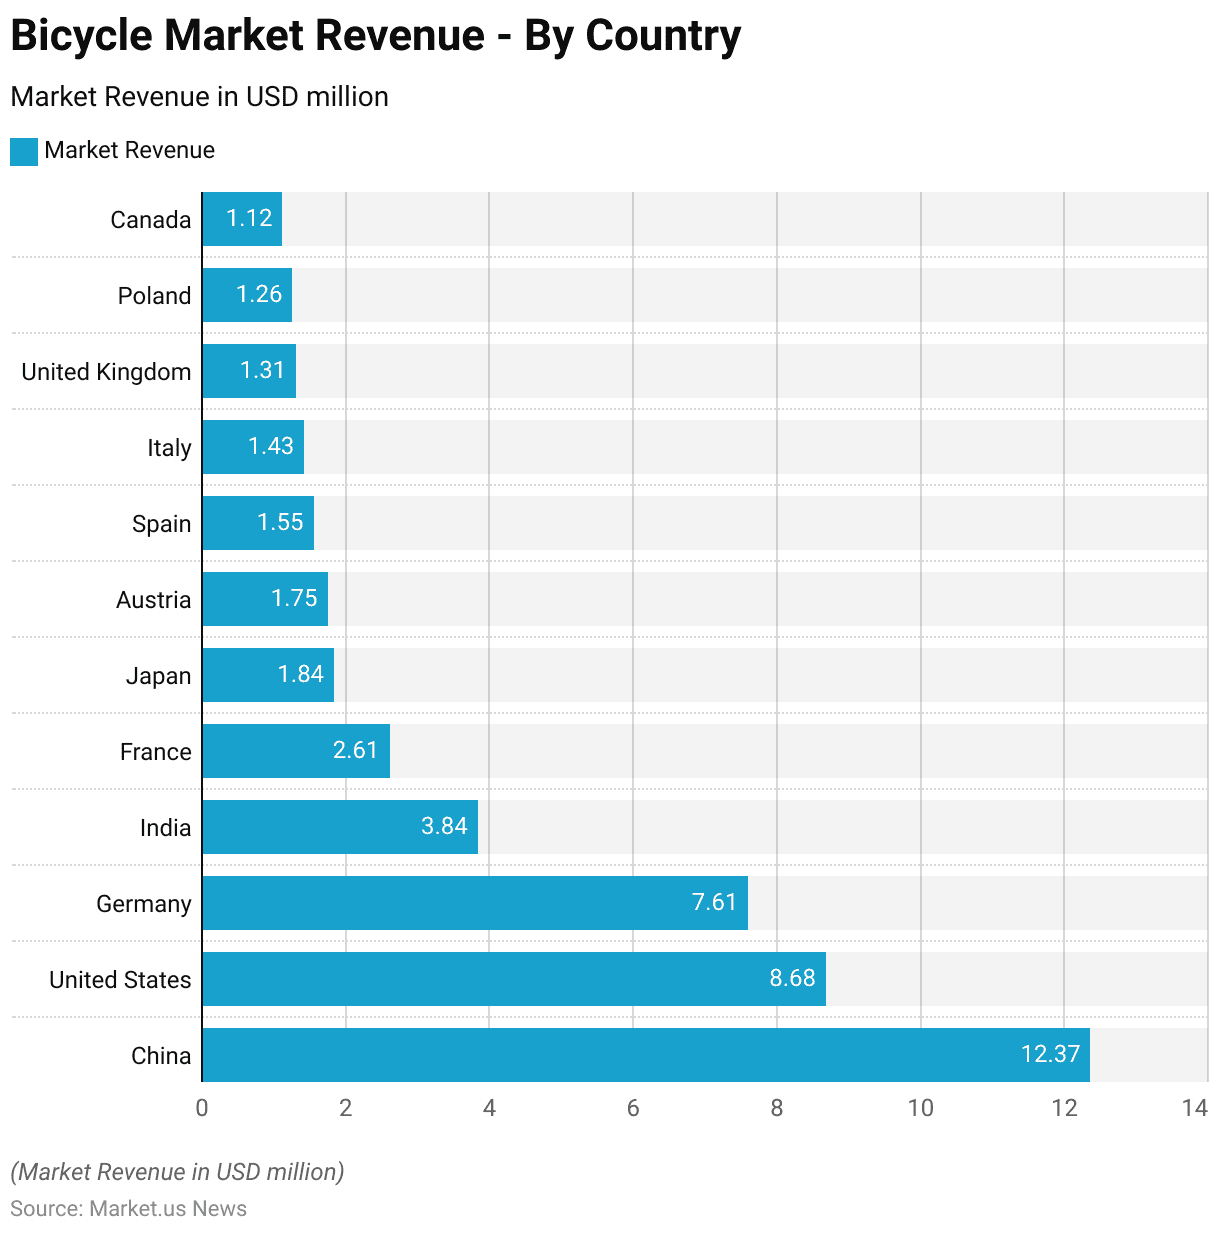
Regional Analysis of the Global Bicycle Market Statistics
- Significant revenue contributions from various countries characterize the global bicycle market.
- China leads the market with a revenue of USD 12,370 million, followed by the United States at USD 8,684 million and Germany at USD 7,607 million.
- India contributes USD 3,840 million, while France and Japan generate USD 2,611 million and USD 1,840 million, respectively.
- Austria, Spain, and Italy also have notable revenues of USD 1,749 million, USD 1,554 million, and USD 1,426 million, respectively.
- The United Kingdom adds USD 1,314 million to the market, with Poland and Canada contributing USD 1,262 million and USD 1,121 million, respectively.
- These figures highlight the diverse geographic distribution of the bicycle market’s revenue.
(Source: Statista)
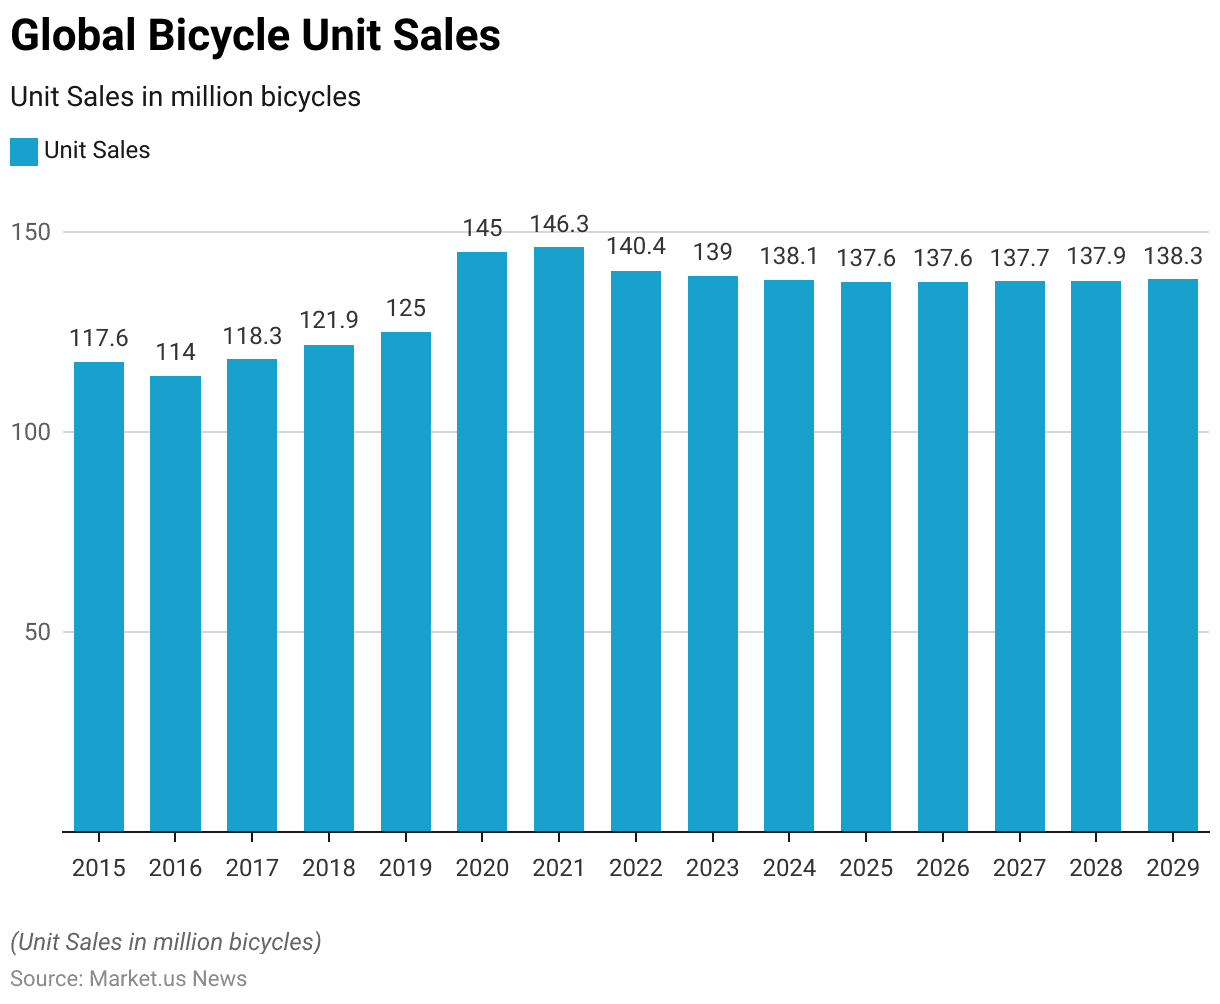
Global Bicycle Sales Statistics
- The global bicycle market has shown dynamic trends in unit sales over the past decade.
- In 2015, unit sales reached 117.60 million bicycles, slightly decreasing to 114.00 million in 2016.
- The market rebounded in 2017 with sales of 118.30 million and continued to grow, reaching 121.90 million in 2018 and 125.00 million in 2019.
- A significant surge occurred in 2020, with unit sales climbing to 145.00 million, followed by a slight increase to 146.30 million in 2021.
- However, the market experienced a decline in 2022, with sales dropping to 140.40 million and further decreasing to 139.00 million in 2023.
- The downward trend persisted, with sales of 138.10 million in 2024 and 137.60 million in both 2025 and 2026.
- A marginal increase is projected for the following years, with unit sales expected to reach 137.70 million in 2027, 137.90 million in 2028, and 138.30 million by 2029.
- This data reflects fluctuations in the market with a general trend towards stabilization in the coming years.
(Source: Statista)
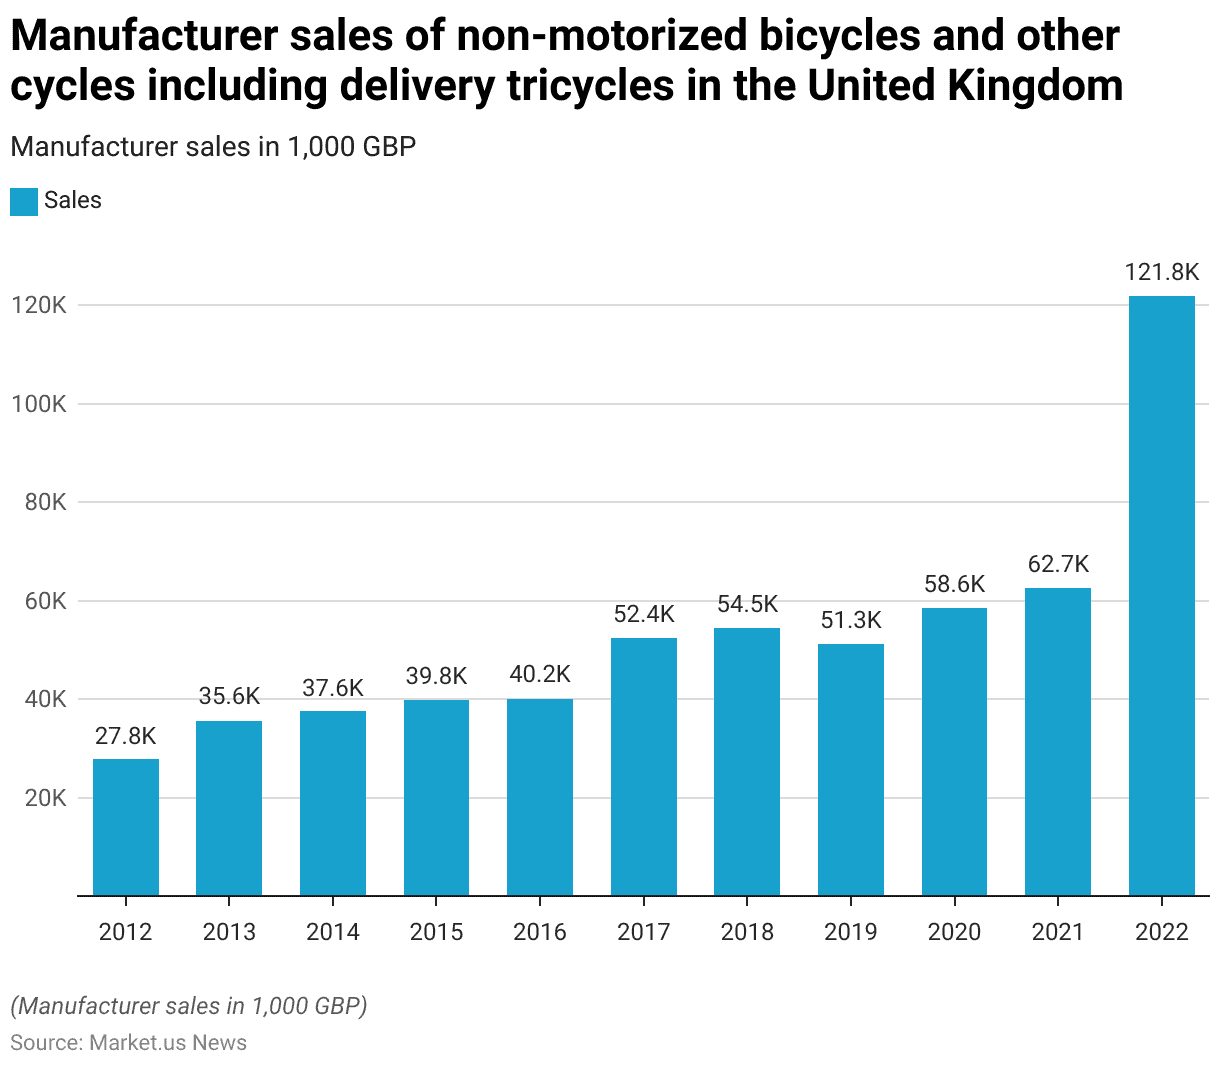
Trends in Manufacturer Sales of Non-Motorized Bicycles and Other Cycles Including Delivery Tricycles
- The manufacturer sales of non-motorized bicycles and other cycles, including delivery tricycles, in the United Kingdom have exhibited notable growth over the past decade.
- In 2012, sales amounted to 27,847 thousand GBP, rising to 35,636 thousand GBP in 2013 and 37,596 thousand GBP in 2014.
- The market continued to grow steadily, reaching 39,849 thousand GBP in 2015 and 40,157 thousand GBP in 2016.
- A significant increase occurred in 2017, with sales climbing to 52,350 thousand GBP, followed by 54,495 thousand GBP in 2018.
- Despite a slight dip to 51,253 thousand GBP in 2019, the market rebounded strongly in 2020 with sales of 58,630 thousand GBP.
- This upward trend continued in 2021, with sales reaching 62,659 thousand GBP.
- The most dramatic surge was observed in 2022, with manufacturer sales skyrocketing to 121,772 thousand GBP.
- This data indicates a robust and accelerating demand for non-motorized bicycles and delivery tricycles in the UK market.
(Source: Statista)
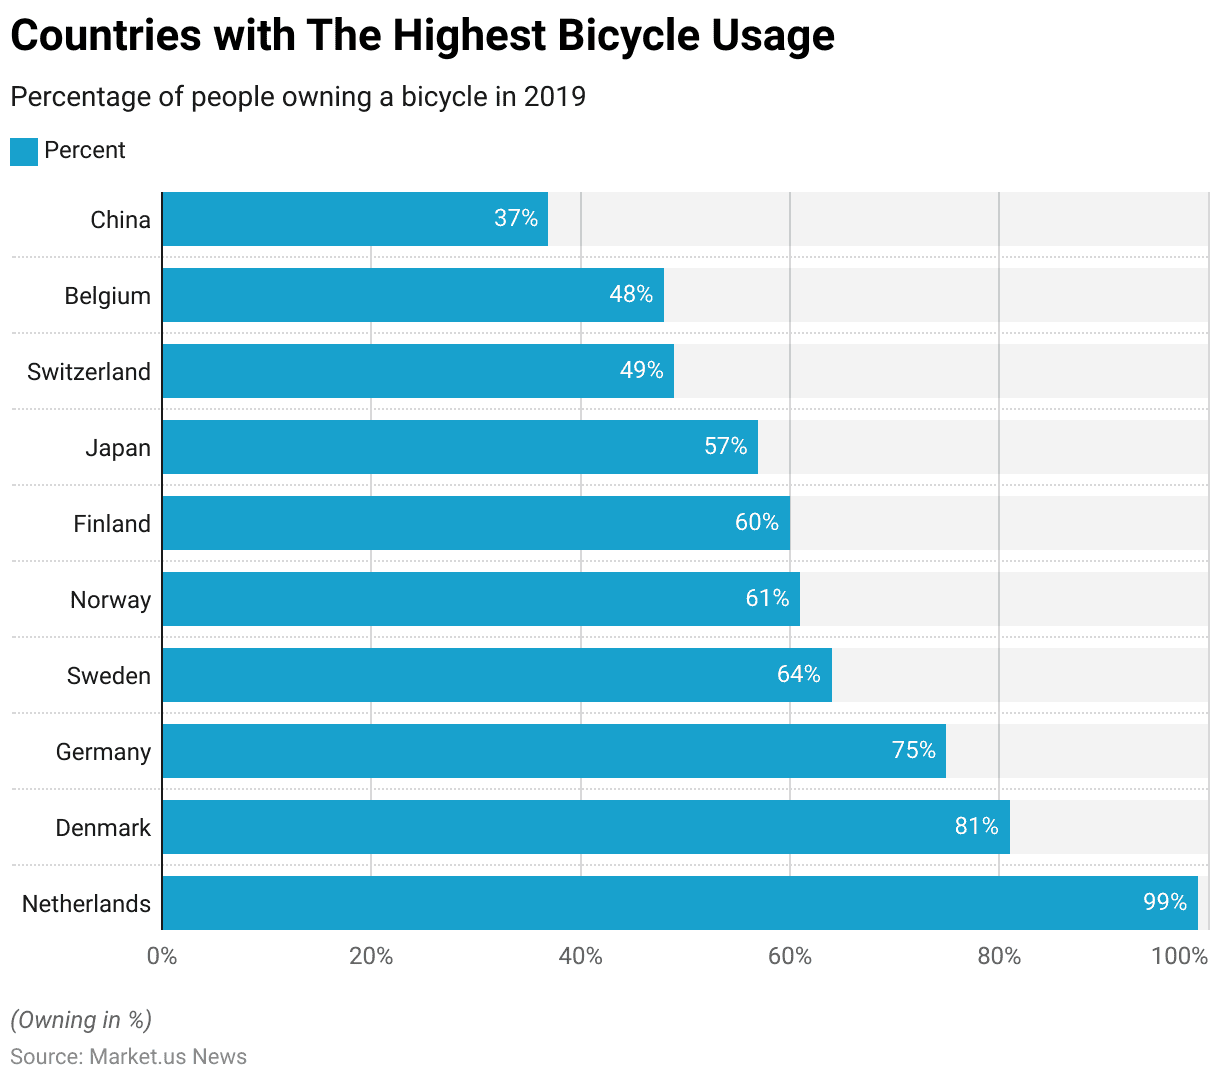
Countries with The Highest Bicycle Usage Statistics
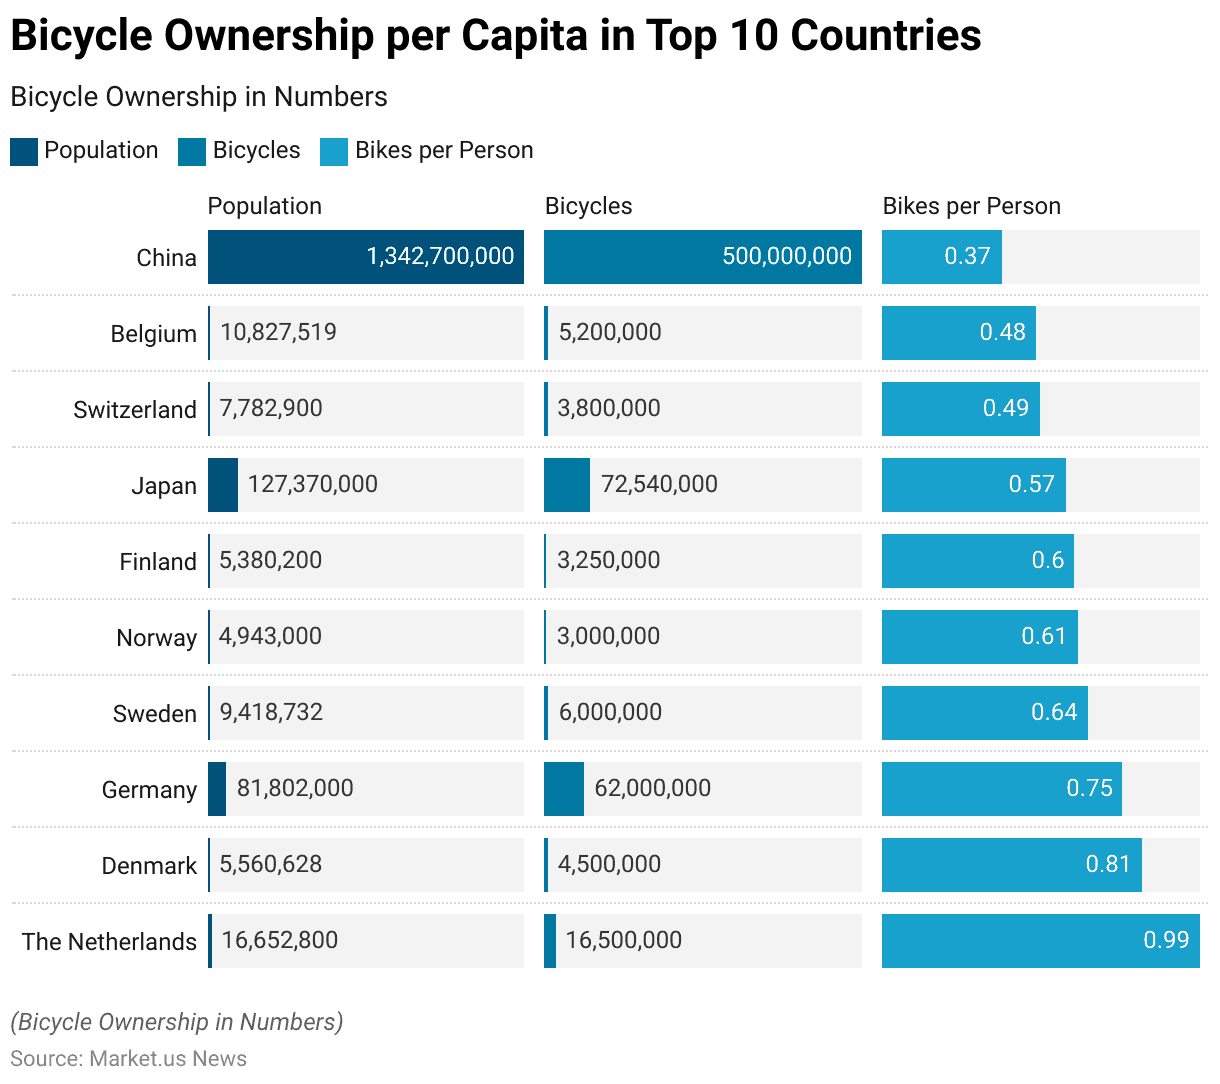
- In 2019, several countries stood out for their high rates of bicycle ownership among their populations.
- The Netherlands led the list with an impressive 99% of people owning a bicycle, followed by Denmark at 81% and Germany at 75%.
- Sweden and Norway also had substantial ownership rates of 64% and 61%, respectively.
- In Finland, 60% of the population owned bicycles, while Japan reported a 57% ownership rate.
- Switzerland and Belgium had 49% and 48% of their populations owning bicycles, respectively.
- China, despite its vast population, had a relatively lower but still significant ownership rate of 37%.
- These figures underscore the prevalence and cultural importance of bicycles in these countries.
(Source: Ranking Royals)
Bicycle Ownership per Capita in Countries with the Highest Number of Bicycles Statistics
- In 2019, the countries with the highest bicycle ownership per capita were led by the Netherlands, where 16,652,800 people owned 16,500,000 bicycles, resulting in a ratio of 0.99 bicycles per person.
- Denmark followed, with 4,500,000 bicycles among 5,560,628 people, giving a ratio of 0.81 bicycles per person.
- Germany had 62,000,000 bicycles for its 81,802,000 inhabitants, resulting in a 0.75 ratio.
- Sweden reported 6,000,000 bicycles for its 9,418,732 population, achieving a ratio of 0.64 bicycles per person.
- Norway’s 4,943,000 residents owned 3,000,000 bicycles, equating to a 0.61 ratio.
- Finland had a ratio of 0.60, with 3,250,000 bicycles for its 5,380,200 people.
- Japan had 72,540,000 bicycles for its 127,370,000 population, resulting in a ratio of 0.57.
- Switzerland’s 7,782,900 inhabitants owned 3,800,000 bicycles, giving a ratio of 0.49.
- Belgium had a ratio of 0.48, with 5,200,000 bicycles for its 10,827,519 population.
- Lastly, China had over 500,000,000 bicycles for its 1,342,700,000 people, resulting in a ratio of 0.37 bicycles per person.
(Source: Ground Report)
Bicycles Exports by Country Statistics
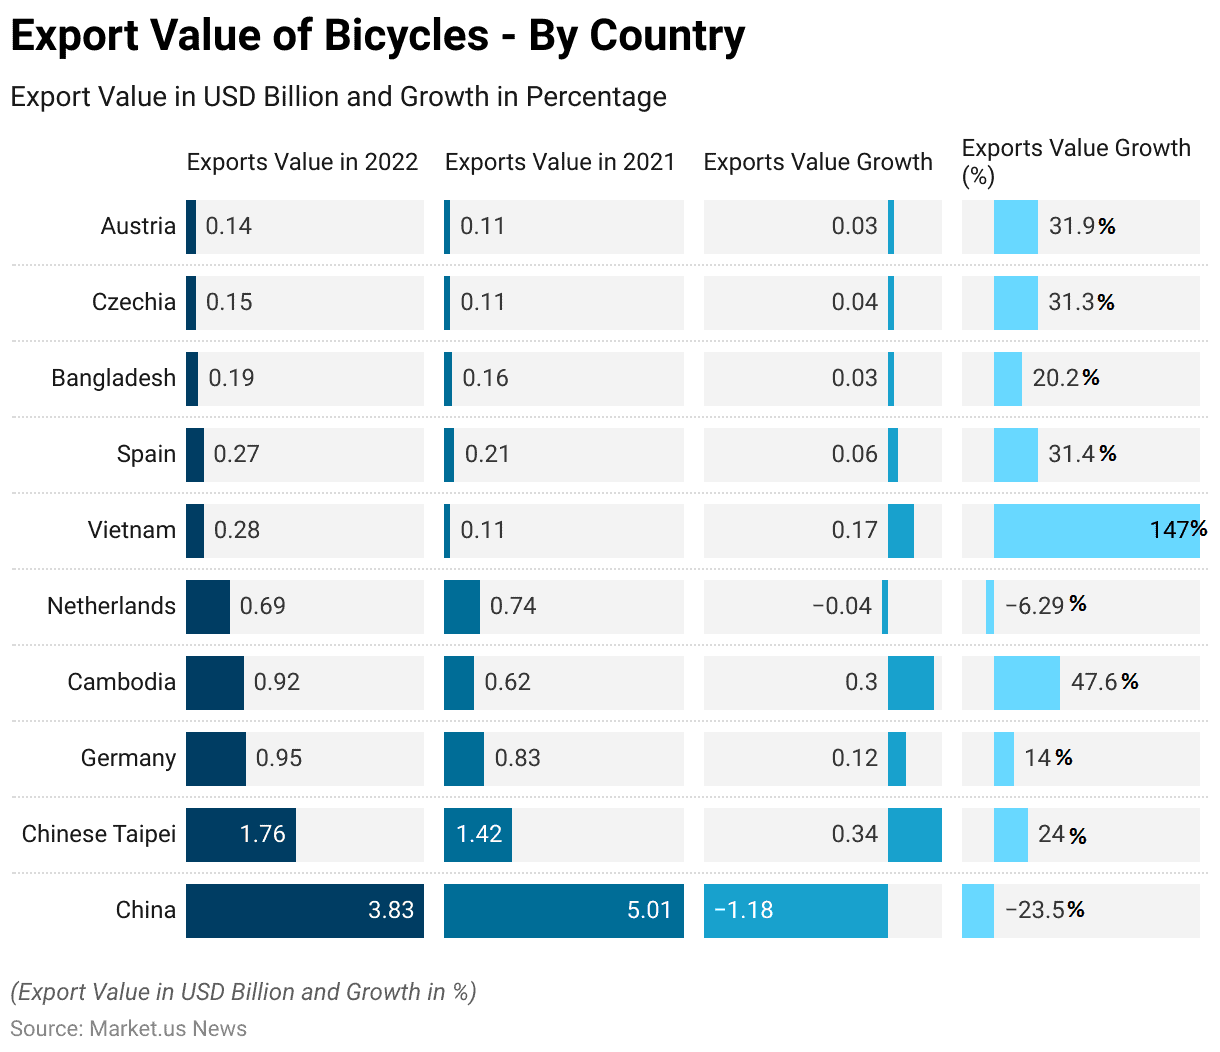
- In 2022, China led the export market with a value of USD 3.83 billion, although it experienced a decline from USD 5.01 billion in 2021, marking a negative growth of USD 1.18 billion or –23.50%.
- Chinese Taipei followed with an export value of USD 1.76 billion, up from USD 1.42 billion in 2021, showing a growth of USD 0.34 billion or 24%.
- Germany’s exports were valued at USD 0.95 billion, an increase from USD 0.834 billion in 2021, reflecting a growth of USD 0.116 billion or 14%.
- Cambodia reported exports worth USD 0.915 billion, up from USD 0.62 billion, achieving a growth of USD 0.295 billion or 47.60%.
- The Netherlands had exports valued at USD 0.69 billion, slightly down from USD 0.736 billion in 2021, resulting in a decrease of USD 0.04 billion or –6.29%.
- Vietnam’s exports grew significantly to USD 0.276 billion from USD 0.112 billion, showing a remarkable growth of USD 0.165 billion or 147%.
- Spain recorded exports of USD 0.271 billion, an increase from USD 0.207 billion, with a growth of USD 0.0648 billion or 31.40%.
- Bangladesh’s exports were valued at USD 0.189 billion, up from USD 0.157 billion, showing a growth of USD 0.031 billion or 20.20%.
- Czechia’s exports increased to USD 0.149 billion from USD 0.113 billion, reflecting a growth of USD 0.0355 billion or 31.30%.
- Austria had exports worth USD 0.142 billion, up from USD 0.108 billion, achieving a growth of USD 0.0344 billion or 31.90%.
(Source: OEC)
Bicycles Imports by Country Statistics
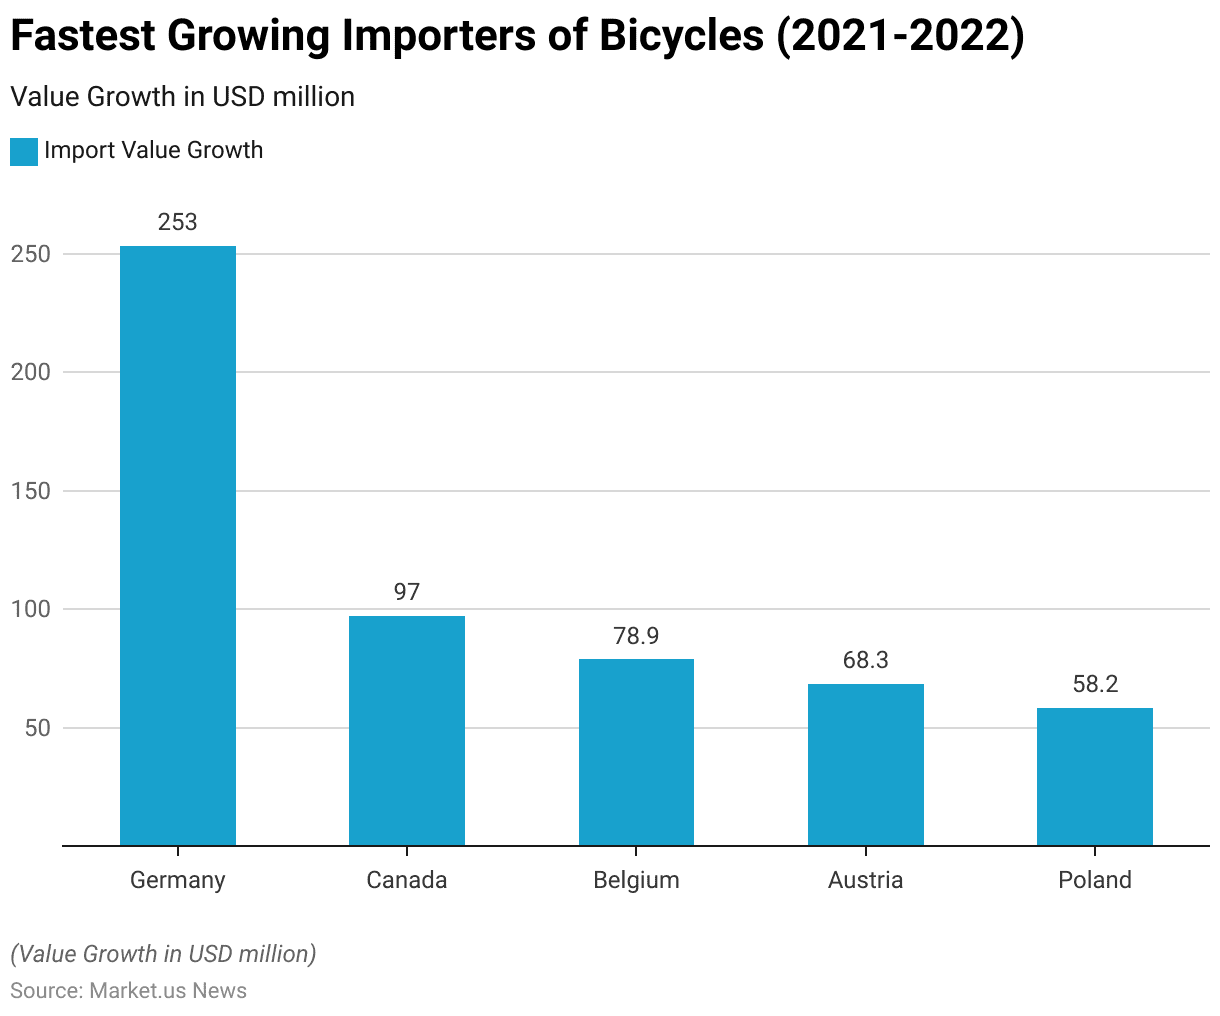
- Between 2021 and 2022, Germany led the fastest-growing importers of bicycles, which saw an increase of USD 253 million.
- Canada followed with a growth of USD 97 million in bicycle imports.
- Belgium experienced a rise of USD 78.9 million, while Austria saw an increase of USD 68.3 million.
- Poland also reported significant growth, with bicycle imports increasing by USD 58.2 million.
(Source: OEC)
Bicycle Brand Representation in Bike Shops Statistics
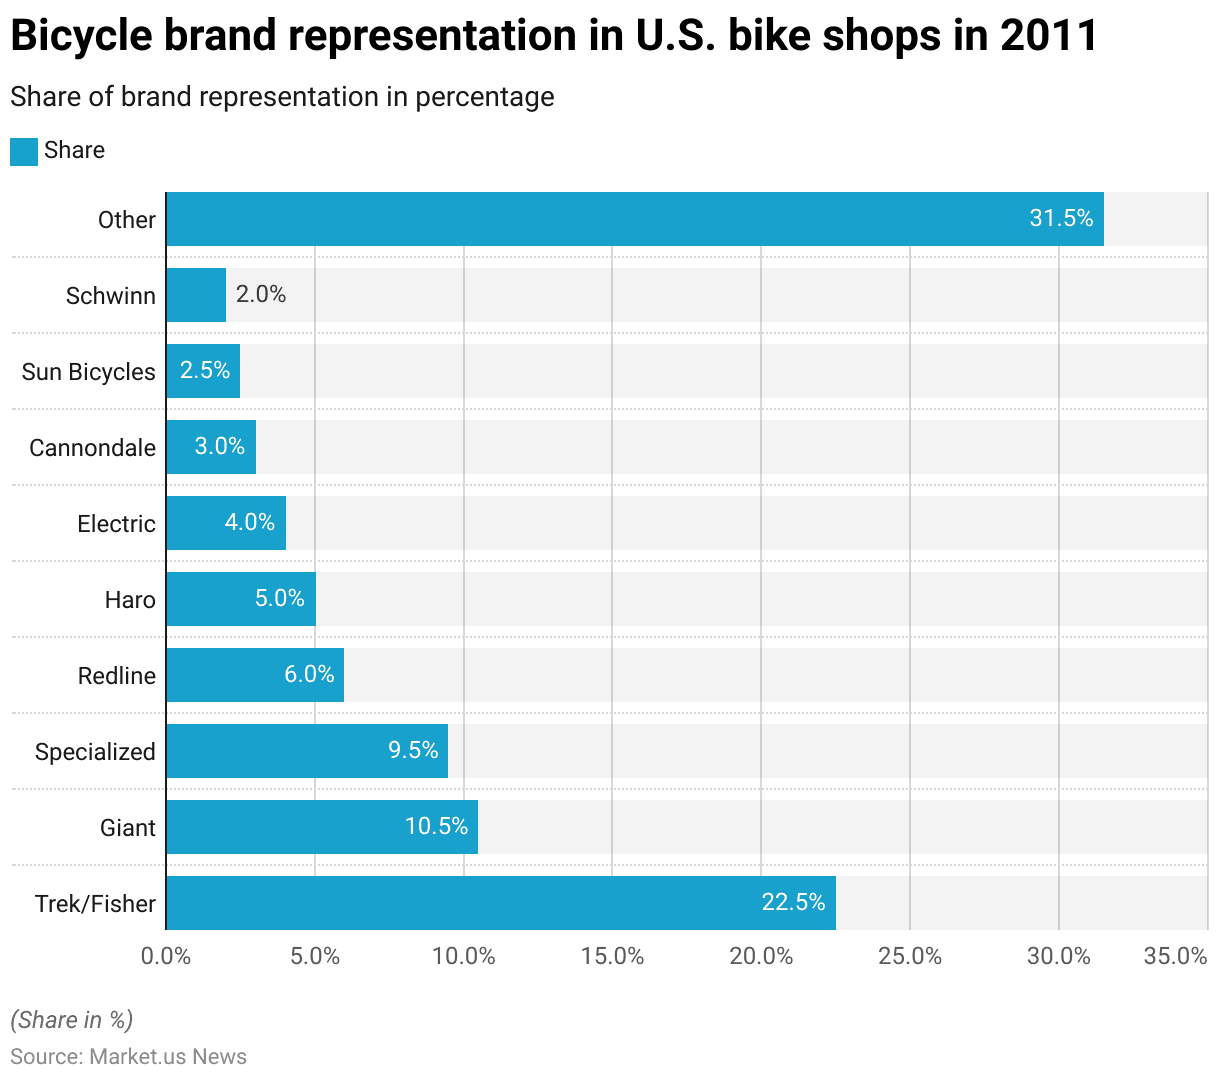
- In 2011, the representation of bicycle brands in U.S. bike shops was led by Trek/Fisher, which held a 22.5% share.
- Giant followed with a 10.5% share, while Specialized accounted for 9.5% of the market.
- Redline and Haro had shares of 6% and 5%, respectively.
- Electric bicycles comprised 4% of the market, and Cannondale had a 3% share.
- Sun Bicycles and Schwinn represented 2.5% and 2% of the market, respectively.
- Various other brands collectively made up the remaining 31.5% of brand representation in U.S. bike shops.
(Source: Statista)
Bicyclist’ Demographic Characteristics
Age
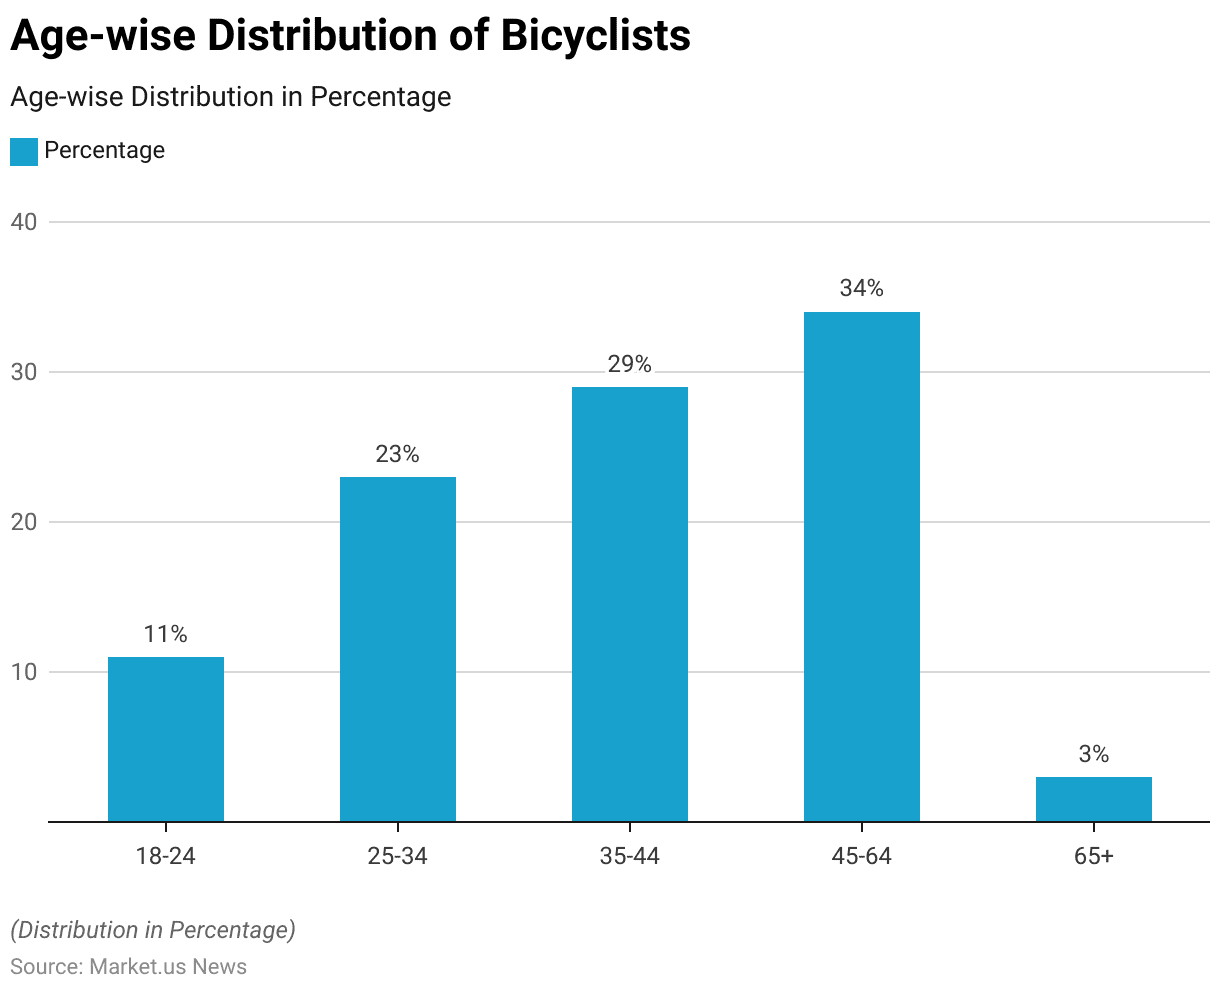
- The demographic characteristics of bicyclists, categorized by age, reveal a diverse age distribution.
- The age group of 45-64 years represents the largest segment, comprising 34% of bicyclists.
- This is followed by the 35-44 age group, which accounts for 29%.
- The 25-34 age group makes up 23% of the bicyclist population, while the 18-24 age group constitutes 11%.
- The smallest segment is the 65+ age group, representing just 3% of bicyclists.
(Source: The University of Texas at Austin)
Gender
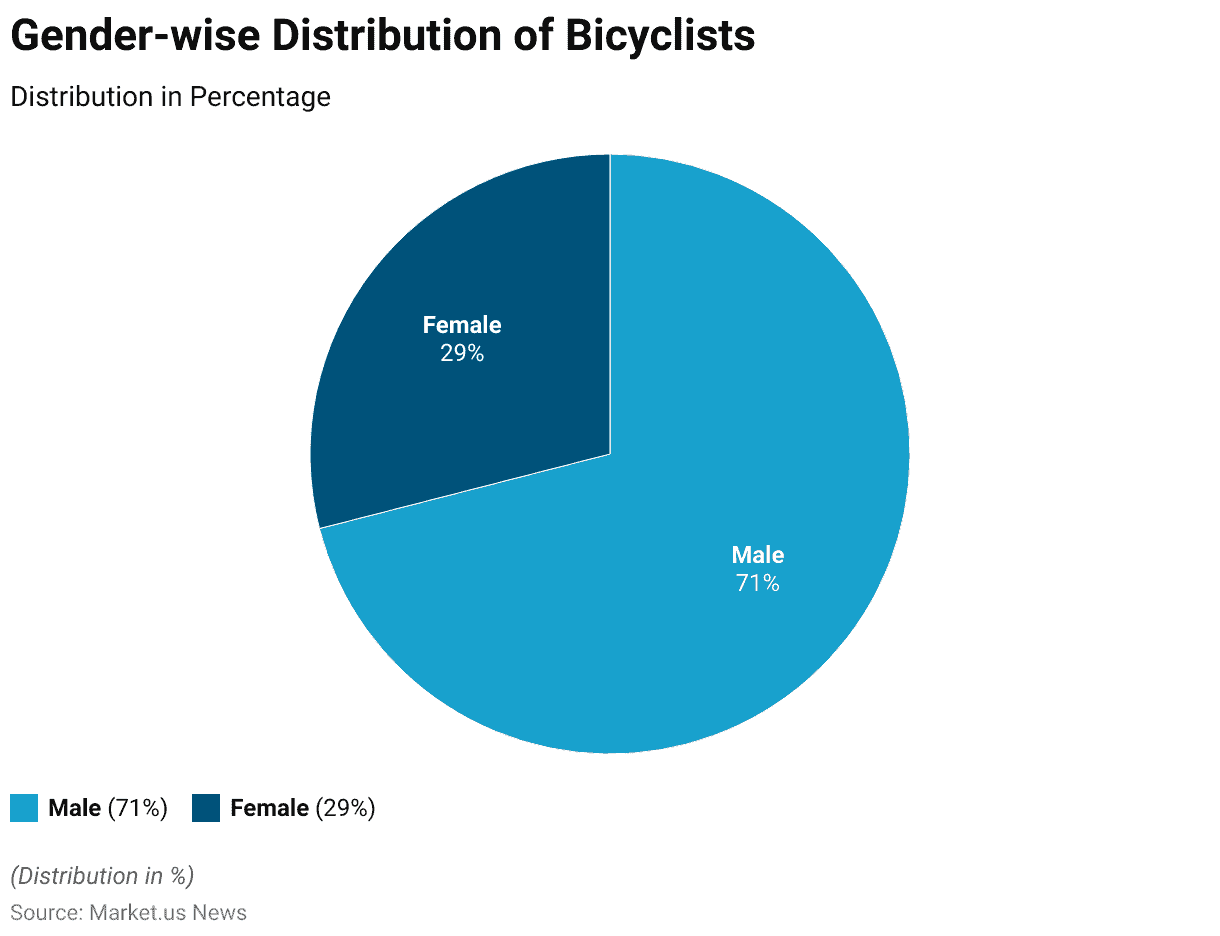
- The demographic characteristics of bicyclists by gender indicate a significant disparity.
- Males constitute the majority of bicyclists, accounting for 71% of the population.
- In contrast, females represent 29% of bicyclists.
- This data highlights a notable gender gap in bicycle usage.
(Source: The University of Texas at Austin)
Education
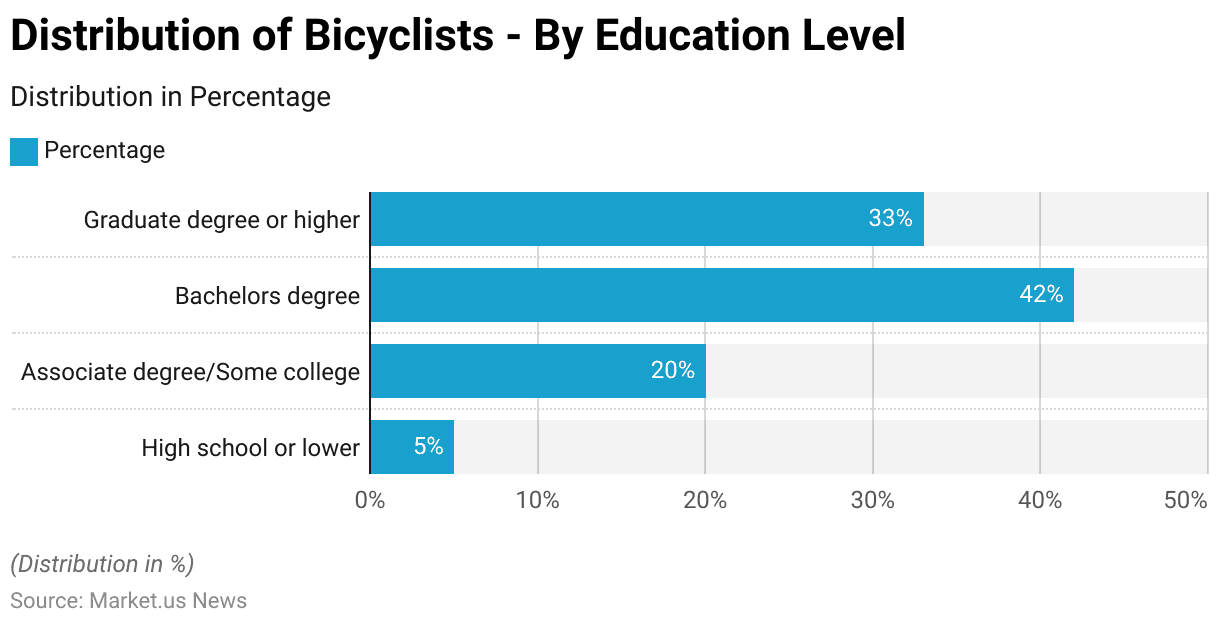
- The demographic characteristics of bicyclists by education level show a diverse range of educational backgrounds.
- Individuals with a bachelor’s degree make up the largest segment, accounting for 42% of bicyclists.
- Those with a graduate degree or higher represent 33% of the population.
- Bicyclists with an associate degree or some college education constitute 20%, while those with a high school education or lower comprise 5%.
- This data indicates that a significant portion of bicyclists have attained higher education levels.
(Source: The University of Texas at Austin)
Race/ Ethnicity
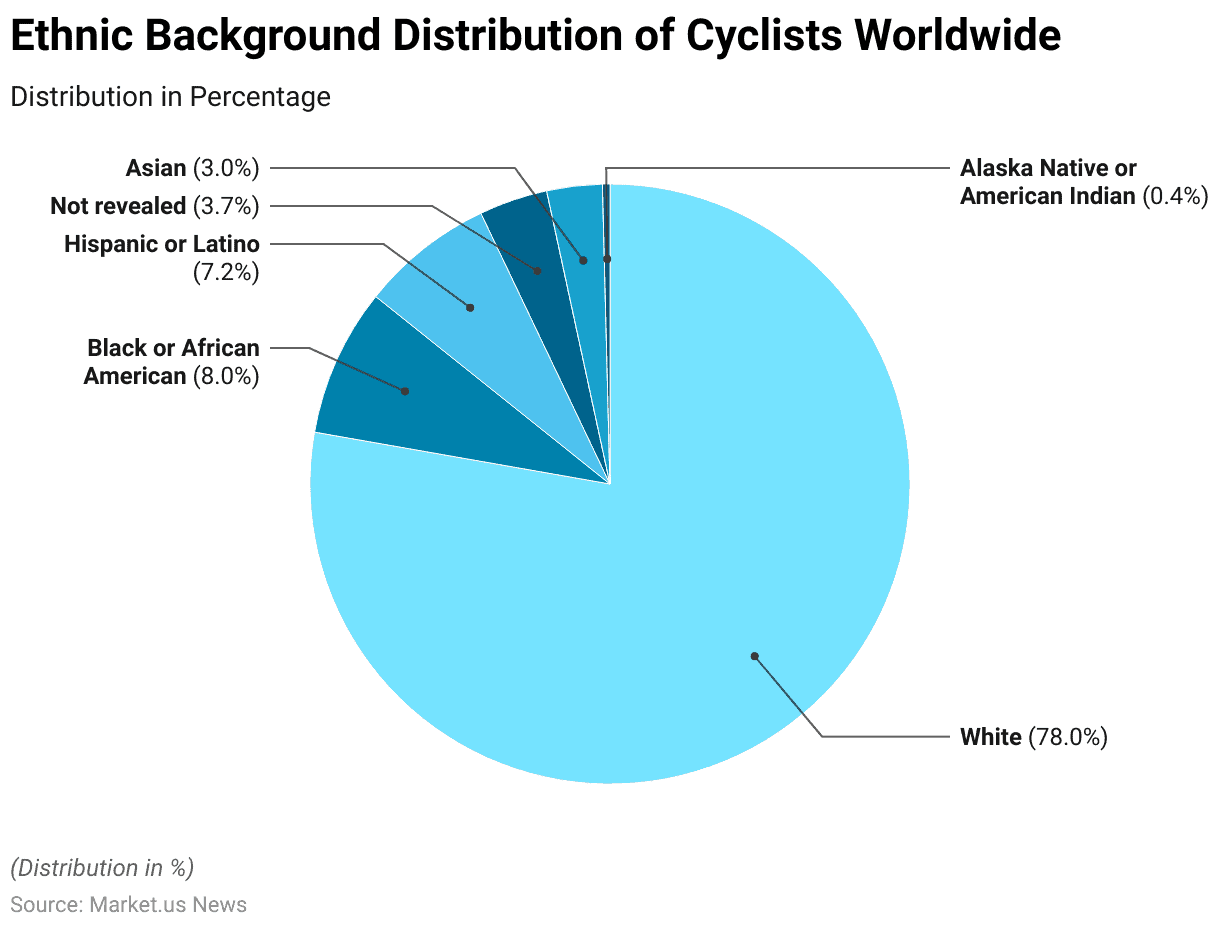
- The bicycle industry statistics indicate that people from various ethnic backgrounds ride bicycles regularly. Globally, 78% of cyclists are white.
- Black or African American individuals make up 8% of cyclists, while 7.2% are from Hispanic or Latino backgrounds.
- Asian cyclists constitute 3% of the cycling population.
- Only 0.4% of cyclists are Alaska Native or American Indian.
- Additionally, 3.7% of people who ride bicycles regularly have not disclosed their ethnic background.
- This data highlights the diverse ethnic composition of the global cycling community.
(Source: Zippia)
General Bicycle Use Characteristics
Purpose for Bicycling
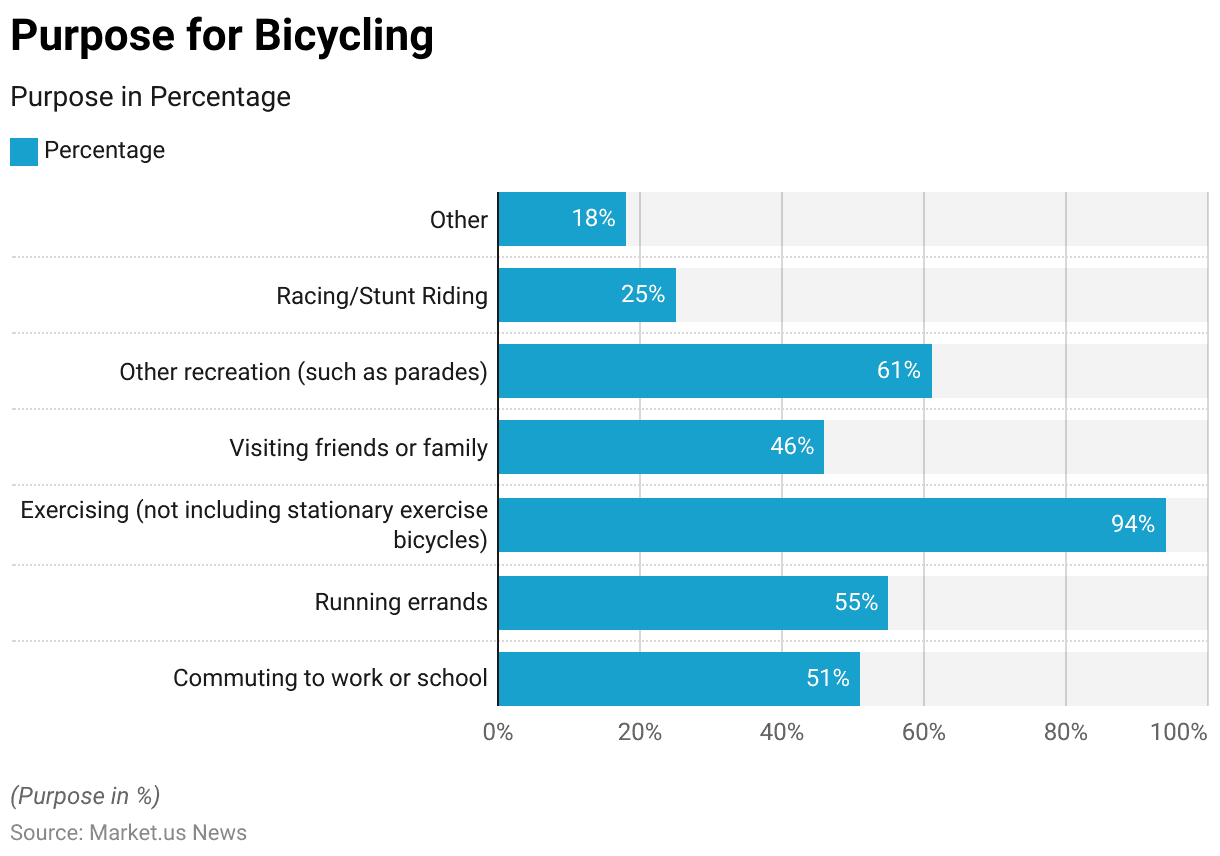
- The purposes for bicycling among respondents vary widely.
- Exercising is the most common reason, with 94% of respondents cycling for this purpose (excluding stationary exercise bicycles).
- Running errands is another frequent activity, with 55% of respondents using bicycles for this purpose.
- Commuting to work or school accounts for 51% of bicycle use.
- Other recreational activities, such as participating in parades, engage 61% of cyclists.
- Visiting friends or family is a reason for 46% of respondents, while 25% use bicycles for racing or stunt riding.
- Additionally, 18% of respondents indicated other unspecified reasons for bicycling.
(Source: The University of Texas at Austin)
Duration of Bicycling for Commuting
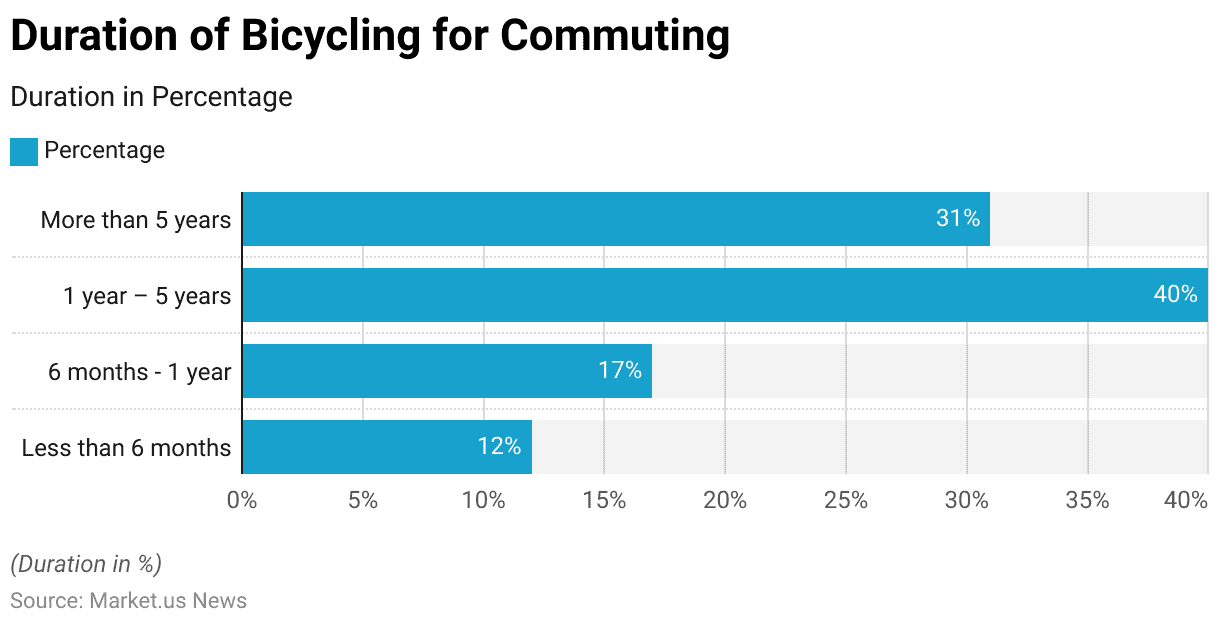
- The duration of bicycling and commuting among respondents shows a range of experience levels.
- 12% of respondents have been commuting by bicycle for less than six months.
- Those who have been commuting for six months to one year make up 17% of the respondents.
- A significant portion, 40%, have been using bicycles for commuting for one to five years.
- Meanwhile, 31% of respondents have been commuting by bicycle for more than five years.
- This data illustrates a diverse range of bicycling experiences among commuters.
(Source: The University of Texas at Austin)
Bicycling and Not Bicycling Reasons
Reasons for Bicycling
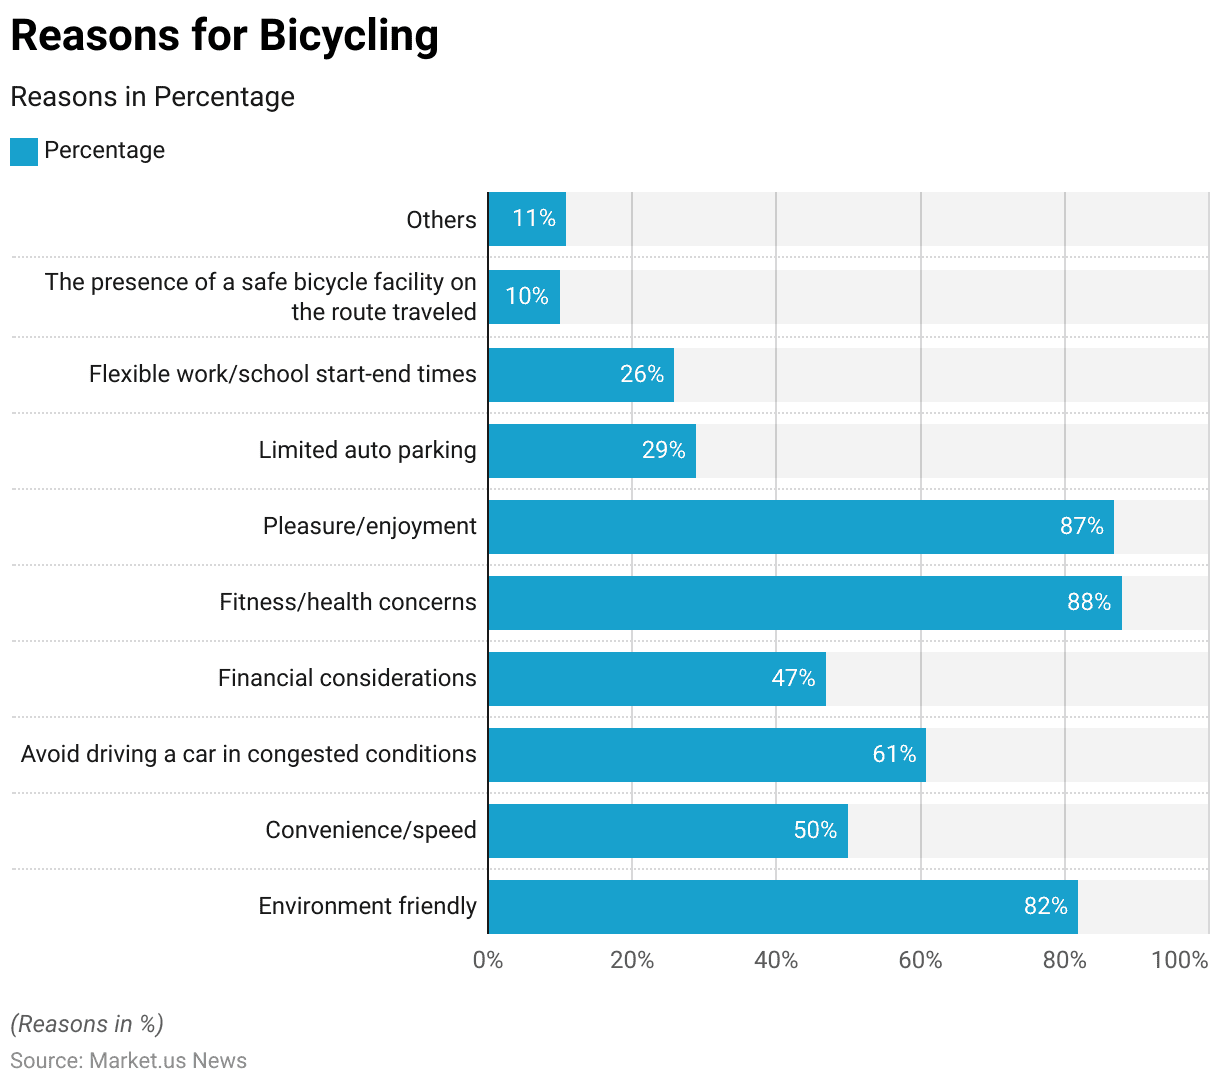
- Respondents cited various reasons for bicycling, with fitness and health concerns being the most prevalent at 88%.
- Pleasure and enjoyment closely followed, with 87% of respondents cycling for these reasons.
- Environmental friendliness was also a significant motivator, cited by 82%.
- Avoiding driving in congested conditions was a reason for 61% of respondents, while 50% chose bicycling for its convenience and speed.
- Financial considerations motivated 47% of respondents, and 29% cycled due to limited auto parking.
- Flexible work or school start-end times influenced 26% of respondents, and 10% bicycled because of the presence of a safe bicycle facility on their route.
- Additionally, 11% of respondents indicated other reasons for bicycling.
(Source: The University of Texas at Austin)
Reasons for Not Bicycling
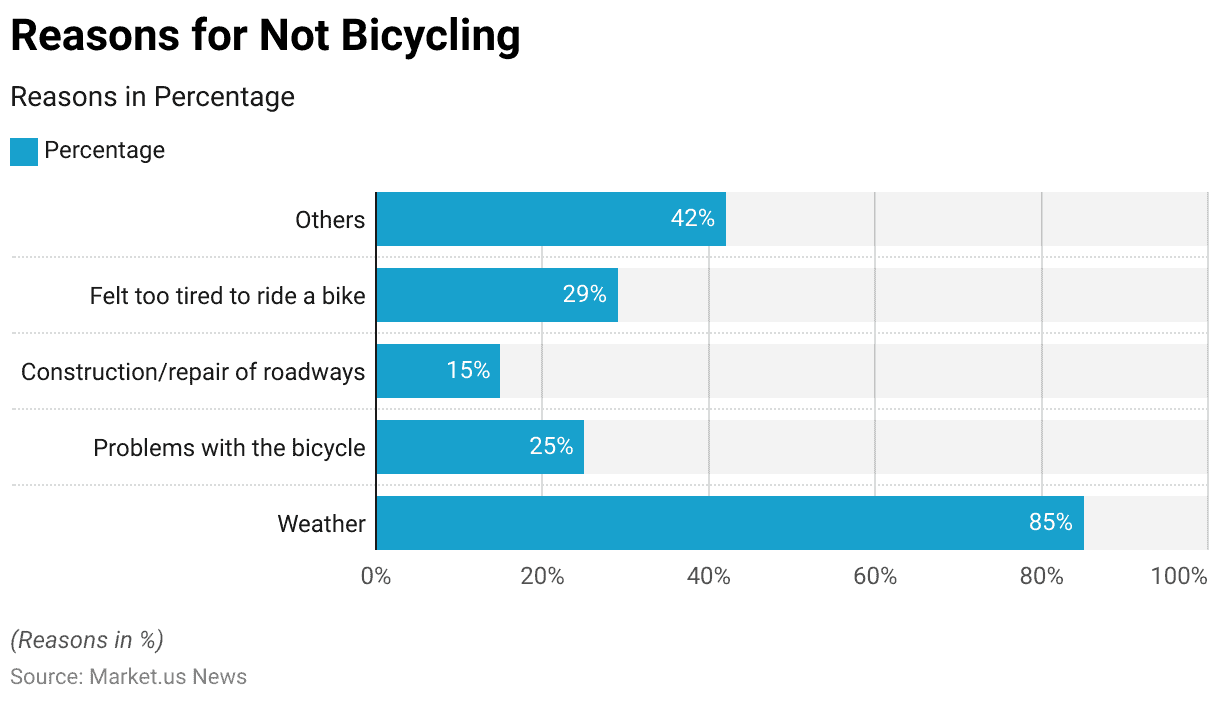
- Respondents provided several reasons for not bicycling, with weather being the most common deterrent, cited by 85% of respondents.
- Feeling too tired to ride a bike was a reason for 29%, while 25% mentioned problems with their bicycles.
- Construction or repair of roadways was a factor for 15% of respondents.
- Additionally, 42% of respondents cited other unspecified reasons for not bicycling.
(Source: The University of Texas at Austin)
Frequency of Bicycle Use for Transportation in Various Countries Statistics
- A survey on the frequency of bicycle use for transportation reveals varying patterns across different countries.
- In the Netherlands, 53% of respondents reported using their bike for transportation at least twice a week.
- Poland followed with 36%, while Germany, India, and Brazil each had 34% of respondents using bicycles frequently.
- In Sweden, 30% of respondents used their bike regularly, compared to 26% in China.
- France reported a 20% share of frequent bicyclists, while the United States had 16%.
- South Korea had the lowest percentage, with 12% of respondents using their bikes for transportation twice a week or more.
(Source: Statista)
Public Bicycle Statistics
Number of Public Use Bicycle Worldwide Statistics
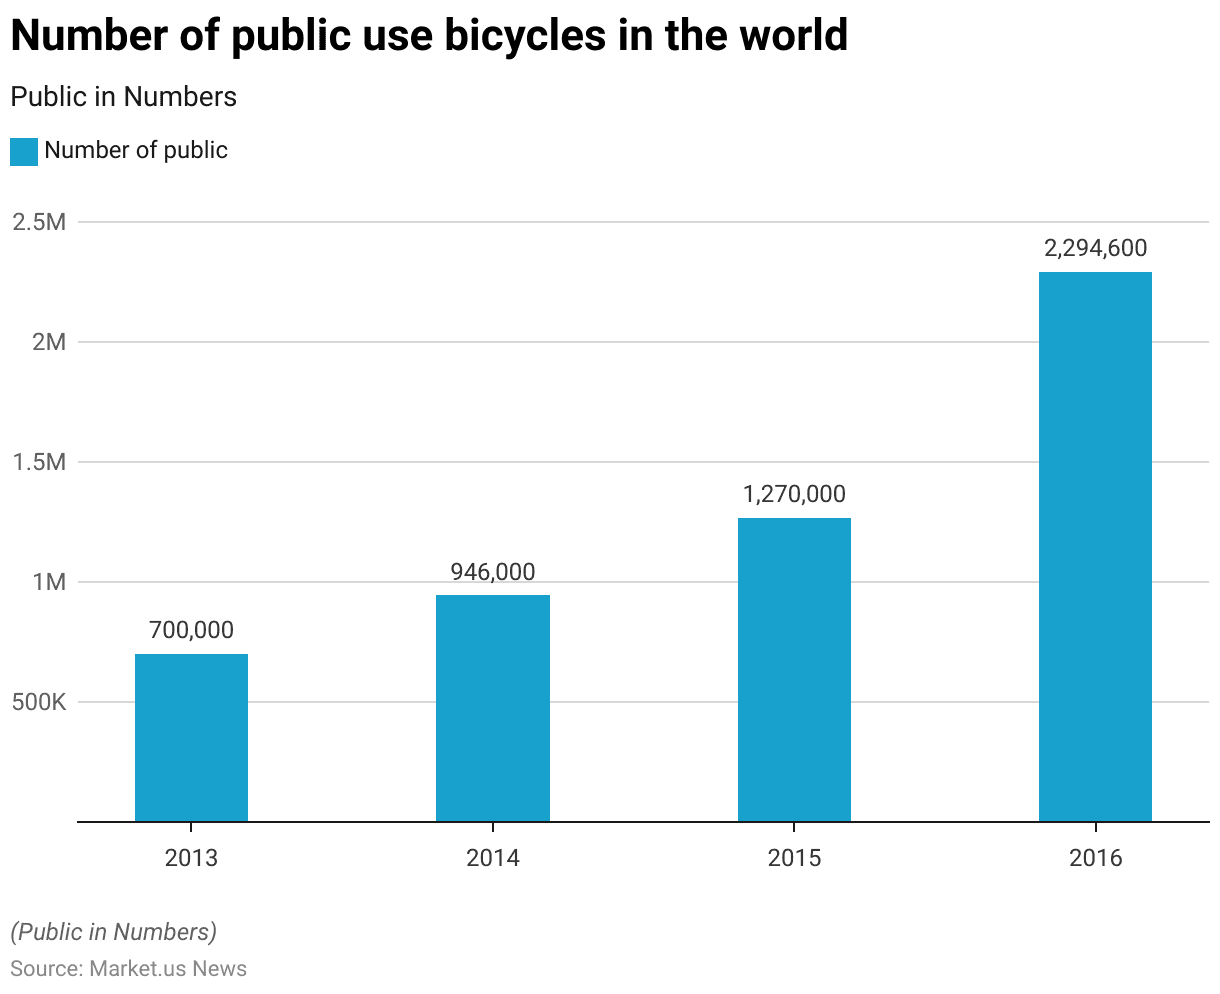
- The number of bicycles used by the public worldwide has shown significant growth over the years.
- In 2013, there were 700,000 people globally who used bicycles.
- This number increased to 946,000 in 2014.
- The upward trend continued in 2015, with the number of bicycles used by the public reaching 1,270,000.
- By 2016, the global count had surged to 2,294,600.
- This data highlights the rapid expansion and increasing popularity of public bicycle-sharing programs around the world.
(Source: Statista)
Number of Public Use Bicycle Programs – By Country Statistics
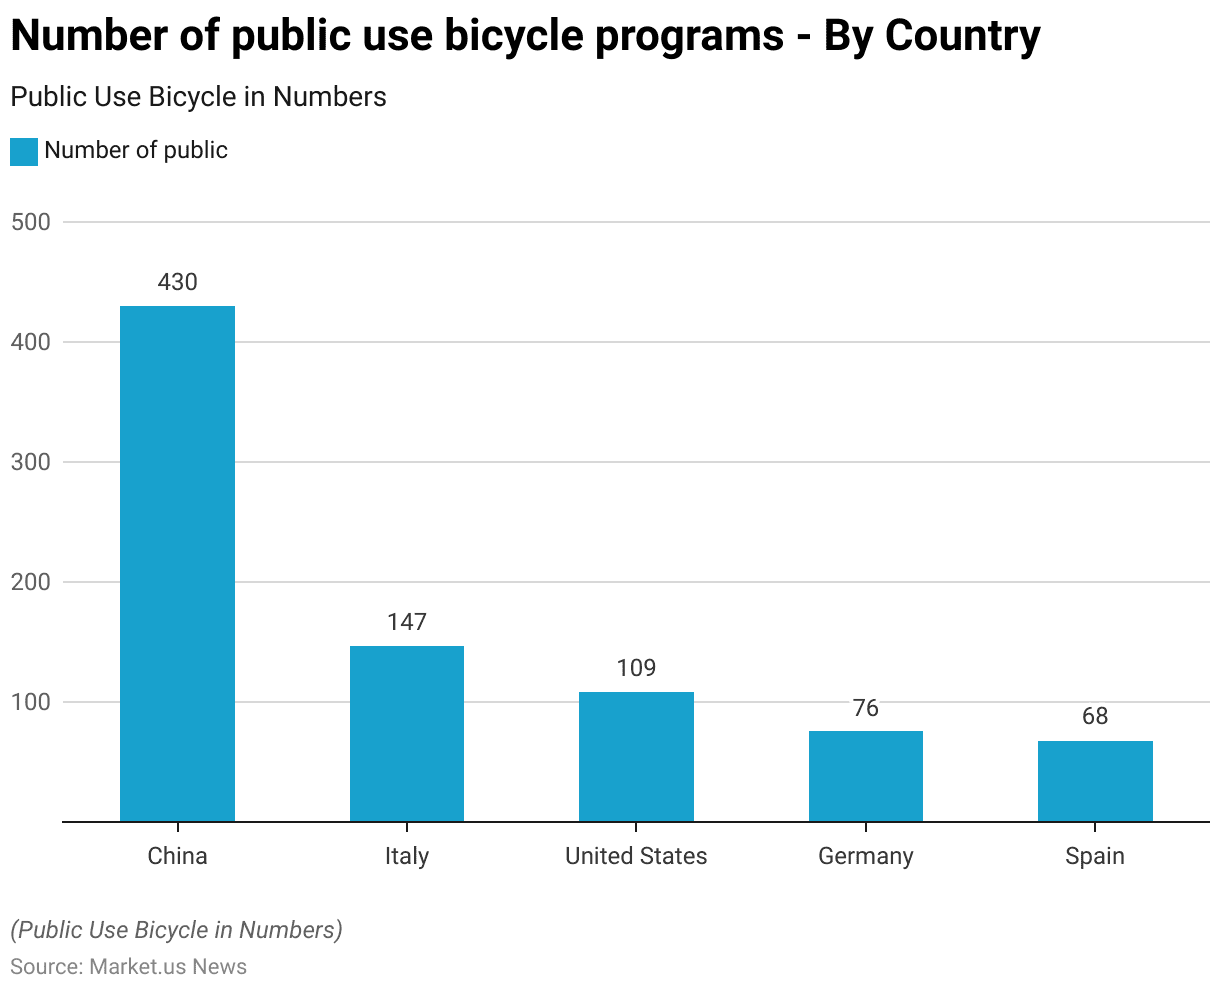
- The number of public bicycle programs that are used varies significantly across different countries.
- China leads with 430 programs, demonstrating a strong commitment to bicycle-sharing initiatives.
- Italy follows with 147 programs, indicating widespread adoption of public bicycles.
- The United States has 109 programs, reflecting its growing interest in alternative transportation methods.
- Germany and Spain have 76 and 68 public-use bicycle programs, respectively, showcasing their efforts to promote sustainable urban mobility.
- This data underscores the global expansion and diversity of public bicycle-sharing programs.
(Source: Statista)
Effects on Bicycling During and After the COVID-19 Pandemic
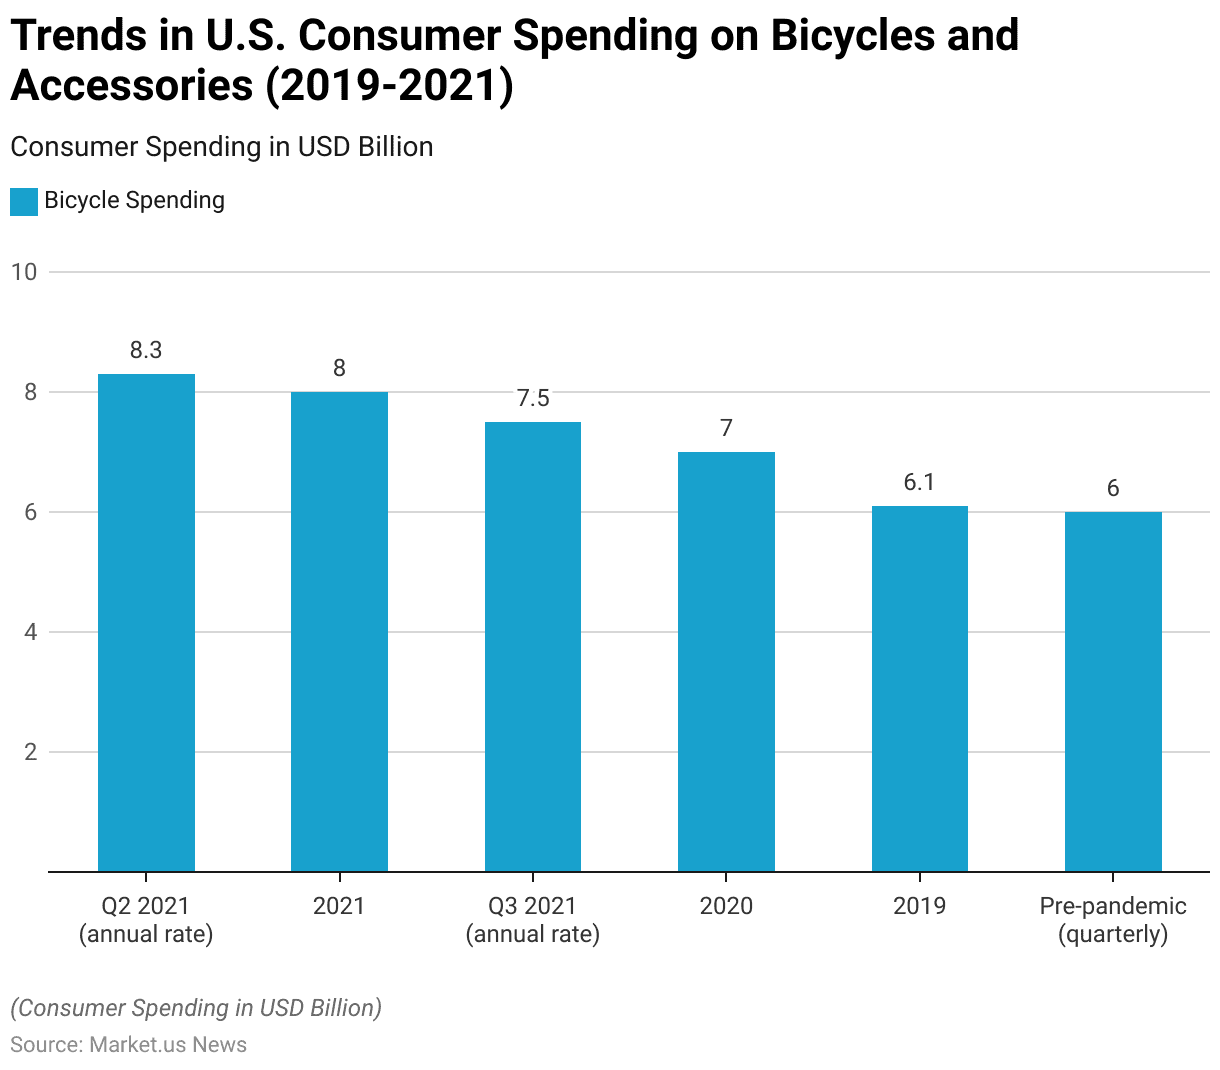
- According to inflation-adjusted figures published by the U.S. Bureau of Economic Analysis, Americans spent $7.0 billion on bicycles and accessories in 2020, an increase from $6.1 billion the previous year.
- The upward trend continued in 2021, with consumer spending on bicycles and accessories reaching nearly $8 billion.
- Seasonally adjusted quarterly figures show that bicycle spending peaked in Q2 2021, with consumers purchasing bikes and equipment at an annual rate of $8.3 billion, compared to pre-pandemic spending of around $6 billion per quarter.
- Starting in Q3 2021, when warmer weather and rising vaccination rates contributed to lower COVID-19 case counts and a return to normal life, bicycle spending began to decrease.
- Despite this decline, spending remained at an annual rate of $7.5 billion, still above pre-pandemic levels, fueling hopes that the industry could maintain a higher gear compared to pre-COVID days.
(Source: Statista)
Bicycle Market Trends
An Increasing Count of Cycling Events
- The increasing popularity of bicycles for recreation and trekking, along with more cycling events, is expected to boost demand for both general and sports bikes. Celebrity endorsements and media coverage are also driving market growth.
- A 2022 survey by the Allgemeiner Deutscher Fahrrad-Club (ADFC) in Germany found that 96% of respondents owned bicycles.
- In Europe, organizations like Cycling Ireland promote cycling activities such as road racing, leisure touring, track racing, and off-road racing.
(Source: Allgemeiner Deutscher Fahrrad-Club (ADFC) Survey)
Investment in Cycling Events
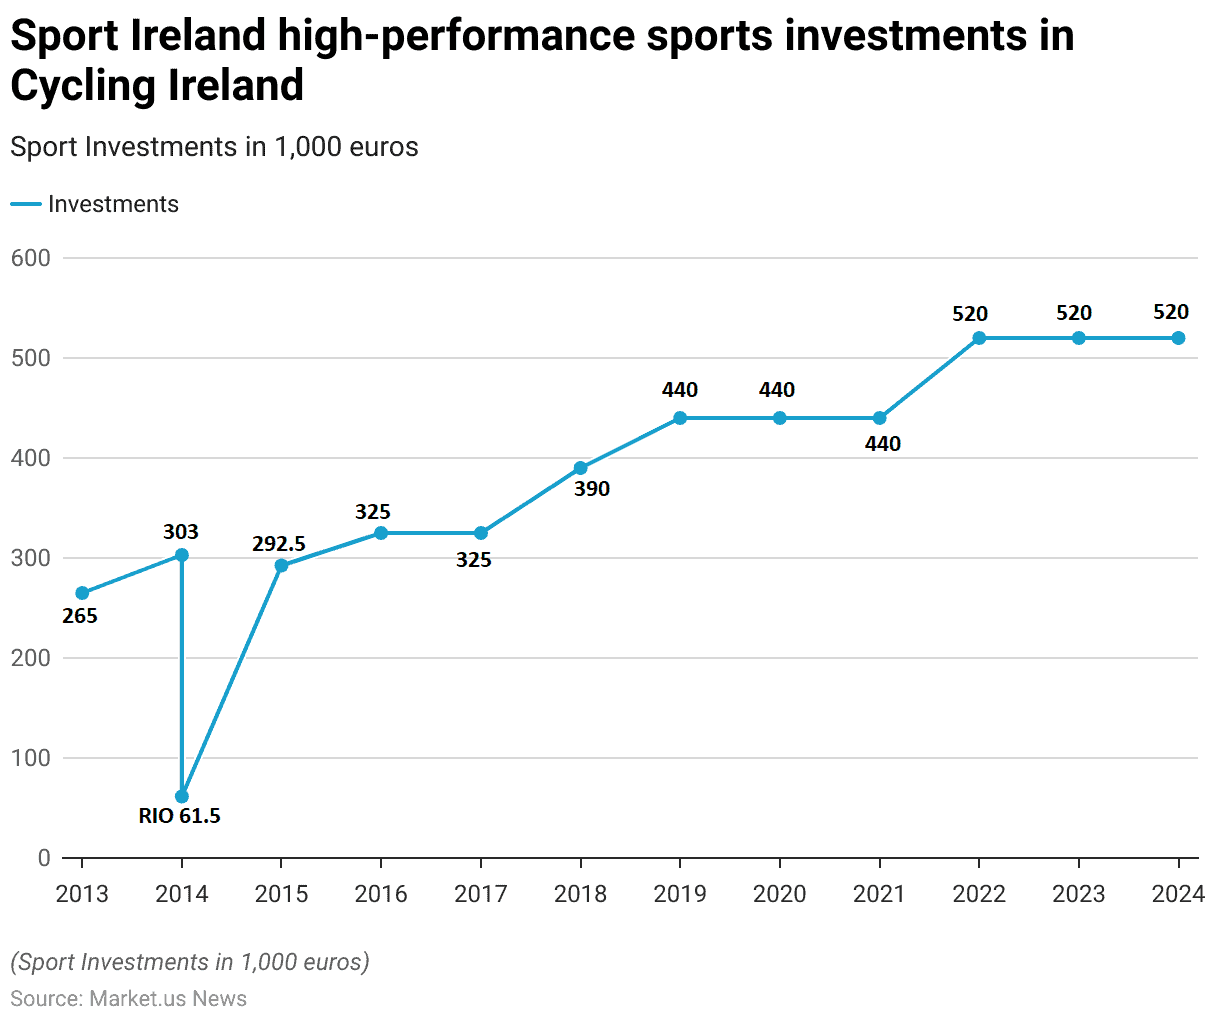
- Sport Ireland’s high-performance sports investments in Cycling Ireland have shown a steady increase over the years.
- In 2013, the investment was 265,000 euros, rising to 303,000 euros in 2014.
- In Rio 2014, there was a special allocation of 61,500 euros.
- In 2015, the investment slightly decreased to 292,500 euros but increased again to 325,000 euros in 2016 and remained at that level in 2017.
- The investments continued to grow, reaching 390,000 euros in 2018 and 440,000 euros in 2019, and maintained at this level through 2020 and 2021.
- In 2022, the investment increased to 520,000 euros, which has been sustained at this amount through 2023 and is projected to continue at the same level in 2024.
- This consistent funding reflects Sport Ireland’s commitment to enhancing high performance in Cycling Ireland.
(Source: Statista)
Recent Developments
Acquisitions:
- Fox Factory’s Acquisition of Marucci Sports: Fox Factory acquired Marucci Sports, a baseball and softball equipment brand, for $572 million. This acquisition is part of Fox Factory’s strategy to diversify and strengthen its market position by expanding into new sports segments.
New Product Launches:
- Rad Power’s New E-Trikes: Rad Power Bikes launched new e-trikes in 2023, with pre-order prices starting at $2,499. These e-trikes aim to provide a more affordable and accessible option for consumers interested in electric cargo bikes.
- Mate’s SUV E-Cargo Bike: Danish brand Mate introduced its SUV e-cargo bike, made from 90% recycled aluminum. It features Envilio step-less hub gears and 4G connectivity for vehicle tracking. This bike can carry two children or one adult, with a final estimated retail price of around €6,499.
Funding:
- Upway’s Series B Investment: Upway, an e-bike reseller, secured $30 million in Series B funding led by Korelya Capital. This brings Upway’s total funding to $60 million. The funds will support the company’s expansion in the U.S., including opening a new warehouse on the West Coast.
- EAV’s Funding Drive: EAV, a UK-based e-cargo bike manufacturer, secured £7.5 million in funding in 2022. The company plans to use these funds to expand its product lineup and enter new markets, including a subscription scheme and a consumer-focused machine called the EAVme.
Market Growth:
- Global Bicycle Market Expansion: The growth is driven by the increasing adoption of bicycles for leisure, exercise, and commuting.
- Rising Demand for E-Bikes: The demand for e-bikes continues to surge, particularly in Europe. For example, e-bike exports from Taiwan increased by over 100% in countries like France, Italy, and the Czech Republic in 2022. The overall export value of complete bicycles from Taiwan reached $1.617 billion, a 23% increase compared to 2021.
Innovation in Bicycle Technologies:
- Integration of IoT and Smart Features: Companies are increasingly integrating Internet of Things (IoT) technologies into bicycles. This includes features such as vehicle tracking, advanced connectivity, and smart sensors to enhance user experience and safety.
- Focus on Sustainability: The bicycle industry is also emphasizing sustainable practices. Innovations include the use of recycled materials and energy-efficient manufacturing processes. For example, Mate’s SUV e-cargo bike is made from 90% recycled aluminum, reflecting a growing trend towards eco-friendly products.
Conclusion
Bicycle Statistics – Bicycles are increasingly popular for recreation and commuting, driven by environmental awareness, health consciousness, and expanded cycling infrastructure.
The global market has grown significantly, with strong investments in public bike-sharing programs and cycling initiatives.
Diverse demographics, including various age groups, genders, and educational backgrounds, reflect bicycling’s widespread appeal.
Celebrity endorsements and media coverage further boost the market. Despite challenges like weather and infrastructure issues, the demand for bicycles remains robust.
As cities improve cycling facilities and promote events, the future of the bicycle industry looks promising, supporting urban mobility and healthier lifestyles.
FAQs
Cycling offers numerous benefits, including improved cardiovascular health, reduced environmental impact, cost savings on transportation, and enhanced mental well-being.
Common types include road bikes, mountain bikes, hybrid bikes, commuter bikes, and e-bikes. Each type is designed for specific uses and terrains.
Key accessories include a helmet, bike lock, lights, a pump, a repair kit, and water bottle holders. Optional accessories for added comfort and functionality include fenders, racks, and panniers.
E-bikes offer the benefits of traditional cycling with added electric assistance. They make commuting easier, especially on hilly terrain, and they can increase your range and reduce the effort required for long rides.
Cycling reduces carbon emissions, decreases traffic congestion, and lowers your overall environmental footprint. It is a sustainable mode of transportation that promotes cleaner air and a healthier planet.