

Table of Contents
- Introduction
- Editor’s Choice
- Sports Tourism Market Overview
- History of Sports Tourism
- Global Sports Participation Statistics
- Sports-Related Travel Volume Statistics
- Sports Tourism Events Statistics
- Sports Tourism Spending Statistics
- Sports Tourism Funding Statistics
- Economic Impact of the Sports Tourism Sector
- Regulations for Sports Tourism
Introduction
According to Sports Tourism Statistics, Sports tourism is a vibrant segment of the global tourism industry. Revolves around travel for participating in and spectating sports events.
Major international tournaments like the Olympics and FIFA World Cup attract millions annually. Stimulating local economies through spending on accommodation, dining, and leisure activities.
Beyond spectatorship, participants engage in activities such as training camps, marathons, and adventure sports, contributing to destination appeal.
The sector’s growth is bolstered by digital engagement, health and wellness trends, and sustainability initiatives to enhance event experiences and environmental responsibility.
Despite challenges like infrastructure demands and seasonal fluctuations. Sports tourism is poised for continued expansion, driven by global sports enthusiasm and evolving travel preferences.
Editor’s Choice
- The global sports tourism market revenue reached USD 598.0 billion in 2023.
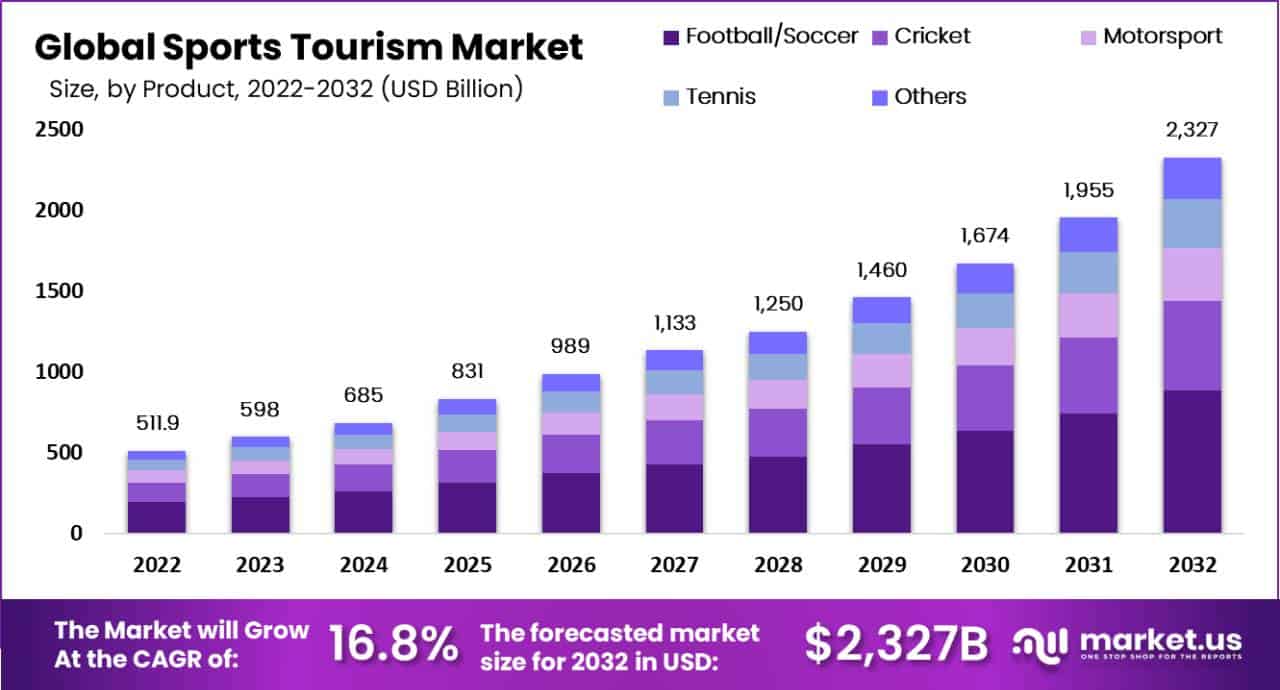
- By 2032, the market is projected to reach USD 2,327.0 billion, with football/soccer, contributing USD 884.3 billion, cricket USD 558.5 billion, motorsport USD 325.8 billion, tennis USD 302.5 billion, and other sports USD 256.0 billion.
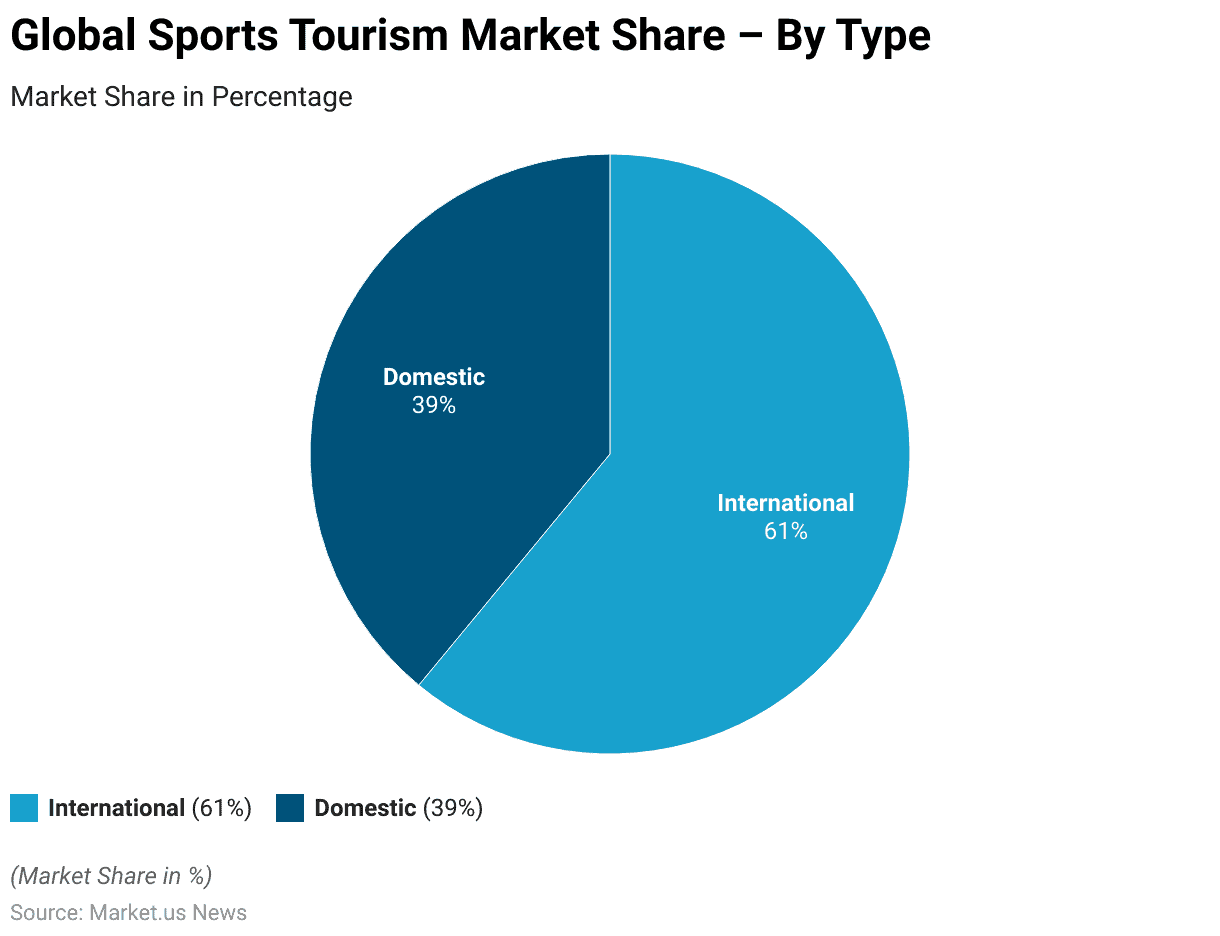
- A significant division between international and domestic segments characterizes the sports tourism market. International sports tourism holds a predominant market share, accounting for 61% of the total market.
- Norway leads with a Bloomberg Health Index of 89.09. An impressive 83.9% of the population practicing sports, and 10.31 medals per 100,000 people. Resulting in a high overall score of 90.3. Football (soccer) is the most popular sport.
- The global sports travel industry exhibited a steady increase in sports travelers from 2015 to 2019 before experiencing a dramatic decline in 2020 and a subsequent rebound in 2021.
- In 2021, a diverse range of sports tourism events were hosted across various destinations, reflecting the industry’s broad appeal. Youth events were the most prevalent, with 97% of destinations hosting such events. Highlighting the strong focus on engaging younger athletes.
- The sports tourism sector’s direct expenditure of $39.7 billion leads to $22.0 billion in indirect spending and $30.1 billion in induced spending. Resulting in a total economic impact of $91.8 billion.
Sports Tourism Market Overview
Global Sports Tourism Market Size
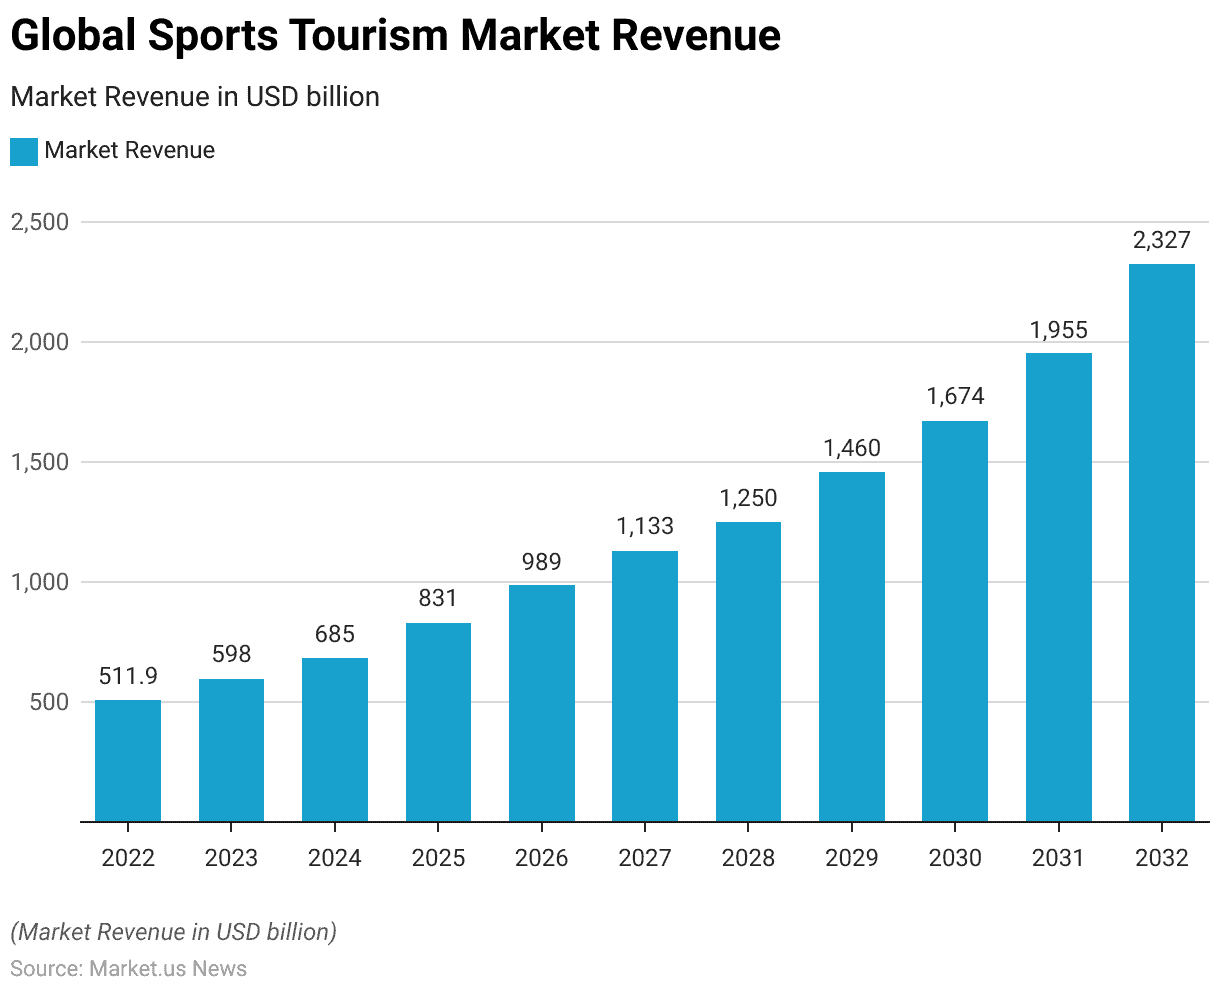
- The global sports tourism market has shown significant growth over the years at a CAGR of 16.80%, with revenue figures reflecting a robust upward trajectory.
- In 2022, the market revenue was recorded at USD 511.9 billion. This figure rose to USD 598.0 billion in 2023, marking a substantial increase.
- In 2031, the market soared to USD 1,955.0 billion, culminating in a projected revenue of USD 2,327.0 billion by 2032.
Sports Tourism Market Size – By Product
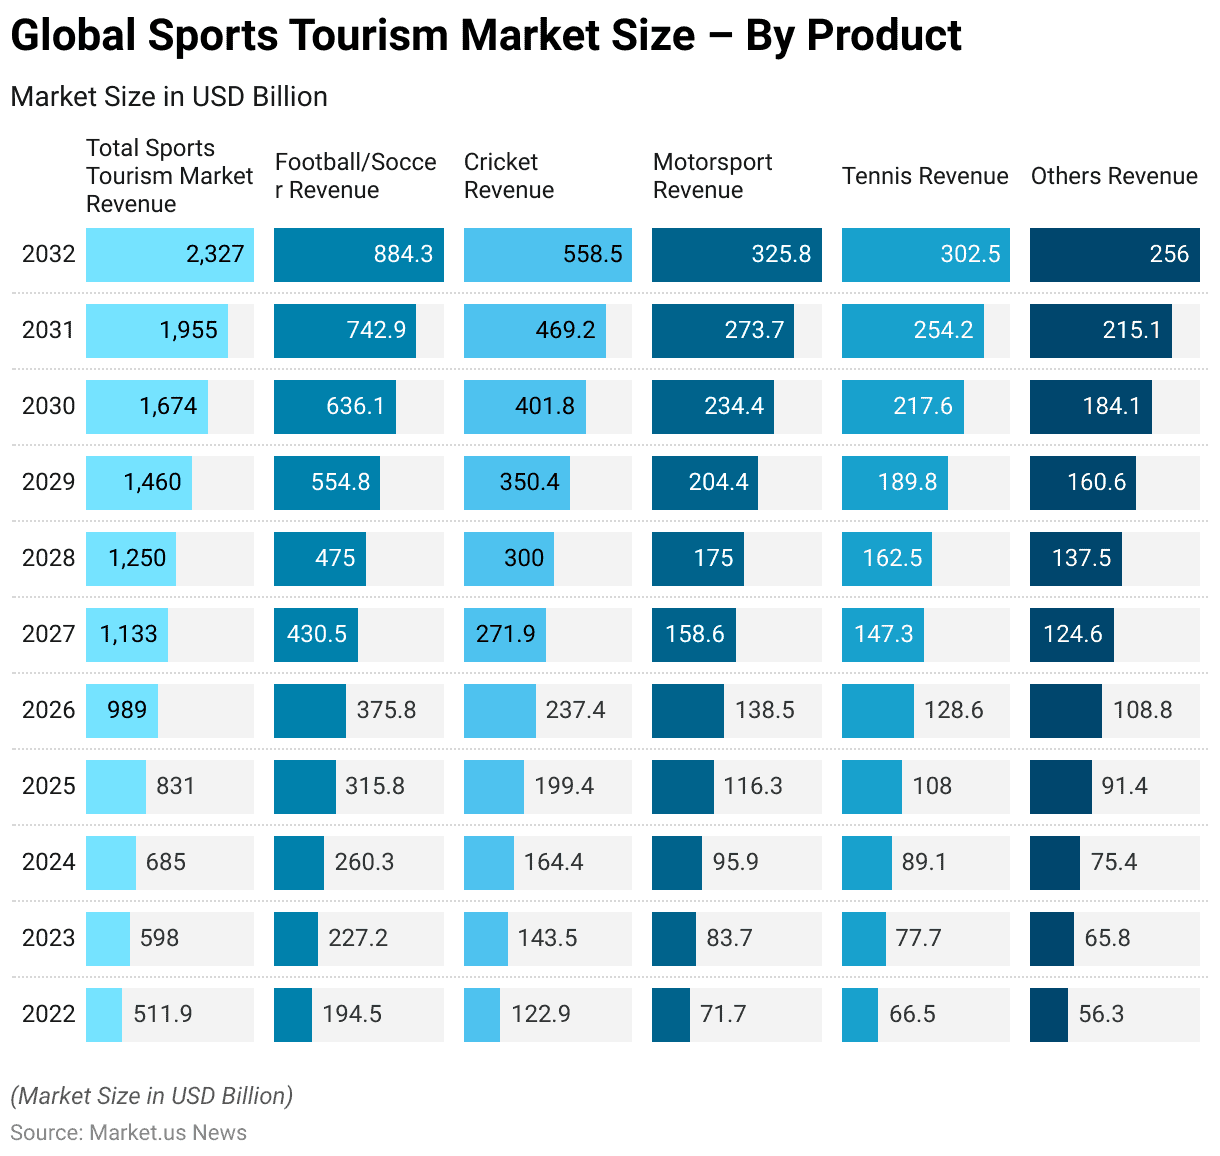
- The global sports tourism market has exhibited robust growth, with revenues distributed across various sports categories.
- In 2022, the total market revenue was USD 511.9 billion. Football/soccer contributed USD 194.5 billion, cricket USD 122.9 billion, motorsport USD 71.7 billion, tennis USD 66.5 billion, and other sports USD 56.3 billion.
- By 2032, the market is projected to reach USD 2,327.0 billion, with football/soccer contributing USD 884.3 billion, cricket USD 558.5 billion, motorsport USD 325.8 billion, tennis USD 302.5 billion, and other sports USD 256.0 billion.
Sports Tourism Market Share – By Type
- A significant division between international and domestic segments characterizes the sports tourism market.
- International sports tourism holds a predominant market share, accounting for 61% of the total market.
- In contrast, domestic sports tourism represents 39% of the market share.
History of Sports Tourism
- The history of sports tourism dates back to ancient times, with its roots deeply embedded in early athletic competitions.
- The concept can be traced to the ancient Olympic Games in Greece. Which began in 776 BC and attracted participants and spectators from various regions. These games were not only athletic competitions but also significant cultural and religious festivals. Drawing large crowds and promoting travel and interaction among different Greek city-states.
- During the Roman Empire, sports tourism was also prominent. The Colosseum hosted gladiatorial contests that attracted vast numbers of spectators from across the empire. These events were social and political spectacles, providing entertainment and serving as a means of demonstrating power and control.
- In the medieval and Renaissance periods, jousting tournaments, archery contests, and horse races continued to draw participants and audiences, fostering a tradition of sports-related travel.
- By the 19th and 20th centuries, the advent of modern transportation facilitated the growth of international sports tourism. Events such as the first modern Olympic Games in 1896 in Athens and the inaugural FIFA World Cup in 1930 in Uruguay marked significant milestones.
- The late 20th and early 21st centuries have seen exponential growth in sports tourism, driven by globalization. Increased disposable incomes, and advancements in media and communication.
- Major events such as the Olympic Games, FIFA World Cup, and various world championships in sports like tennis, cricket, and motorsport have become global spectacles. Drawing millions of international visitors and generating significant economic impact for host cities and countries.
Global Sports Participation Statistics
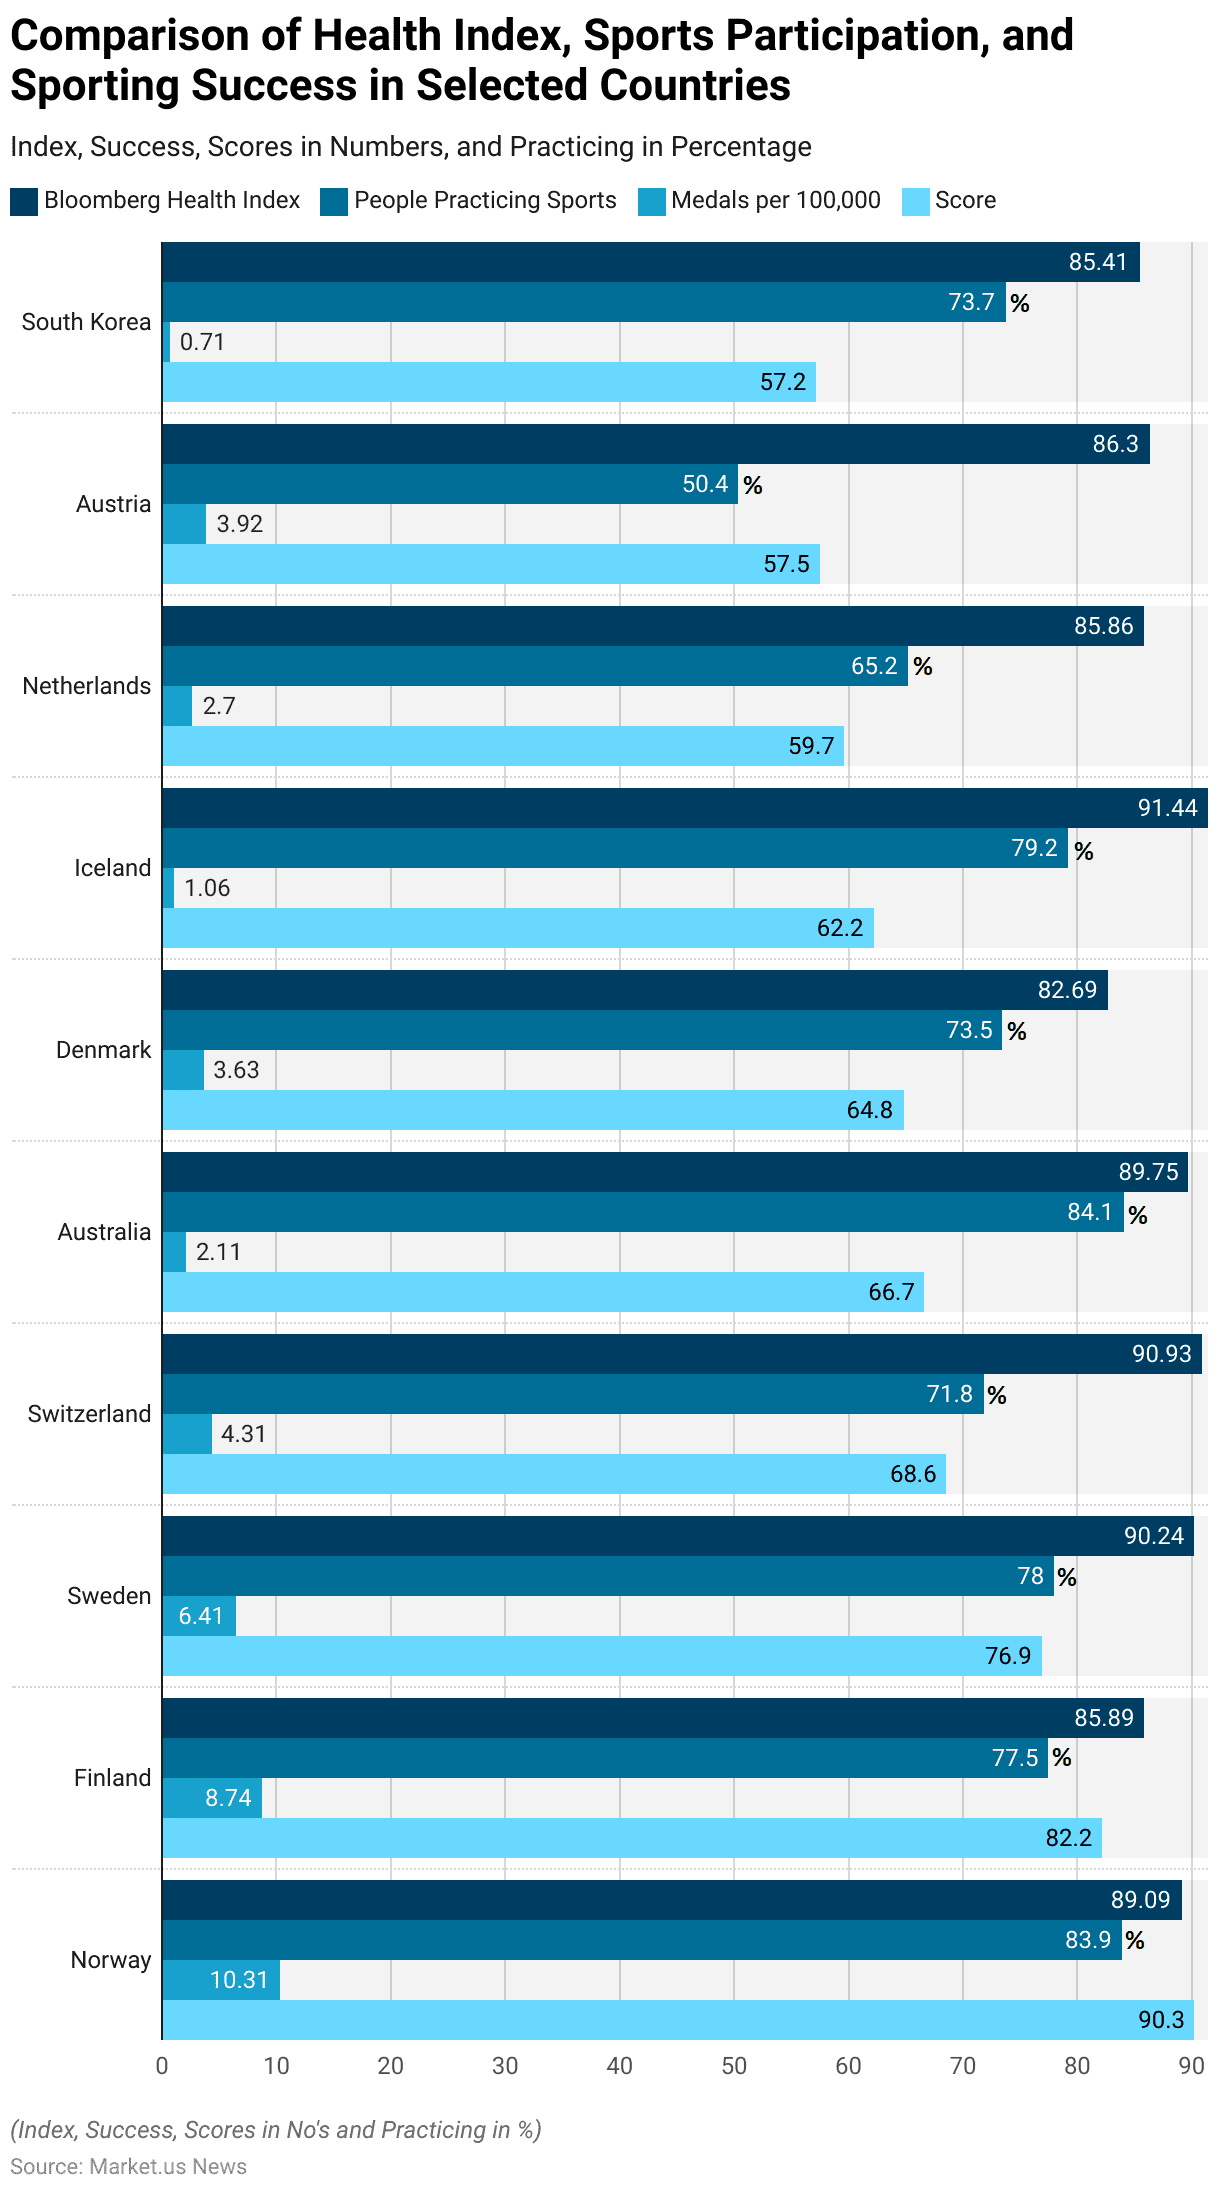
- A comparative analysis of health indices, sports participation rates, and sporting success among selected countries reveals interesting patterns.
- Norway leads with a Bloomberg Health Index of 89.09, an impressive 83.9% of the population practicing sports, and 10.31 medals per 100,000 people, resulting in a high overall score of 90.3. Football (soccer) is the most popular sport.
- Finland follows with an 85.89 health index and 77.5% sports participation. 8.74 medals per 100,000, and a score of 82.2, with ice hockey being the favorite sport.
- Sweden boasts the highest health index at 90.24, with 78% sports participation and 6.41 medals per 100,000, scoring 76.9, with football (soccer) as the most popular sport.
- Switzerland, with a health index of 90.93, sees 71.8% participation in sports and 4.31 medals per 100,000, scoring 68.6, while football (soccer) remains the favorite.
- Australia has a health index of 89.75, with the highest sports participation rate at 84.1%. But only 2.11 medals per 100,000, resulting in a score of 66.7, and Australian football is the most popular sport.
- Denmark scores 82.69 on the health index, with 73.5% participation in sports and 3.63 medals per 100,000, scoring 64.8, favoring football (soccer).
Sports-Related Travel Volume Statistics
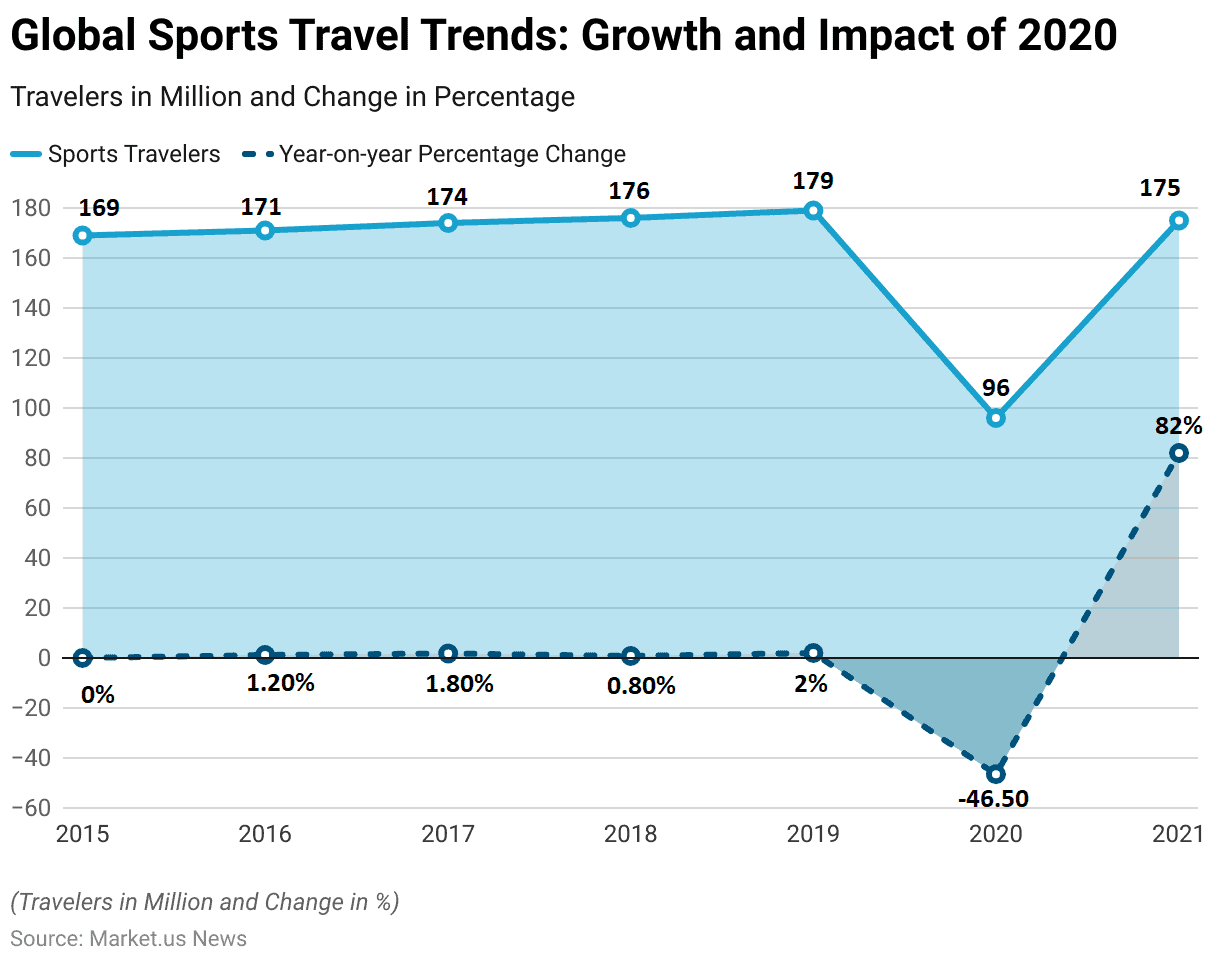
- The global sports travel industry exhibited a steady increase in sports travelers from 2015 to 2019 before experiencing a dramatic decline in 2020 and a subsequent rebound in 2021.
- In 2015, the number of sports travelers was 169 million, with no year-on-year percentage change.
- The year 2020 saw a significant decline due to the COVID-19 pandemic. With sports travelers dropping to 96 million, a staggering 46.50% decrease.
- However, in 2021, the industry showed a strong recovery. With the number of sports travelers surging to 175 million, an impressive 82% increase from the previous year.
Sports Tourism Events Statistics
Destinations Hosting Different Types of Sports Tourism Events
- In 2021, a diverse range of sports tourism events were hosted across various destinations, reflecting the industry’s broad appeal.
- Youth events were the most prevalent, with 97% of destinations hosting such events. Highlighting the strong focus on engaging younger athletes.
- Adult and amateur events were also highly popular, taking place in 94% of destinations.
- Collegiate sports events were hosted by 83% of destinations, showcasing the importance of university-level competitions.
- Senior sports events were held in 53% of destinations, indicating a moderate engagement with this demographic.
- International events were organized by 43% of destinations, emphasizing the global appeal and reach of sports tourism.
- Events sanctioned by the United States Olympic & Paralympic Committee (USOPC) were hosted by 39% of destinations, underscoring the significance of Olympic-related activities.
- Finally, other types of events accounted for 6% of the destinations, representing niche or specialized sporting activities.

Cancelled or Delayed Sports Events Due to COVID-19
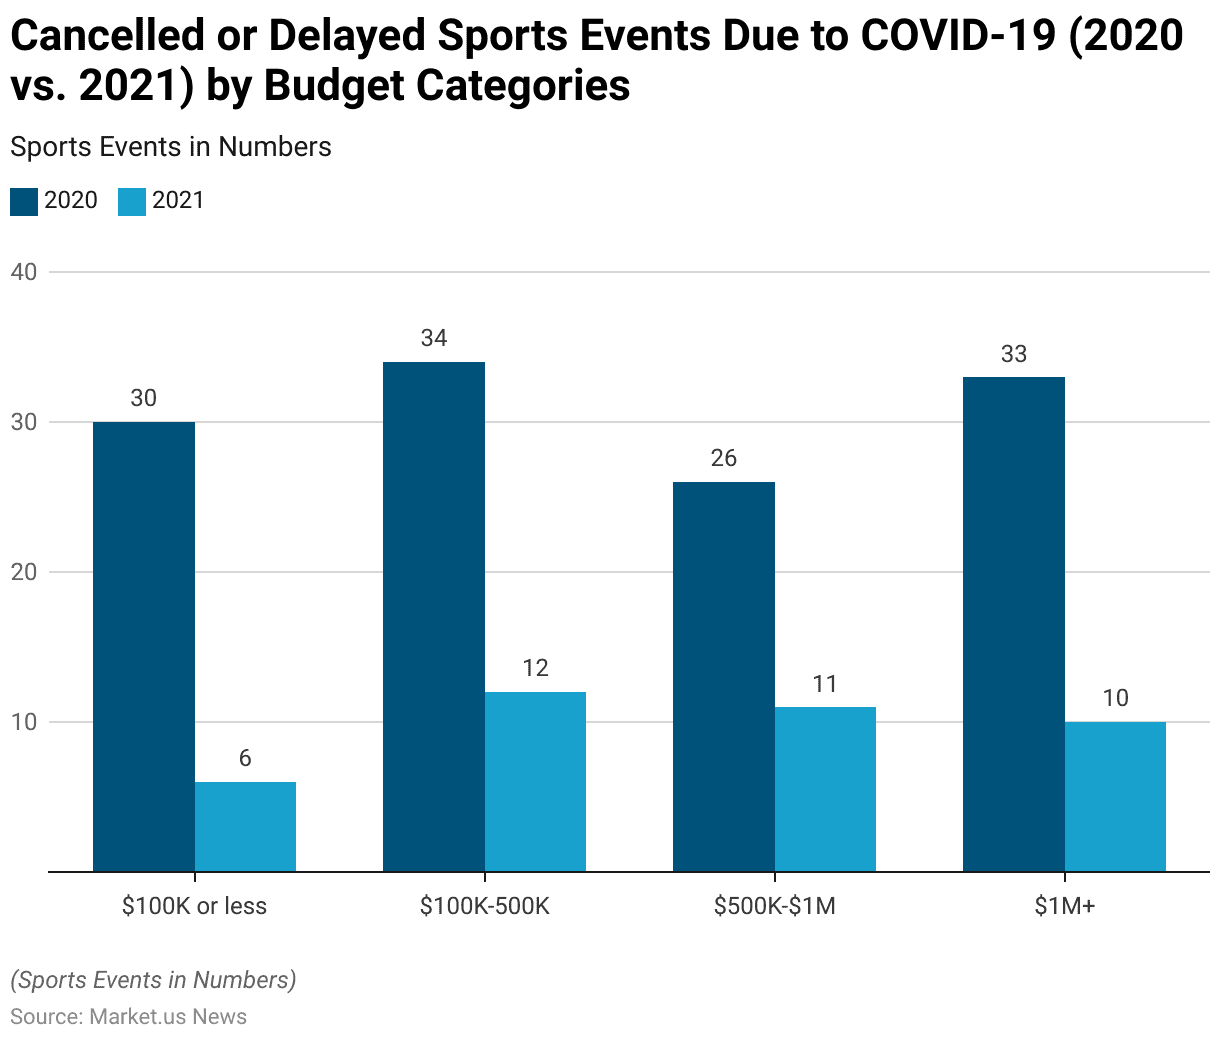
- The impact of COVID-19 on sports events was profound in both 2020 and 2021. With significant variations based on budget categories.
- In 2020, sports events with budgets of $100,000 or less saw 30 cancellations or delays. Which dramatically decreased to 6 in 2021.
- For events with budgets ranging from $100,000 to $500,000. There were 34 cancellations or delays in 2020, reducing to 12 in 2021.
- Events with budgets between $500,000 and $1 million experienced 26 cancellations or delays in 2020, which fell to 11 in 2021.
- The most substantial budget category, events with budgets exceeding $1 million, had 33 cancellations or delays in 2020, decreasing to 10 in 2021.
Sports Tourism Spending Statistics
Sports-related Travel Spending and Annual Growth
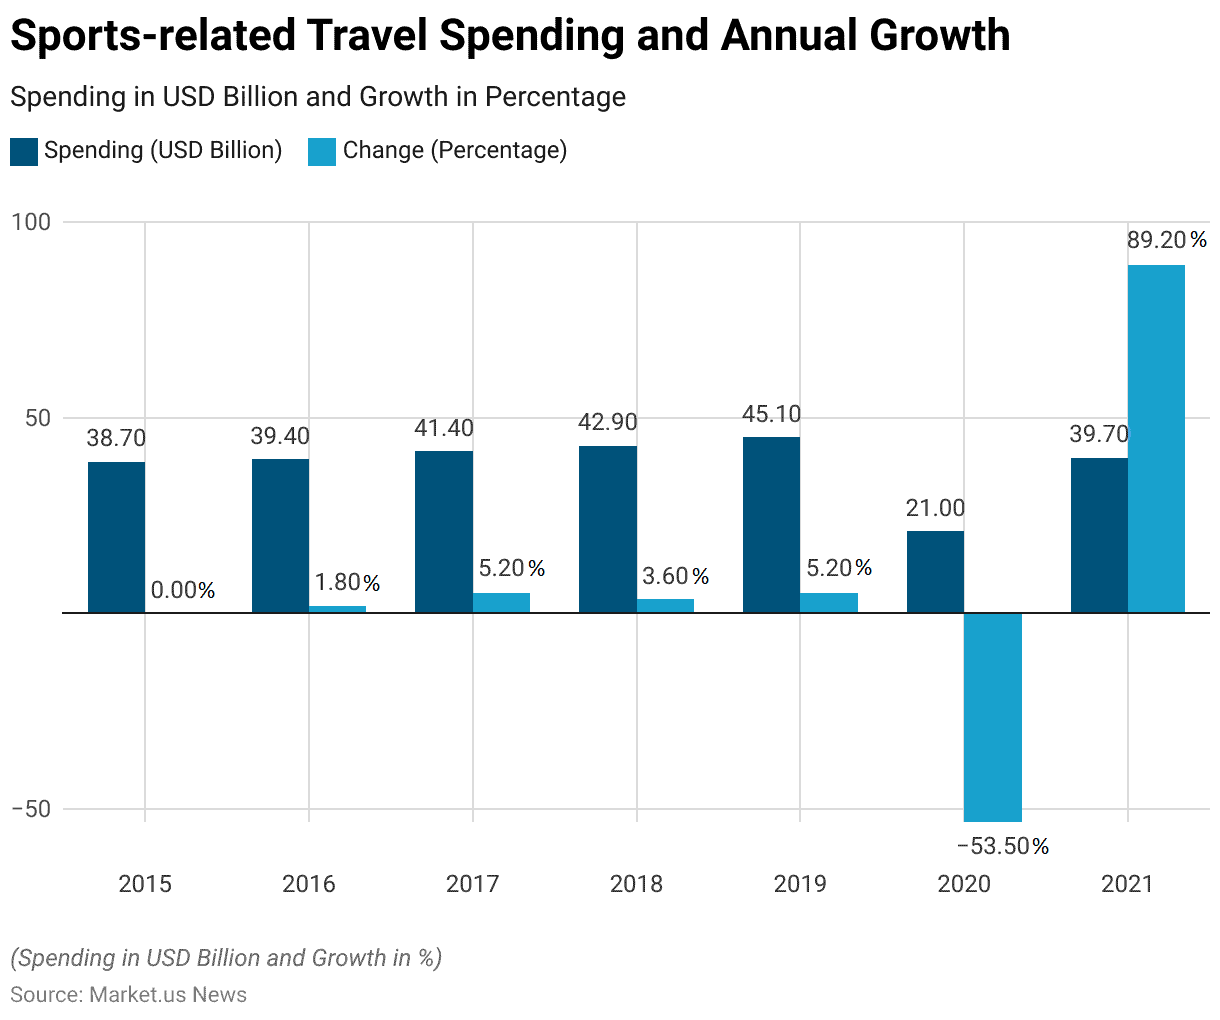
- The global sports-related travel spending has shown notable fluctuations over the period from 2015 to 2021.
- In 2015, the spending was USD 38.7 billion, with no change from the previous year.
- However, 2020 witnessed a dramatic downturn due to the global COVID-19 pandemic, which severely impacted travel and sports events worldwide.
- Despite this setback, 2021 saw a strong recovery. With spending rebounding to USD 39.7 billion, an impressive 89.20% increase from 2020.
Sports Tourism Funding Statistics
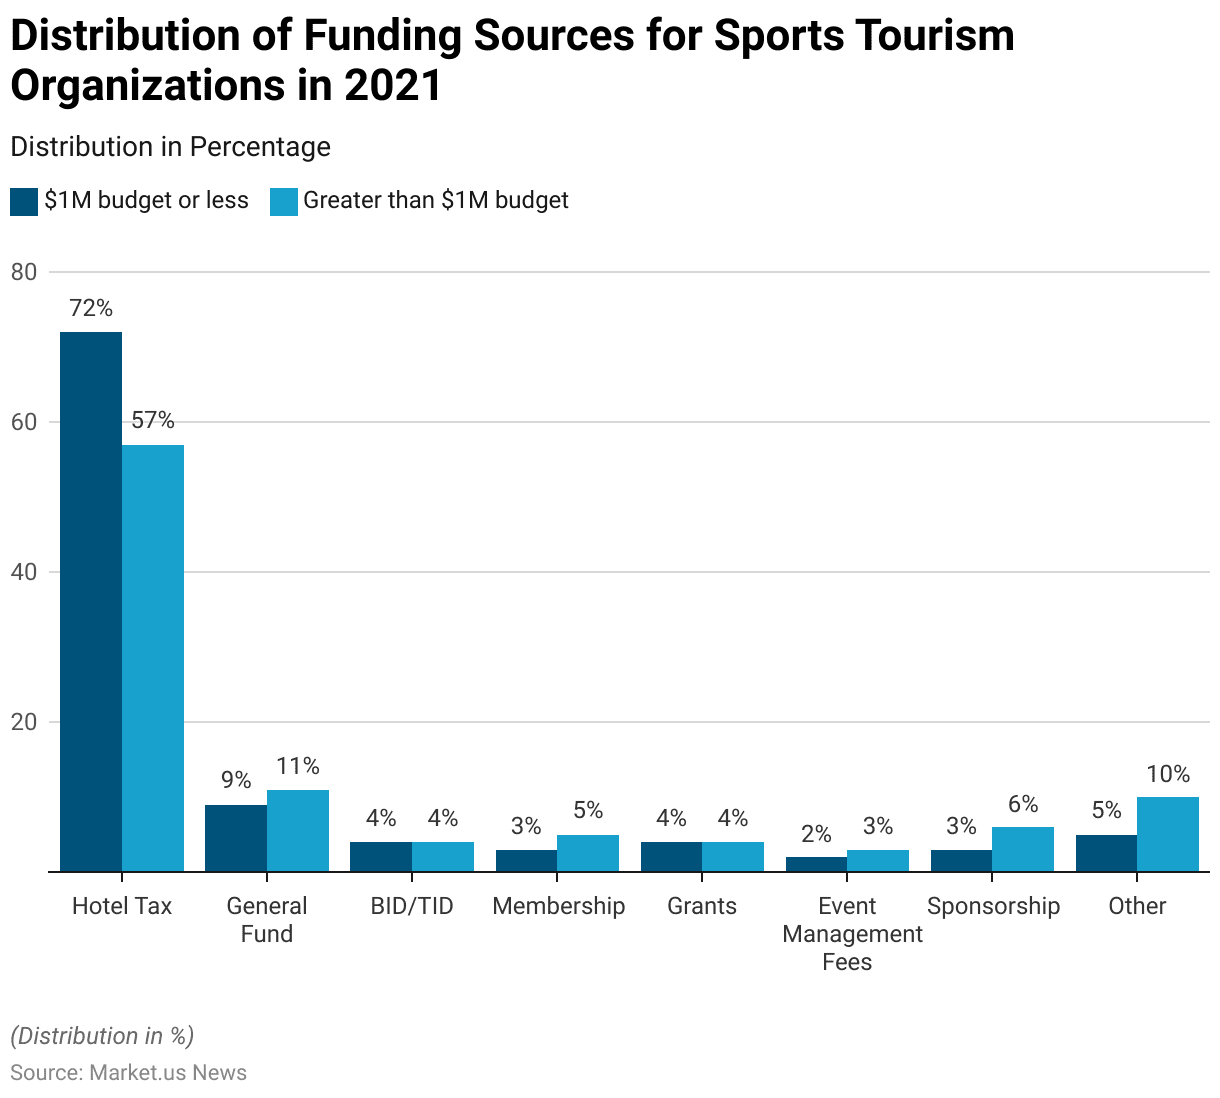
- In 2021, the funding sources for sports tourism organizations varied significantly based on the size of their budget.
- For destinations with a budget of $1 million or less. The primary funding source was the hotel tax, which accounted for 72% of their funding.
- This was followed by contributions from the general fund at 9%. BID/TID (Business Improvement District/Tourism Improvement District) contributions at 4%, and grants also at 4%.
- Membership fees contributed 3%, event management fees 2%, sponsorships 3%, and other sources 5%.
- In contrast, destinations with budgets exceeding $1 million relied less on hotel tax, which provided 57% of their funding.
- The general fund contributed slightly more at 11%, while BID/TID contributions remained constant at 4%.
- Membership fees accounted for 5%, grants at 4%, event management fees at 3%, sponsorships at 6%, and other sources at 10%.
Economic Impact of the Sports Tourism Sector
- The sports tourism sector’s direct expenditure of $39.7 billion leads to $22.0 billion in indirect spending and $30.1 billion in induced spending. Resulting in a total economic impact of $91.8 billion.
- Notably, while a significant share of sales occurs in industries directly serving travelers, the finance, insurance, and real estate (FIRE) sector benefits with $12.9 billion in sales.
- This is driven by tourism businesses like hotels and restaurants purchasing financial services and insurance from FIRE enterprises, termed as indirect sales.
- Furthermore, wages earned by FIRE sector employees due to sports tourism expenditures circulate back into the local economy through induced spending.
- Additionally, sectors such as business services ($9.6 billion) and manufacturing ($7.1 billion) also see substantial economic gains from sports tourism activities.
Regulations for Sports Tourism
- Regulations for sports tourism vary significantly across countries, aiming to ensure safety, promote sustainable practices, and enhance the overall experience for participants and spectators.
- In the United States, regulations often include stringent safety protocols for events, environmental protection measures, and visa requirements for international visitors.
- The European Union emphasizes the importance of sustainability and environmental protection. Countries like Germany and the Netherlands implementing strict guidelines to minimize ecological impact and promote responsible tourism practices.
- In Thailand, the government has focused on enhancing infrastructure and services to support sports tourism, including investments in health and wellness facilities to attract international sports tourists.
- The United Kingdom has implemented policies to support the development of local sports events and ensure the safety and security of participants and visitors.
Discuss your needs with our analyst
Please share your requirements with more details so our analyst can check if they can solve your problem(s)