

Table of Contents
- Introduction
- Editor’s Choice
- Prevalence of Undernourishment
- Severe Food Insecurity Rates Across Regions
- Top Countries with High Nominal Food Inflation
- Threshold Values for the Prevalence of Undernourishment
- Global Hunger Index Scores in Various Regions
- Food Security Prevalence During COVID-19
- Food Prices and Inflation Statistics
- Initiatives and Projects to Combat Food Security Concerns
Introduction
According to Food Security Statistics, Food security, vital for ensuring everyone has access to enough nutritious food, hinges on its availability, access, utilization, and stability.
Influenced by factors like economic growth, agriculture, market dynamics, governance, and environmental health, it’s a global priority tackled by organizations such as the FAO, WFP, and IFAD, along with governments and NGOs.
Efforts to improve food security are gauged using metrics like undernourishment prevalence, the FIES, and the GHI.
A holistic strategy is essential, focusing on boosting agricultural output, enhancing food distribution, ensuring diet quality, and building system resilience against disruptions.
Leveraging tech innovations and addressing root causes such as poverty and climate change are key steps towards global food security, which is crucial for health, economic progress, and social stability.
Editor’s Choice
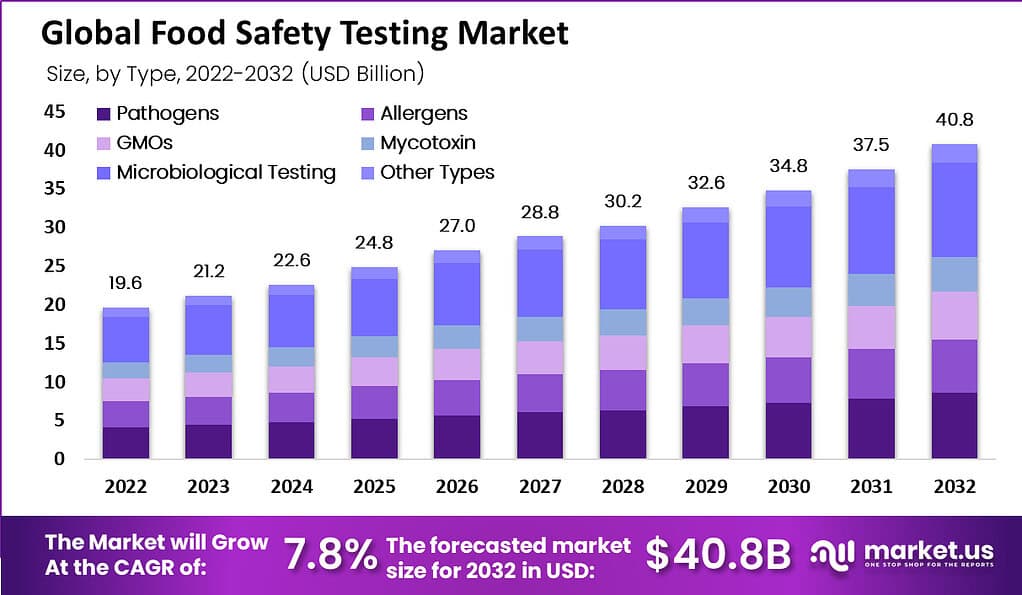
- The Global Food Safety Testing Market was valued at USD 19.6 Billion, this market is estimated to register the highest CAGR of 7.8% and is expected to reach USD 40.8 Billion during the forecast period of 2023 to 2032.
- In 2020, when the number of people undernourished escalated to 768 million, marking a prevalence rate of 9.9%.
- By 2020, global severe food insecurity escalated to 11.9%, with Africa bearing the brunt at 25.9%, followed by Latin America and the Caribbean at 14.2%, Asia at 10.2%, and Northern America and Europe at 1.4%.
- During the period from November 2023 to February 2024, Argentina topped the list with a staggering nominal food inflation rate of 303%.
- During the early stages of the COVID-19 pandemic, approximately 64.4% of respondents reported never experiencing food insecurity, indicating a majority had stable access to sufficient food.
- In January 2024, the Food Price Index, reflecting the fluctuating costs of essential food items, recorded a level of 118.
- In 2022, global freight rates increased by 1.73%, while grain prices rose by 1.95%.
- A $150 million grant has been allocated for the second phase of the Yemen Food Security Response and Resilience Project. This funding aims to tackle food insecurity, enhance resilience, and safeguard livelihoods.
Prevalence of Undernourishment
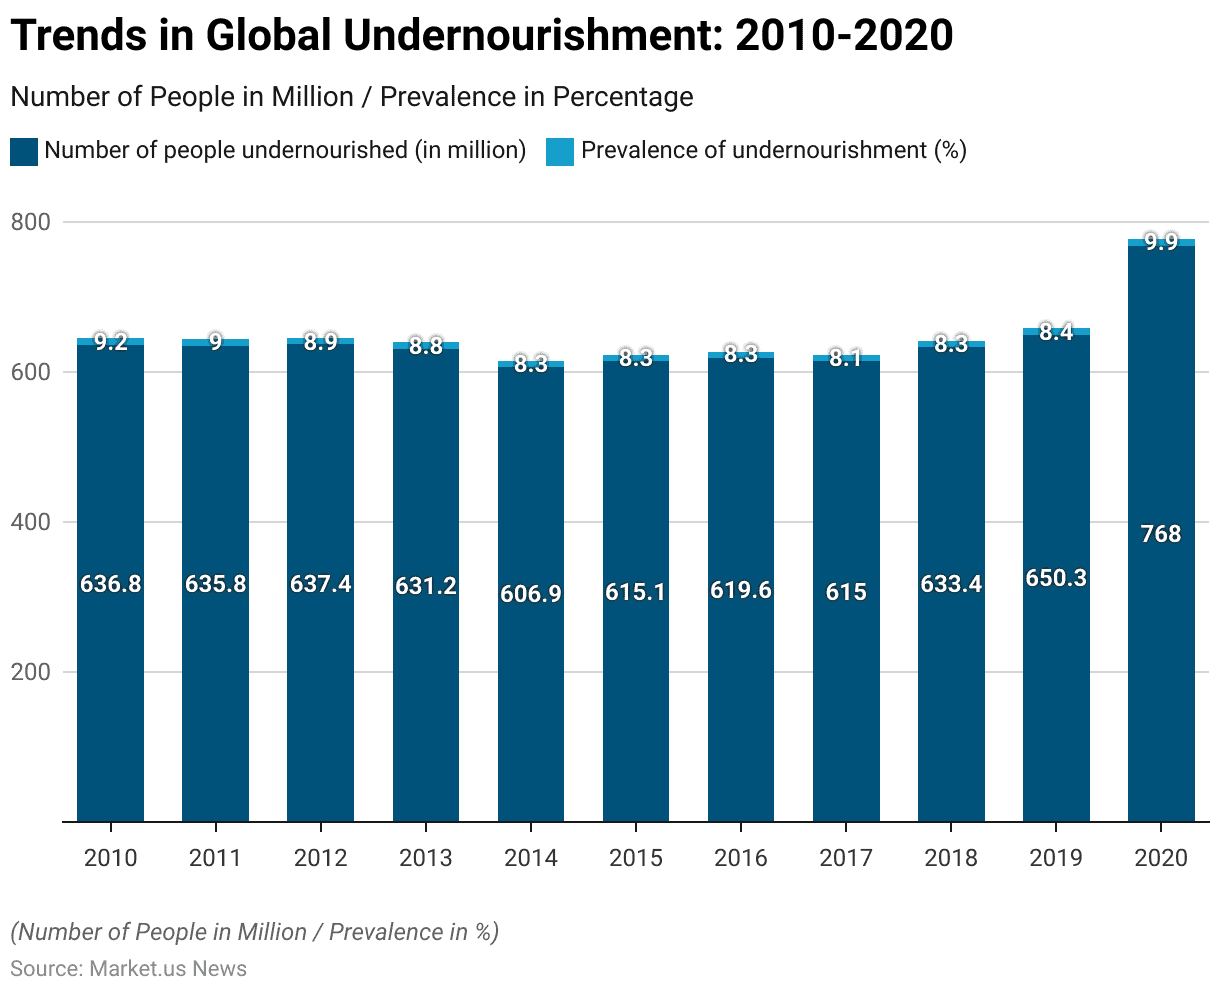
- Between 2010 and 2020, the global landscape of undernourishment witnessed fluctuating trends.
- In 2010, there were approximately 636.8 million people facing undernourishment, with a prevalence rate of 9.2%.
- This figure slightly decreased to 635.8 million (9.0%) in 2011 and continued to show minor variations over the next few years, reaching its lowest in 2014 at 606.9 million people (8.3%).
- Despite these fluctuations, the prevalence rate remained relatively stable at around 8.3% between 2014 and 2016.
- A significant surge occurred in 2020, when the number of people undernourished escalated to 768 million, marking a prevalence rate of 9.9%.
Severe Food Insecurity Rates Across Regions
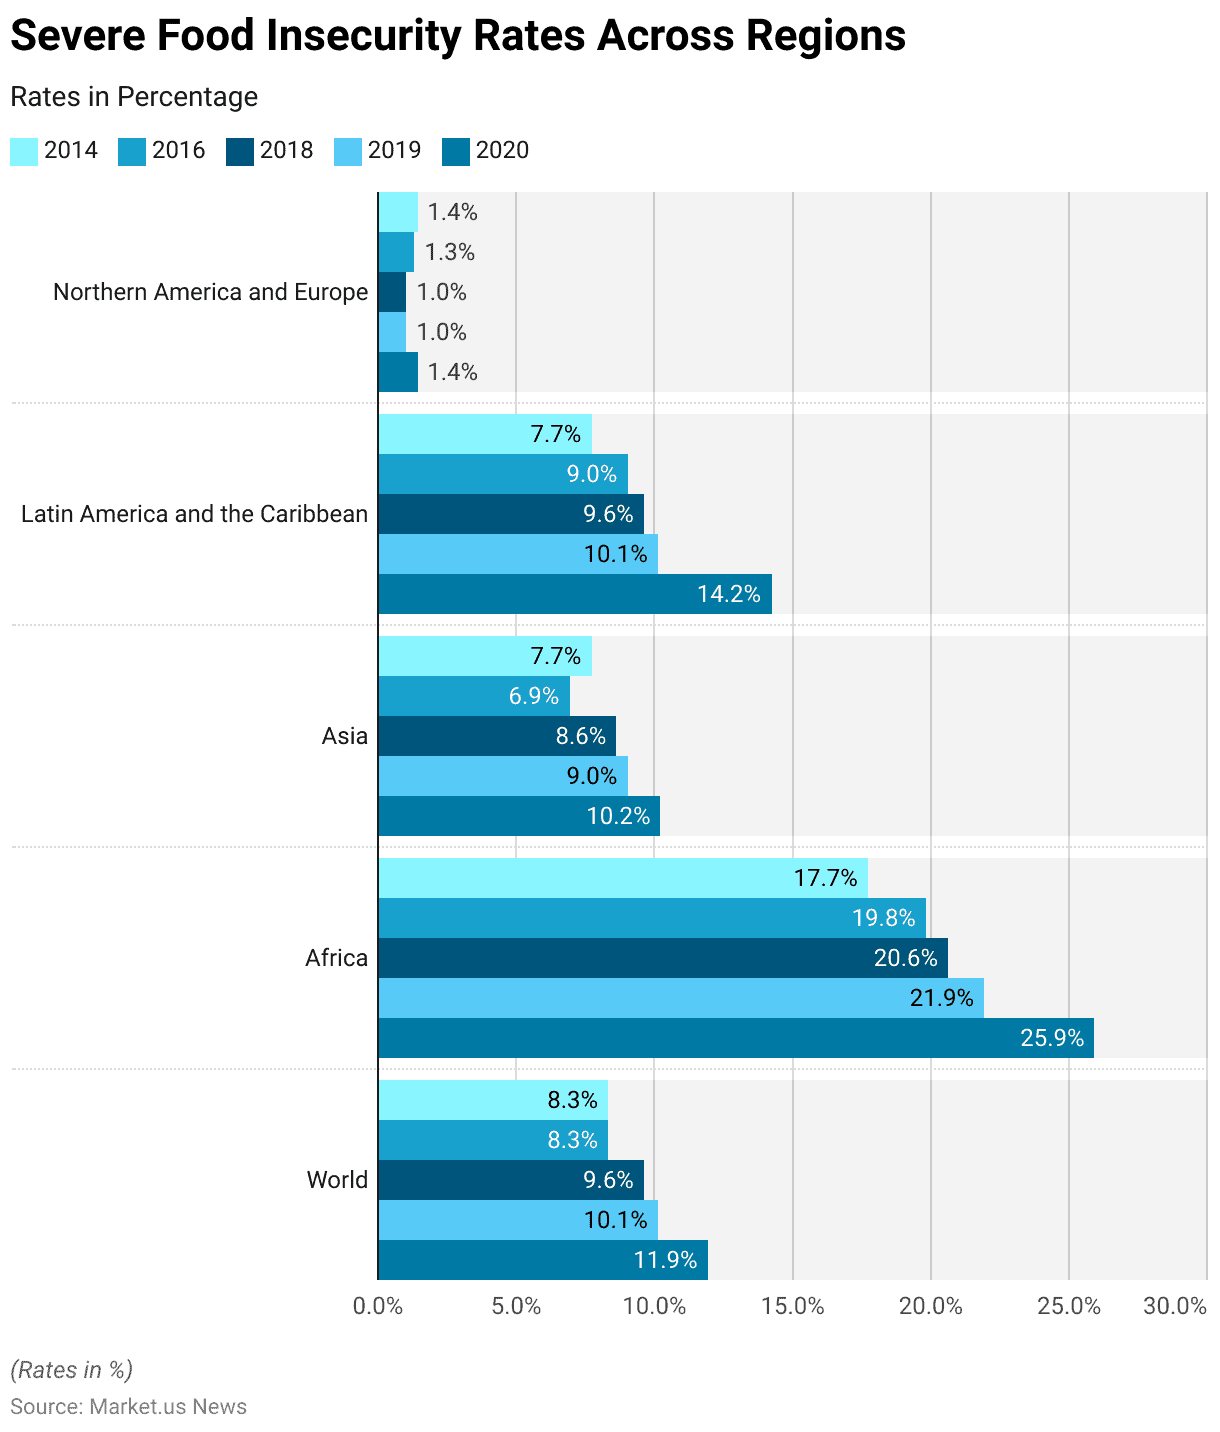
- Severe food insecurity rates varied across different regions over the years, with notable trends observed.
- In 2014, the global rate stood at 8.3%, with Africa experiencing the highest severity at 17.7%, followed by Asia, Latin America, and the Caribbean at 7.7% each. Northern America and Europe had the lowest rate at 1.4%.
- By 2016, the global rate remained steady at 8.3%, with Africa witnessing a significant increase to 19.8%. Asia, Latin America, and the Caribbean saw slight declines to 6.9% and 9%, respectively, and Northern America and Europe maintained a low rate of 1.3%.
- By 2020, global severe food insecurity escalated to 11.9%, with Africa bearing the brunt at 25.9%, followed by Latin America and the Caribbean at 14.2%, Asia at 10.2%, and Northern America and Europe at 1.4%.
Top Countries with High Nominal Food Inflation
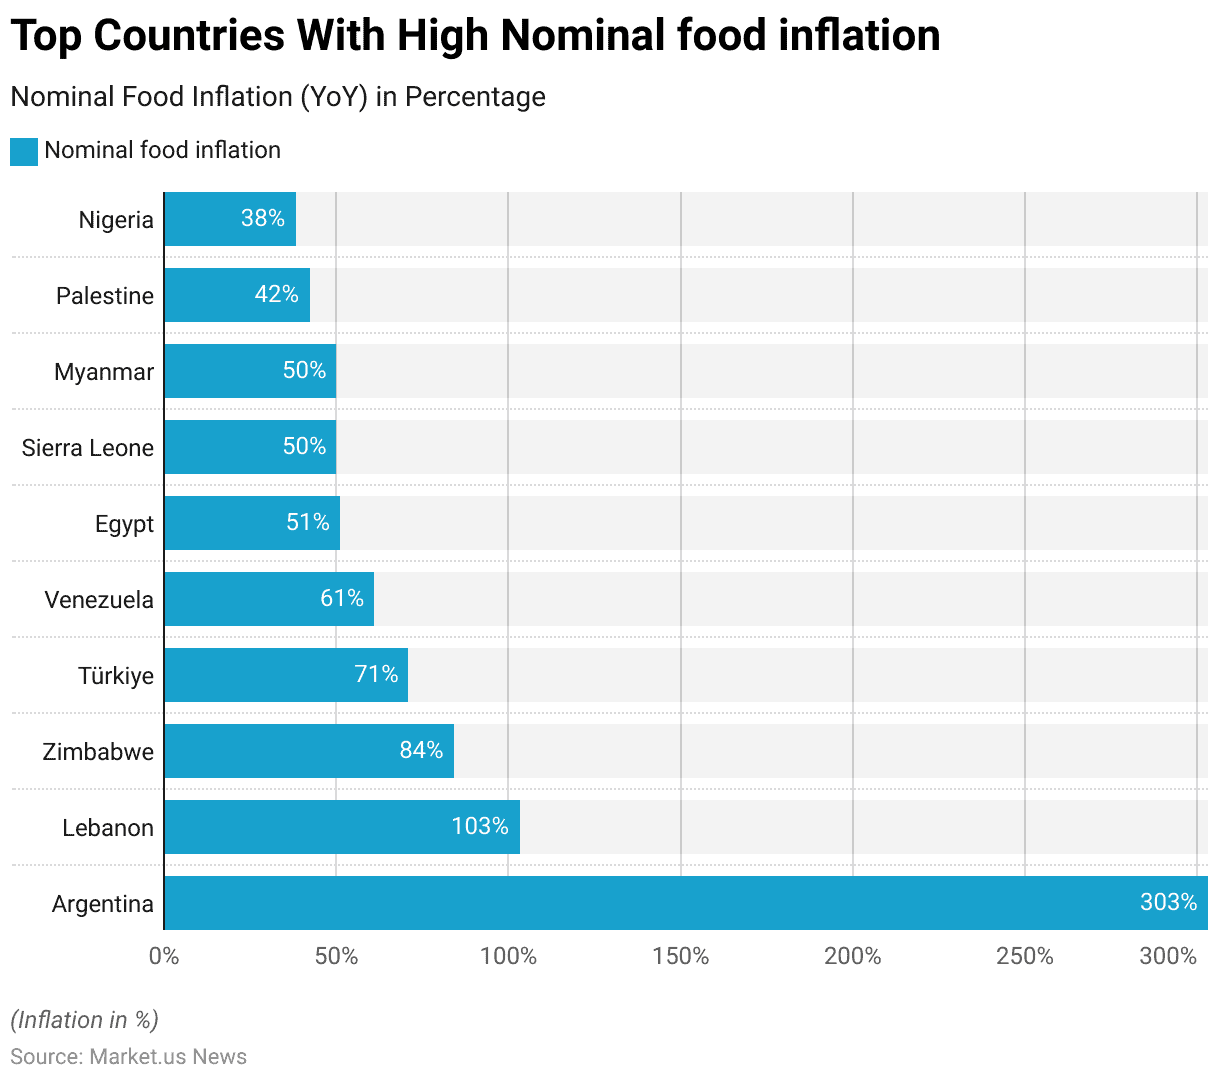
- During the period from November 2023 to February 2024, several countries experienced notable food price inflation, as reflected in their year-over-year percentage changes.
- Argentina topped the list with a staggering nominal food inflation rate of 303%, followed by Lebanon at 103% and Zimbabwe at 84%.
- Türkiye (Turkey) and Venezuela also faced significant inflationary pressures, with rates of 71% and 61% respectively.
- Egypt, Sierra Leone, and Myanmar witnessed moderate but still substantial inflation rates of 51%, 50%, and 50% respectively.
Threshold Values for the Prevalence of Undernourishment
- Threshold values for the prevalence of undernourishment and related indicators are categorized into five levels: Very low, Low, Medium, High, and Very high.
- In the category of undernourishment, prevalence rates below 5% are classified as Very low, while rates between 5% and less than 15% fall under the Low category.
- Prevalence rates ranging from 15% to less than 25% are categorized as Medium, those between 25% and less than 35% are considered High, and rates equal to or exceeding 35% are classified as Very high.
- Finally, very high prevalence rates are equal to or exceed 15% for wasting, 30% for stunting, and 10% for mortality.
Global Hunger Index Scores in Various Regions
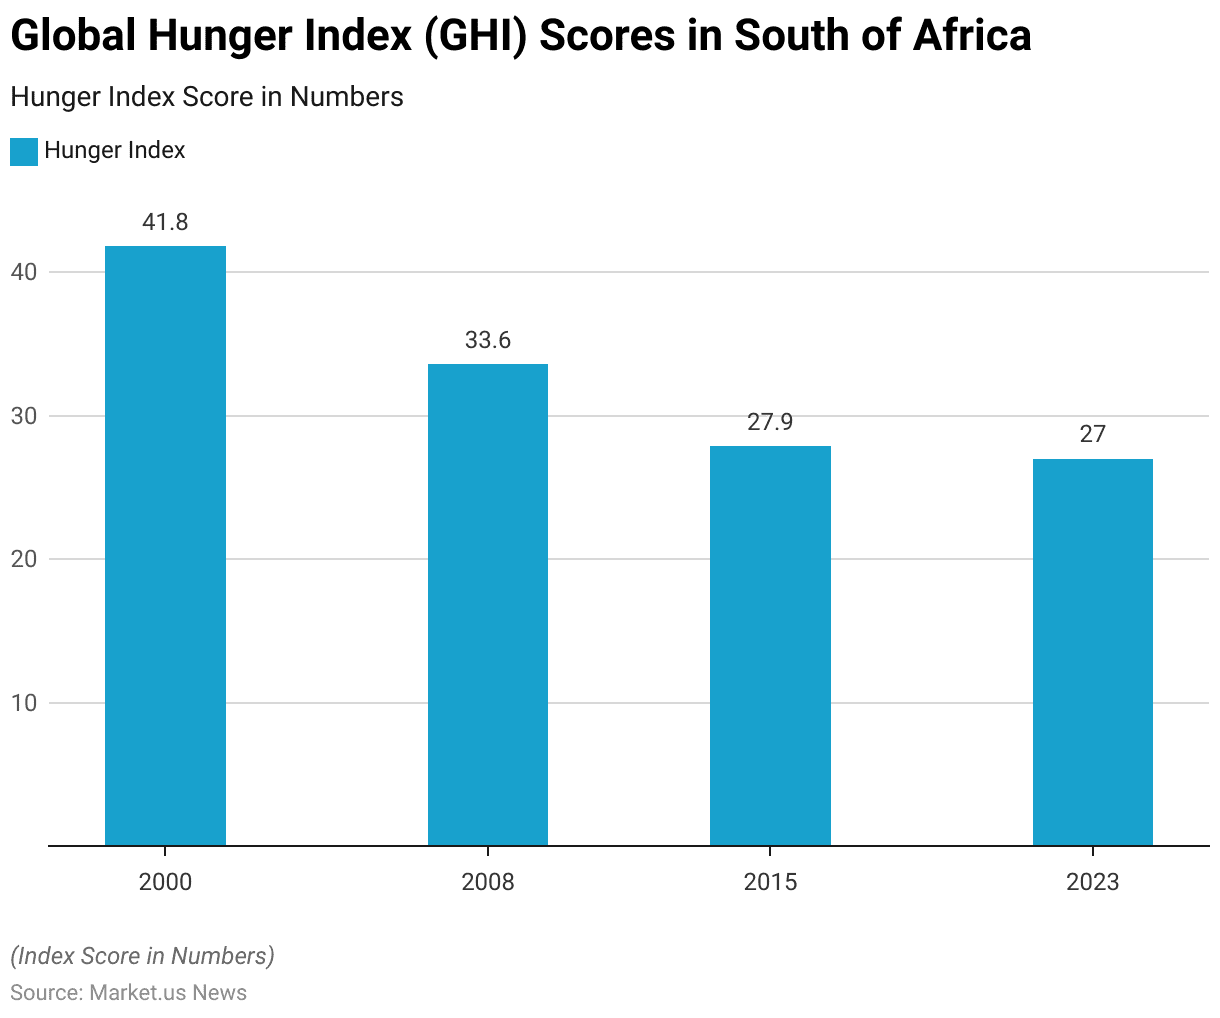
South of Africa
- In 2000, the GHI score stood at 41.8, indicating significant challenges related to hunger prevalent across various nations in southern Africa.
- However, by 2008, there was a marked improvement, with the score declining to 33.6, signaling progress in combating hunger and its associated impacts.
- Notably, by 2023, the GHI score reached 27.0, underscoring sustained progress and a steadfast commitment to enhancing food security and nutrition outcomes in the southern part of the African continent.
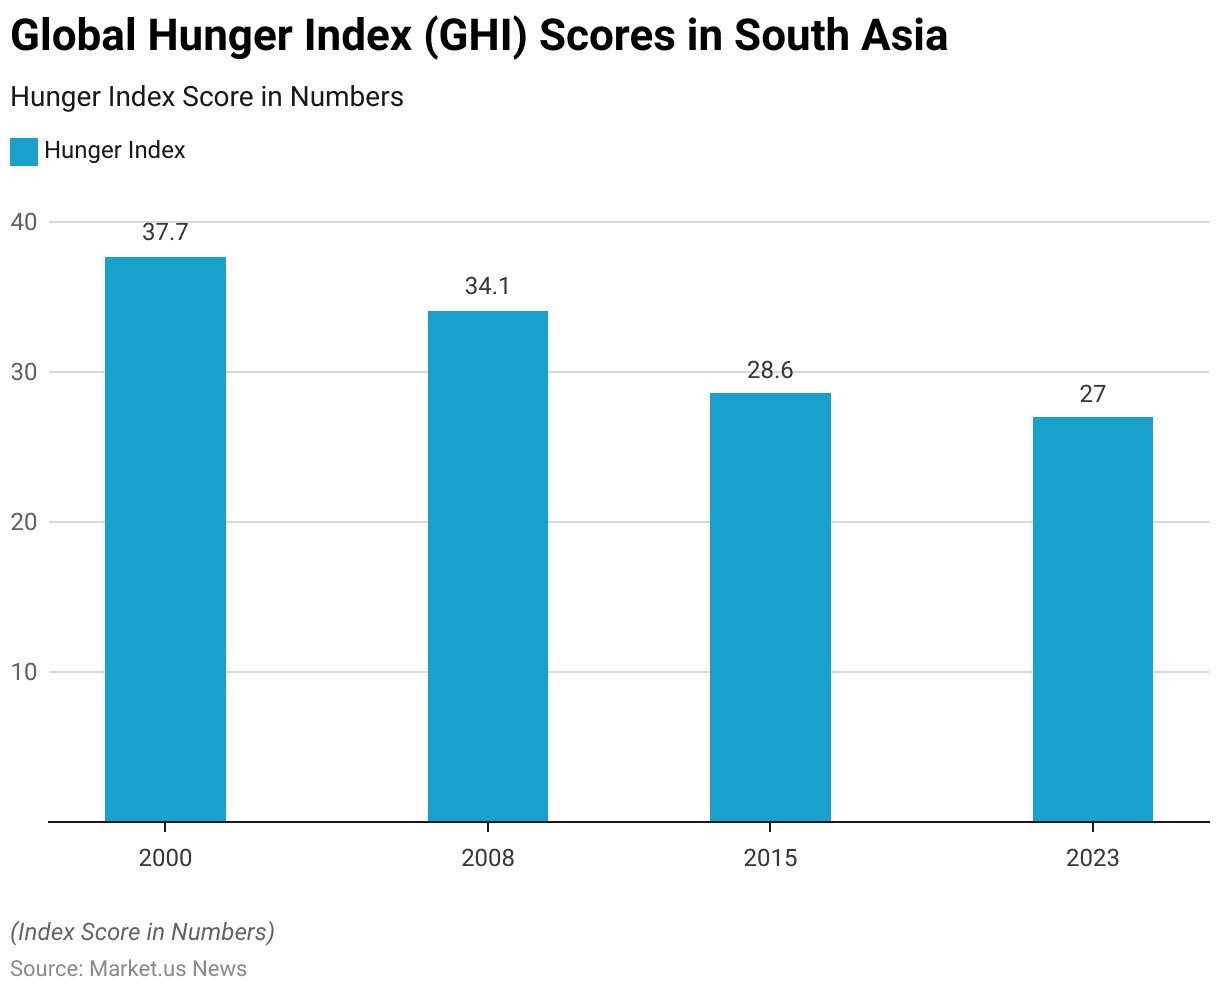
South Asia
- In 2000, the GHI score was recorded at 37.7, indicating significant challenges related to hunger prevalent across South Asian nations.
- However, by 2008, there was a notable improvement, with the score decreasing to 34.1, signifying progress in combating hunger and its associated impacts.
- By 2023, the GHI score reached 27.0, underscoring continued advancements and a steadfast commitment to addressing hunger and promoting sustainable development throughout South Asia.
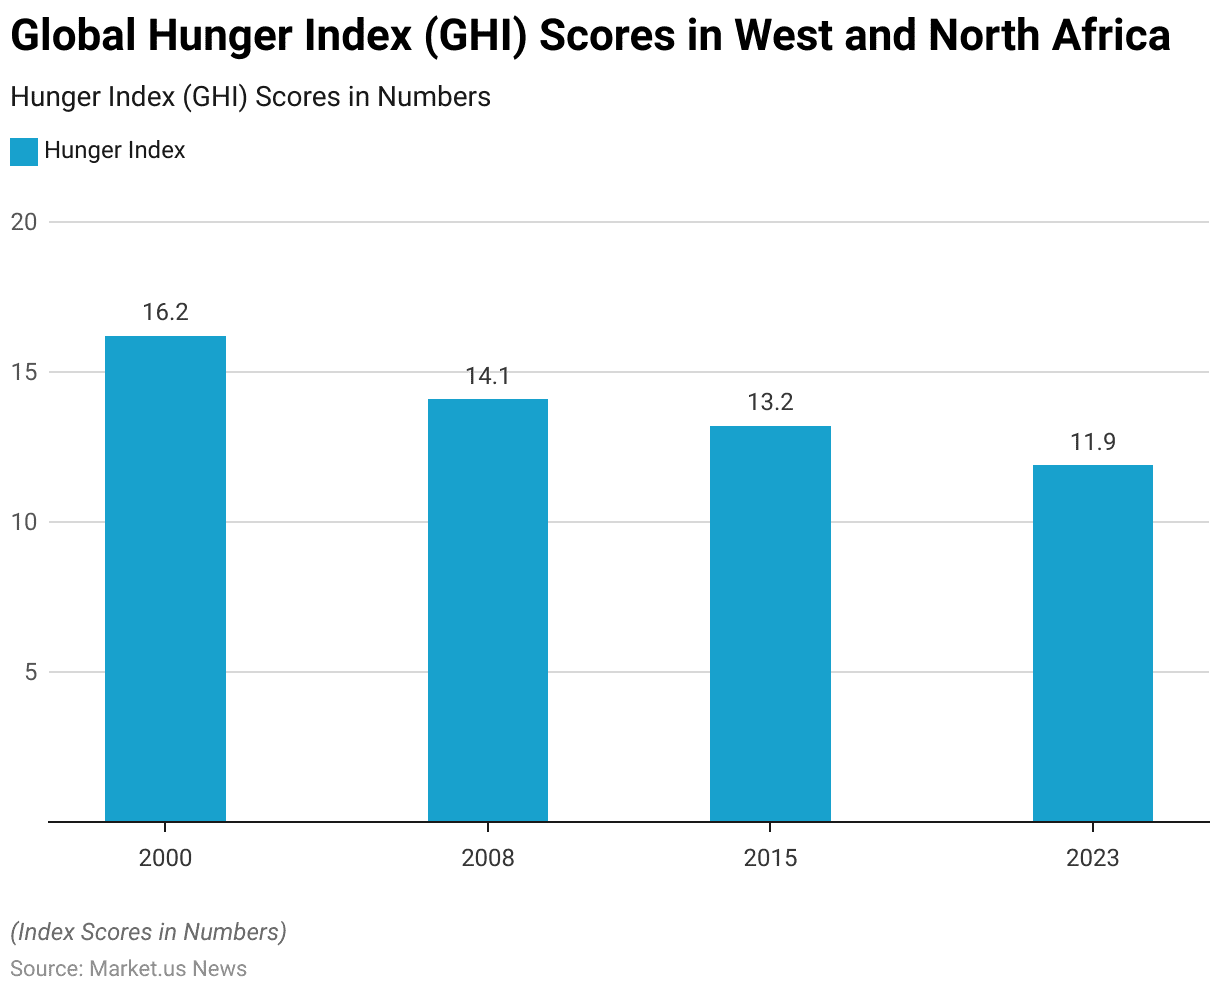
West and North Africa
- In 2000, the GHI score was notably low at 16.2, reflecting comparatively lower levels of hunger prevalent across various nations in West and North Africa.
- Over subsequent years, this positive trend continued, with the GHI score declining to 13.2 in 2015, showcasing sustained momentum in alleviating hunger and improving nutritional outcomes.
- By 2023, the GHI score reached 11.9, highlighting continued progress and a steadfast commitment to enhancing food security and livelihoods within West and North Africa.
Food Security Prevalence During COVID-19
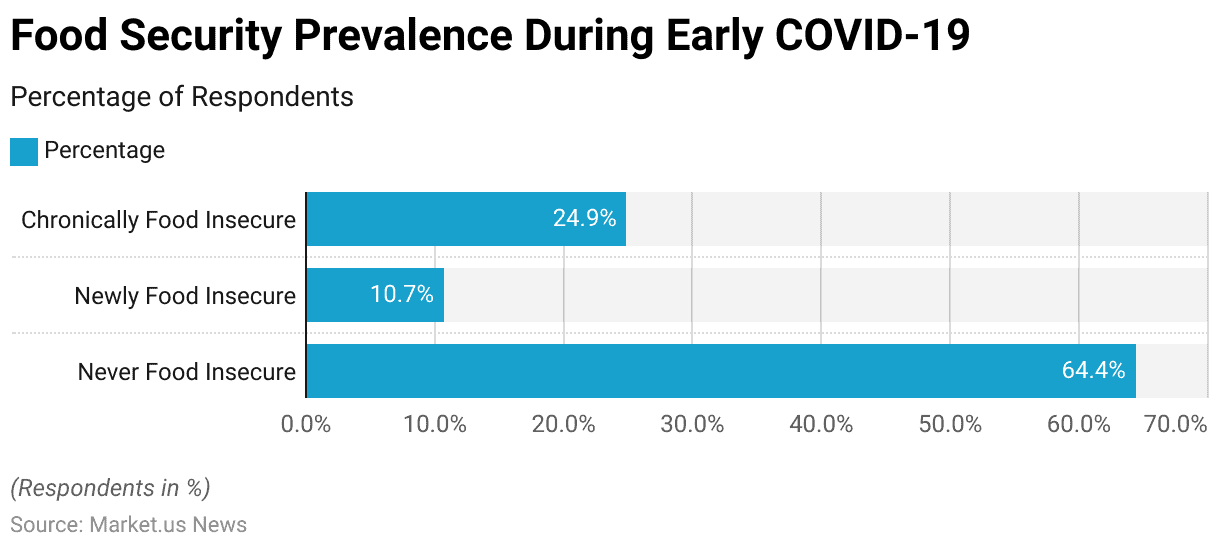
Food Security Prevalence During Early COVID-19
- During the early stages of the COVID-19 pandemic, a study on food security status among respondents revealed significant insights.
- Approximately 64.4% of respondents reported never experiencing food insecurity, indicating a majority had stable access to sufficient food.
- However, the pandemic introduced new challenges, as evidenced by 10.7% of respondents who became newly food insecure, facing difficulties in accessing food for the first time due to the crisis.
- Additionally, 24.9% of participants were identified as chronically food insecure, suggesting they had faced ongoing challenges with food access even before the pandemic began.
Security Prevalence During Various Stages of COVID-19
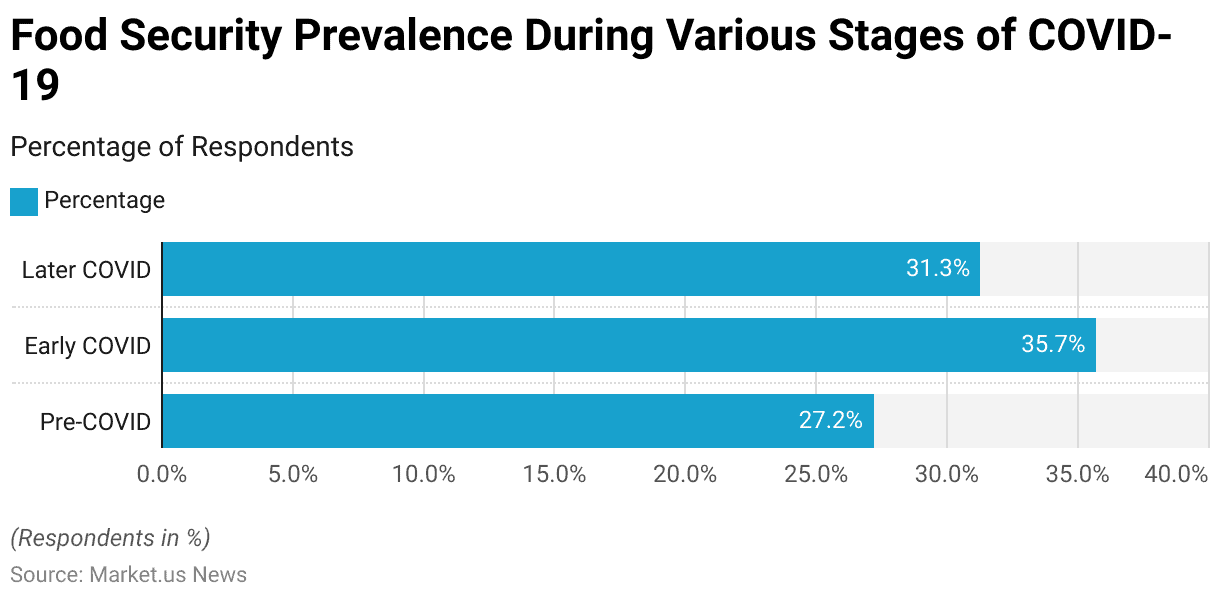
- The prevalence of food insecurity among respondents evolved through various stages of the COVID-19 pandemic, revealing a dynamic impact on access to sufficient food.
- Before the pandemic (Pre-COVID), 27.2% of respondents reported experiencing food insecurity, highlighting pre-existing challenges within communities.
- As the pandemic unfolded during its early stages, the rate of food insecurity significantly increased to 35.7%, reflecting the immediate disruptions in food supply chains, economic downturns, and access issues that exacerbated the situation for many individuals.
- However, as the pandemic progressed into later stages, a slight decrease in food insecurity was observed, with 31.3% of respondents still reporting issues of access to adequate food.
Food Prices and Inflation Statistics
Monthly Food Price Index
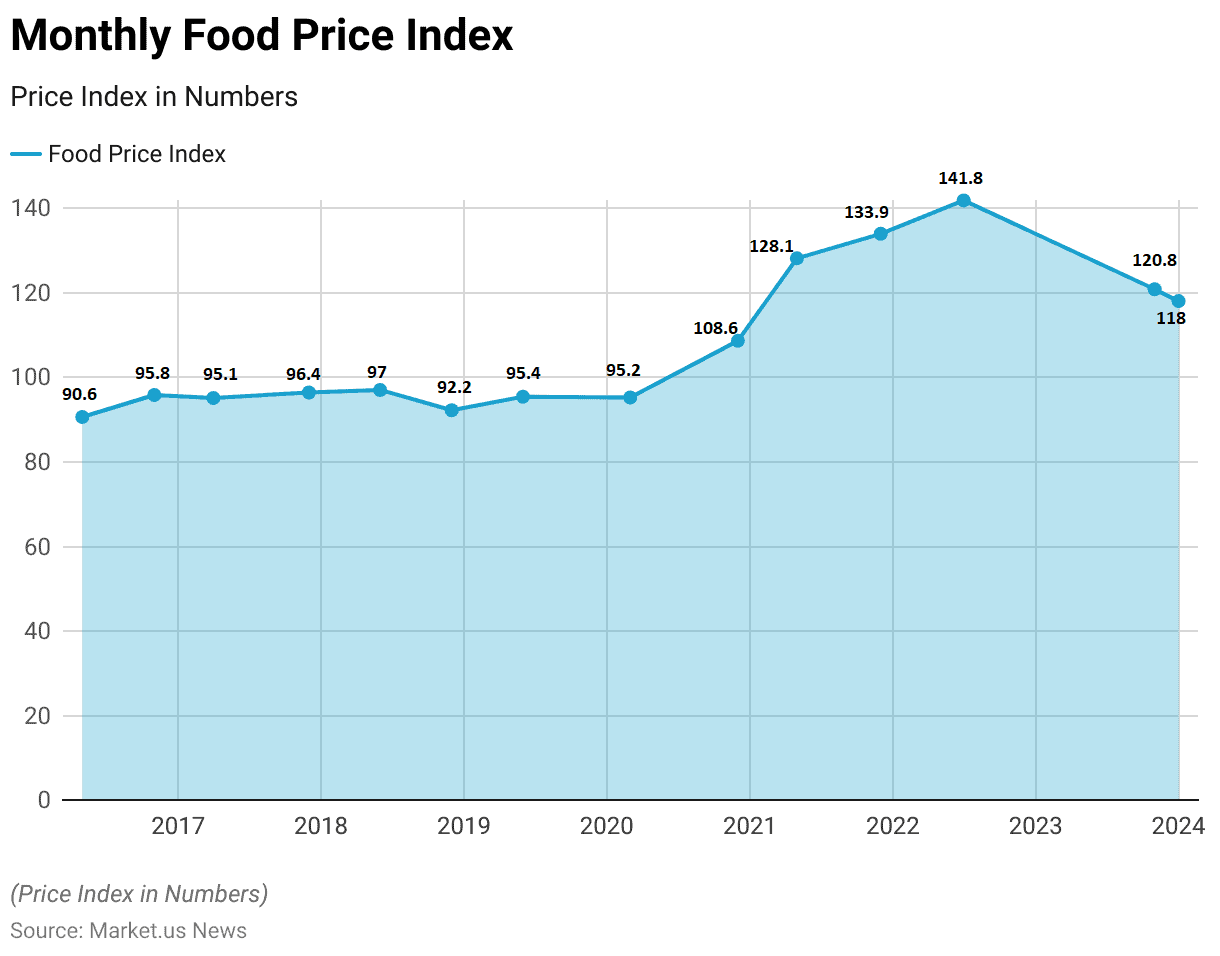
- The Food Price Index, reflecting the fluctuating costs of essential food items, has witnessed varied trends over the analyzed period.
- Beginning in May 2016 at a level of 90.6, the index demonstrated a gradual increase, reaching 95.8 by November 2016.
- This upward trajectory continued into 2021, with May recording a notable surge to 128.1 and December reaching a pinnacle of 133.9. However, by July 2022, the index showed signs of moderation, stabilizing at 141.8.
- Subsequent months witnessed a decline, with November 2023 registering 120.8 and January 2024 recording a level of 118.
Annual Food Price Index Worldwide- By Category
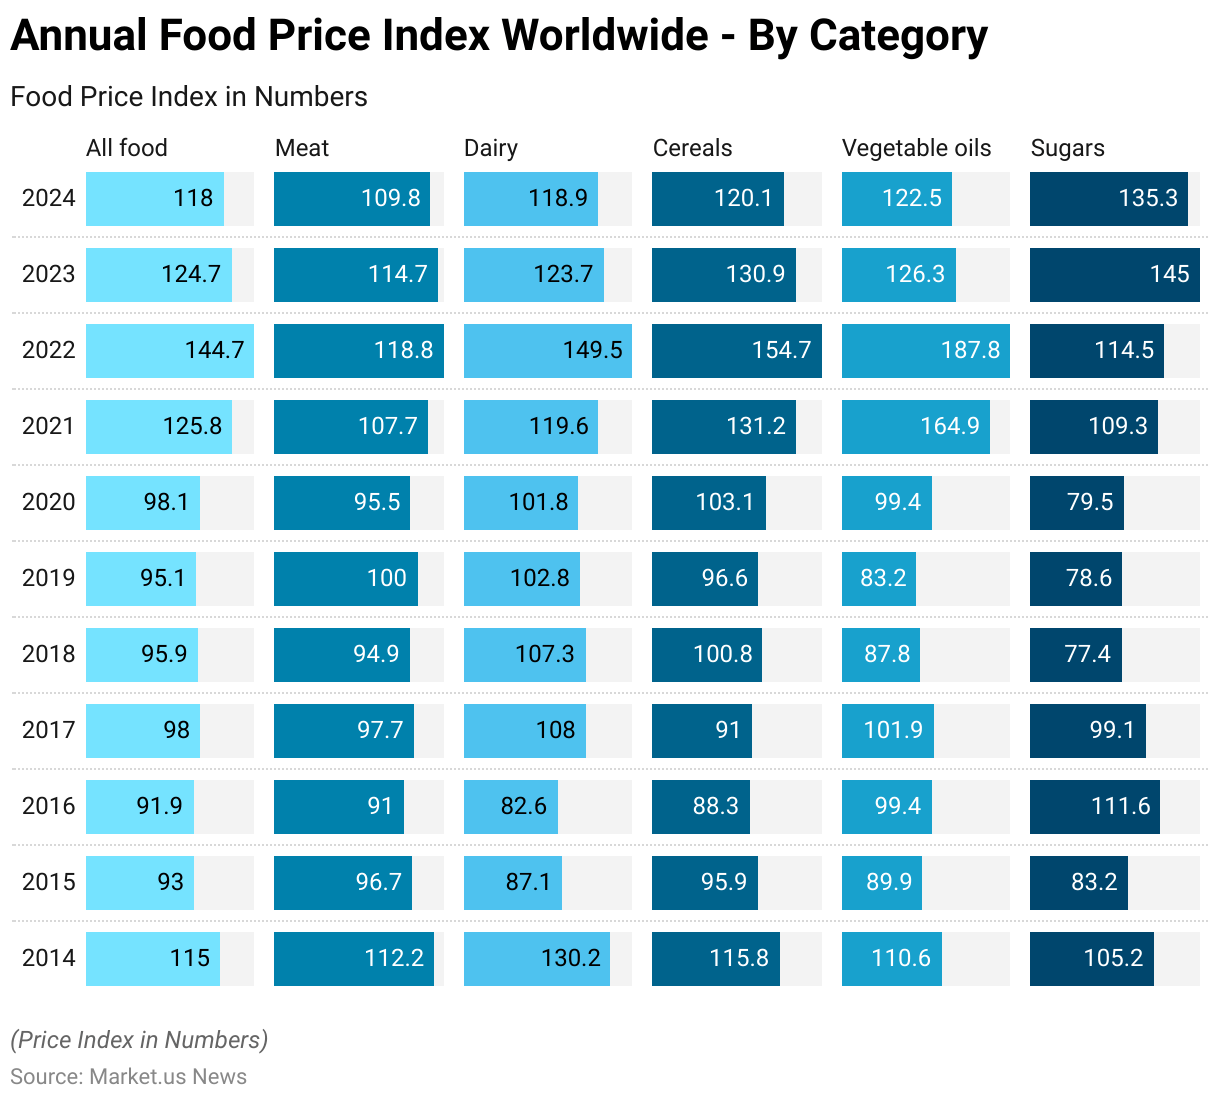
- The annual food price index worldwide, categorized by various food types, illustrates significant fluctuations from 2014 to 2024.
- Overall, the index for all food items stood at 115 in 2014, experiencing a decline to 93 in 2015 before stabilizing at 91.9 in 2016.
- Subsequent years witnessed fluctuations, with a peak of 144.7 recorded in 2022, followed by a decline to 118 in 2024.
- Among specific categories, meat prices started at 112.2 in 2014, fluctuating over the years and ending at 109.8 in 2024.
- Dairy products saw fluctuations, with a peak of 149.5 in 2022 and a slight decline to 118.9 in 2024.
- Cereal prices followed a similar pattern, reaching a peak of 154.7 in 2022 before descending to 120.1 in 2024.
Impact of Grain Prices and Shipping Costs on Food Prices – By Country Income Group
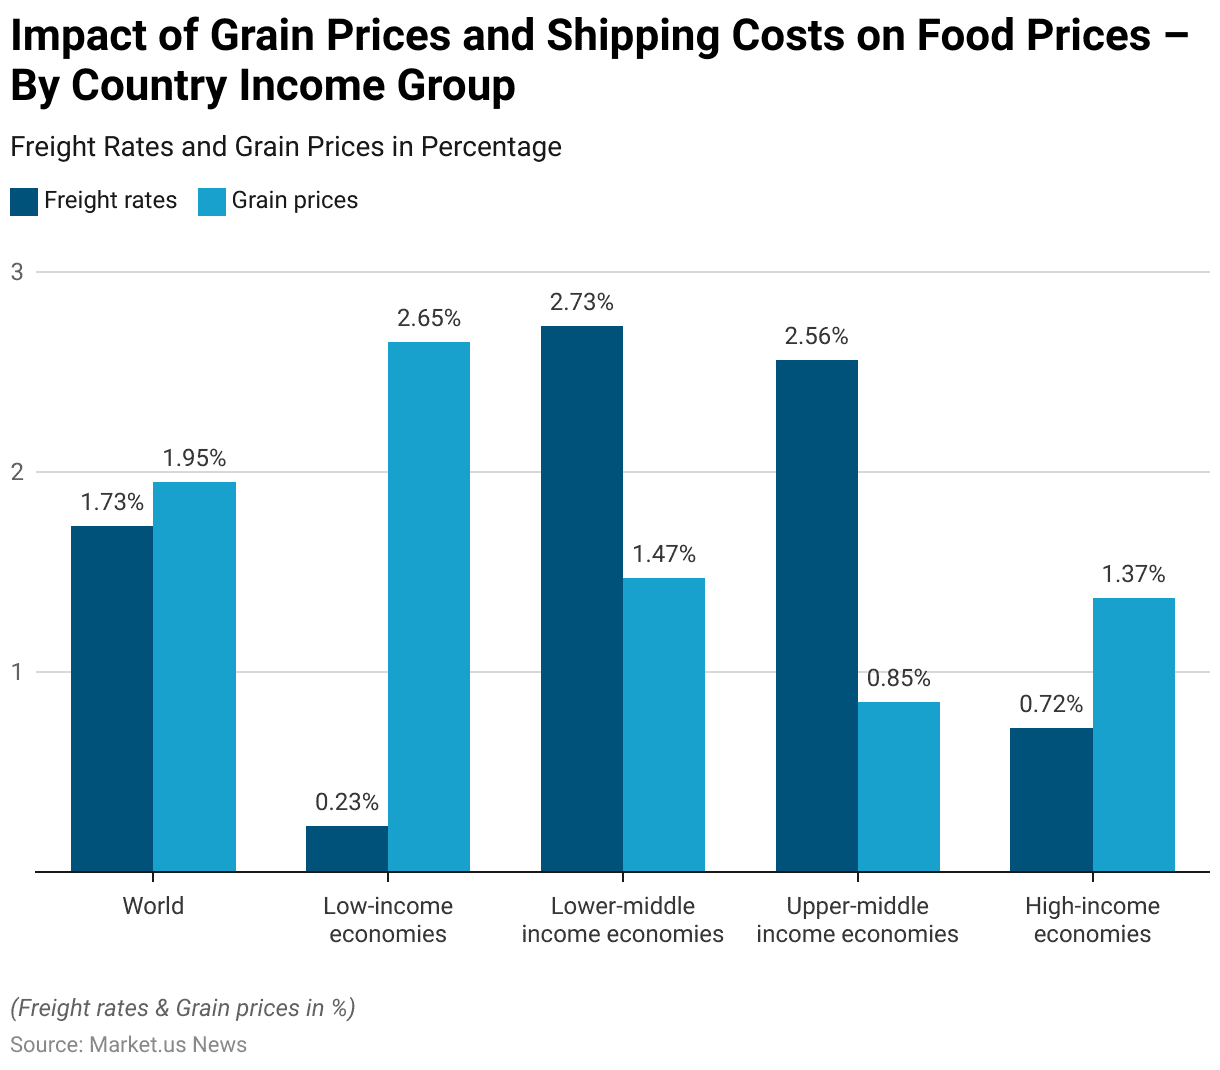
- In 2022, global food prices were significantly influenced by fluctuations in grain prices and shipping costs, varying across country income groups. Worldwide, freight rates increased by 1.73%, while grain prices rose by 1.95%.
- Low-income economies experienced a relatively lower impact from shipping costs, with an increase of only 0.23%, but faced a substantial rise in grain prices at 2.65%.
- In contrast, lower-middle-income economies encountered a significant surge in freight rates at 2.73%, coupled with a more moderate increase in grain prices at 1.47%.
- Similarly, upper-middle-income economies saw a notable rise in shipping costs at 2.56% yet benefited from a relatively lower increase in grain prices at 0.85%.
- High-income economies, on the other hand, experienced a comparatively modest impact from both freight rates, which increased by 0.72%, and grain prices, which rose by 1.37%.
Initiatives and Projects to Combat Food Security Concerns
- IDA has given $95 million to support Malawi’s Agriculture Commercialization Project (AGCOM), focusing on boosting the commercialization of specific agriculture products and aiding quick responses to crises.
- A $60 million credit has been allocated for the Integrated Community Development Project in four northern provinces of Burundi.
- A $150 million grant has been allocated for the second phase of the Yemen Food Security Response and Resilience Project.
Discuss your needs with our analyst
Please share your requirements with more details so our analyst can check if they can solve your problem(s)