

Table of Contents
- Introduction
- Editor’s Choice
- Global Dropshipping Market Overview
- Number of Digital Buyers Worldwide
- Main Dropshipping Product Categories Statistics
- Global Dropshipping Sales Statistics
- Global Dropshipping Statistics – By Store Niche
- eCommerce Usage Distribution in Sites
- Demographics of Dropshipping Consumers Statistics
- Retailer vs. Dropshipping Statistics
- Social Media Usage for Dropshipping Statistics
- Dropshipping Revenue & Profit Statistics
- Top Challenges Faced by Dropshipping Businesses Statistics
- Recent Developments
- Conclusion
- FAQs
Introduction
Dropshipping Statistics: Dropshipping is a retail fulfillment method where sellers partner with suppliers to offer products without keeping inventory.
Sellers set up online stores, forwarding customer orders to suppliers who handle order processing and shipping directly to customers.
This model enables flexibility in product selection and eliminates the need for inventory management. Sellers earn profit by marking up product prices.
While dropshipping simplifies inventory logistics, it presents challenges such as maintaining supplier relationships and ensuring customer satisfaction.
Despite this, it offers a low-cost entry into e-commerce, requiring strategic marketing and efficient operations for success.
Editor’s Choice
- The global dropshipping market has demonstrated significant growth at a CAGR of 25.10%.
- By 2023, total market revenue increased to $286.4 billion, with corresponding growth in each category: product reselling rose to $119.43 billion, and print on demand to $75.61 billion. Creation of the product to $56.13 billion, and business extensions to $35.23 billion.
- Electronics and Media dominate the market with a substantial 34% share. Reflecting the high demand for consumer electronics, gadgets, and media products through online platforms.
- In 2023, the number of digital buyers surged to 2.64 billion, indicating a robust expansion in global e-commerce activity.
- Projections for the coming years suggest a continued upward trajectory. With dropshipping sales expected to reach $7,385 billion by 2025.
- Apparel leads as the most prominent niche, accounting for 26.00% of the top-performing dropshipping stores. Reflecting the high consumer interest in fashion and clothing items.
- Gen Z leads with a significant 38% share, highlighting their strong presence and active involvement in digital activities.
Global Dropshipping Market Overview
Global Dropshipping Market Size Statistics
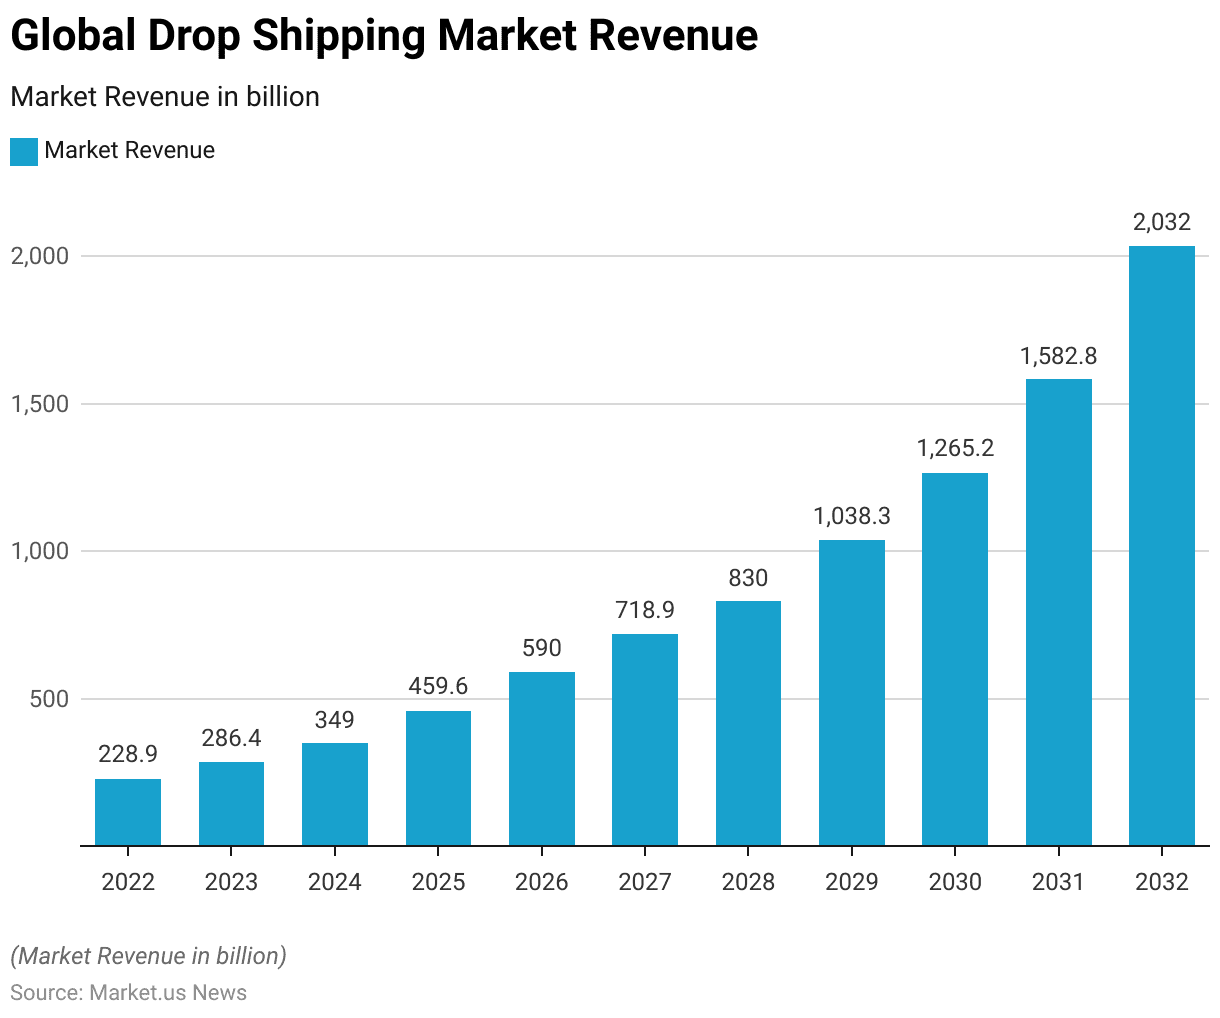
- The global dropshipping market has demonstrated significant growth over the past decade and is projected to continue this trajectory well into the next decade at a CAGR of 25.10%.
- In 2022, the market revenue was recorded at $228.9 billion. This figure rose to $286.4 billion in 2023, indicating a robust growth pattern.
- The market is expected to continue expanding, with revenue projected to reach $349.0 billion in 2024 and $459.6 billion in 2025.
- By 2026, revenue is anticipated to escalate to $590.0 billion, followed by $718.9 billion in 2027.
- The upward trend is expected to persist, with market revenue forecasted to hit $830.0 billion in 2028, soar to $1,038.3 billion by 2029, and then to $1,265.2 billion by 2030.
- The projections for 2031 and 2032 are even more optimistic. With revenues expected to reach $1,582.8 billion and $2,032.0 billion, respectively.
- This sustained growth trajectory underscores the increasing reliance on and popularity of the dropshipping business model in the global e-commerce sector.
(Source: market.us)
Global Dropshipping Market Size – By Type
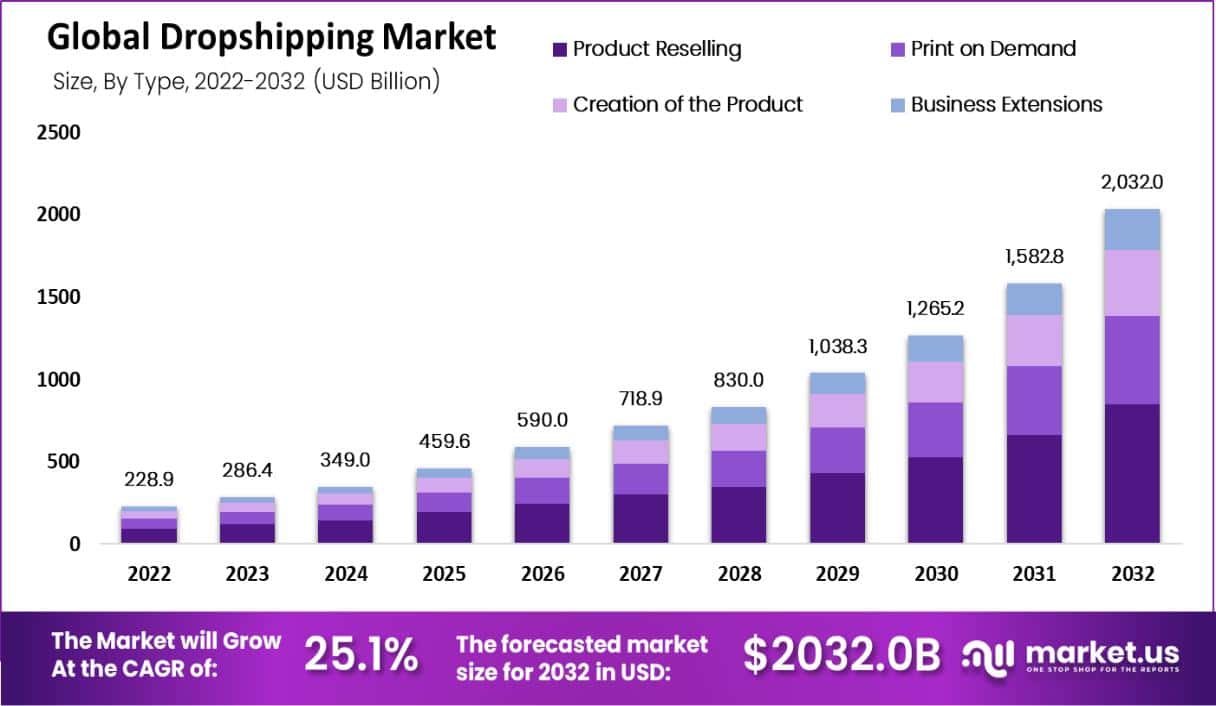
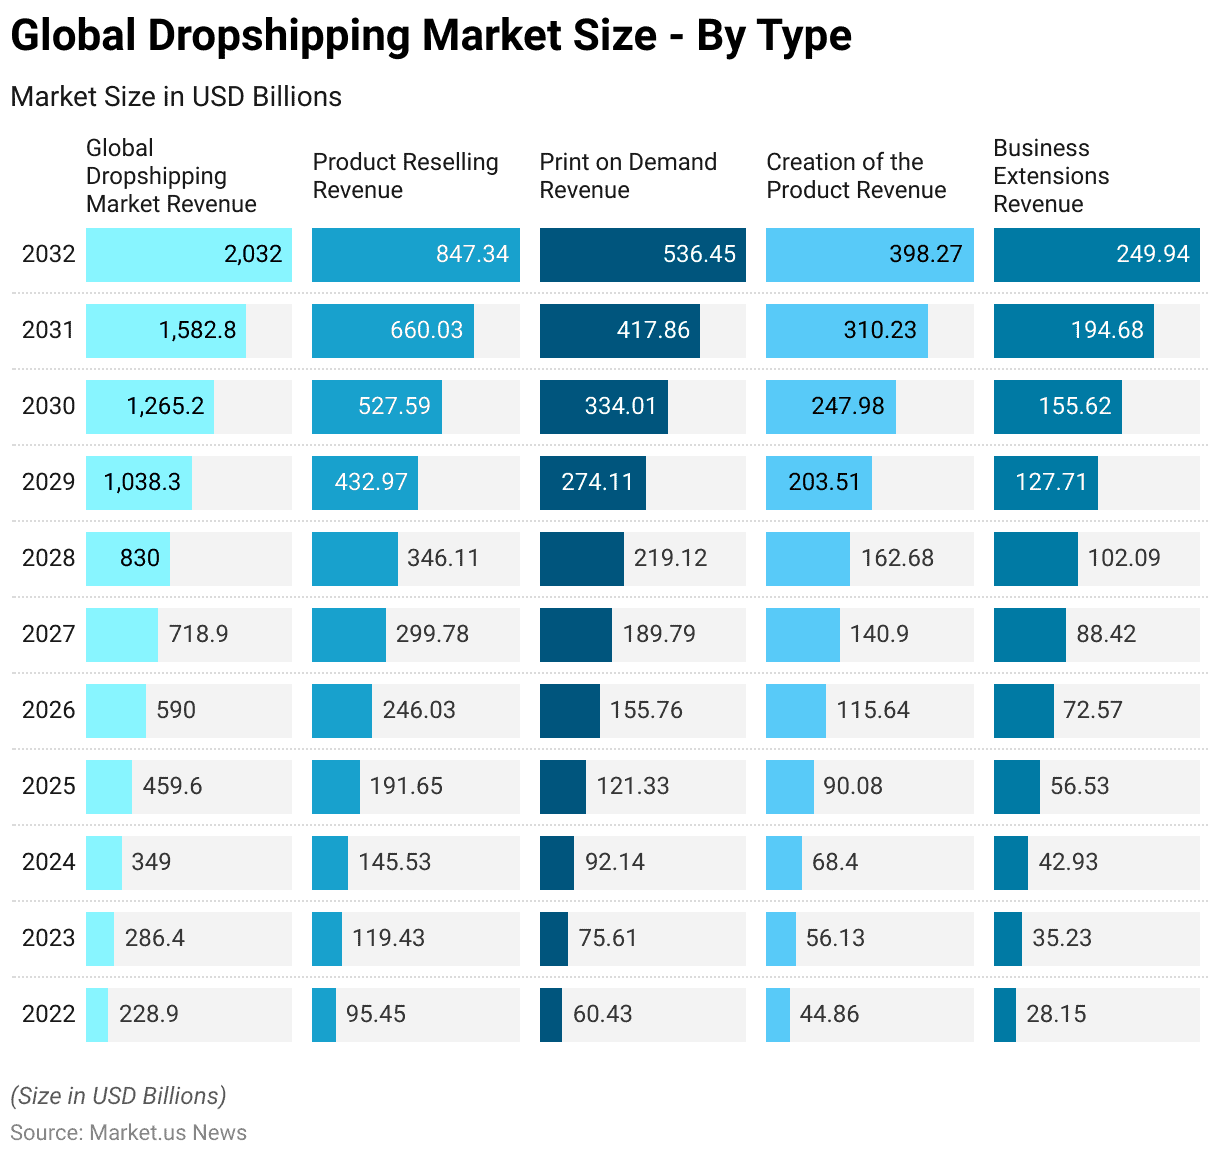
- The global dropshipping market has exhibited substantial growth across various segments over the past decade, and this trend is expected to continue.
- In 2022, the total market revenue was $228.9 billion, distributed among different types of dropshipping: product reselling accounted for $95.45 billion, print on demand generated $60.43 billion, creation of the product contributed $44.86 billion, and business extensions brought in $28.15 billion.
- By 2023, total market revenue increased to $286.4 billion, with corresponding growth in each category: product reselling rose to $119.43 billion, print on demand to $75.61 billion, creation of the product to $56.13 billion, and business extensions to $35.23 billion.
- This upward trajectory continued into 2024, with the market expanding to $349.0 billion. Further subdivided into product reselling at $145.53 billion, print on demand at $92.14 billion, creation of the product at $68.40 billion, and business extensions at $42.93 billion.
- The growth persisted robustly through 2025 to 2032. Culminating in a staggering total market size of $2,032.0 billion in 2032.
- By then, revenues were notably divided as follows: product reselling achieved $847.34 billion, and print on demand reached $536.45 billion. Creation of the product was at $398.27 billion, and business extensions accumulated $249.94 billion.
- These figures underscore the dynamic expansion and diverse revenue streams within the dropshipping industry, highlighting its significant role in the e-commerce sector.
(Source: market.us)
Global Dropshipping Market Share – By Product Type
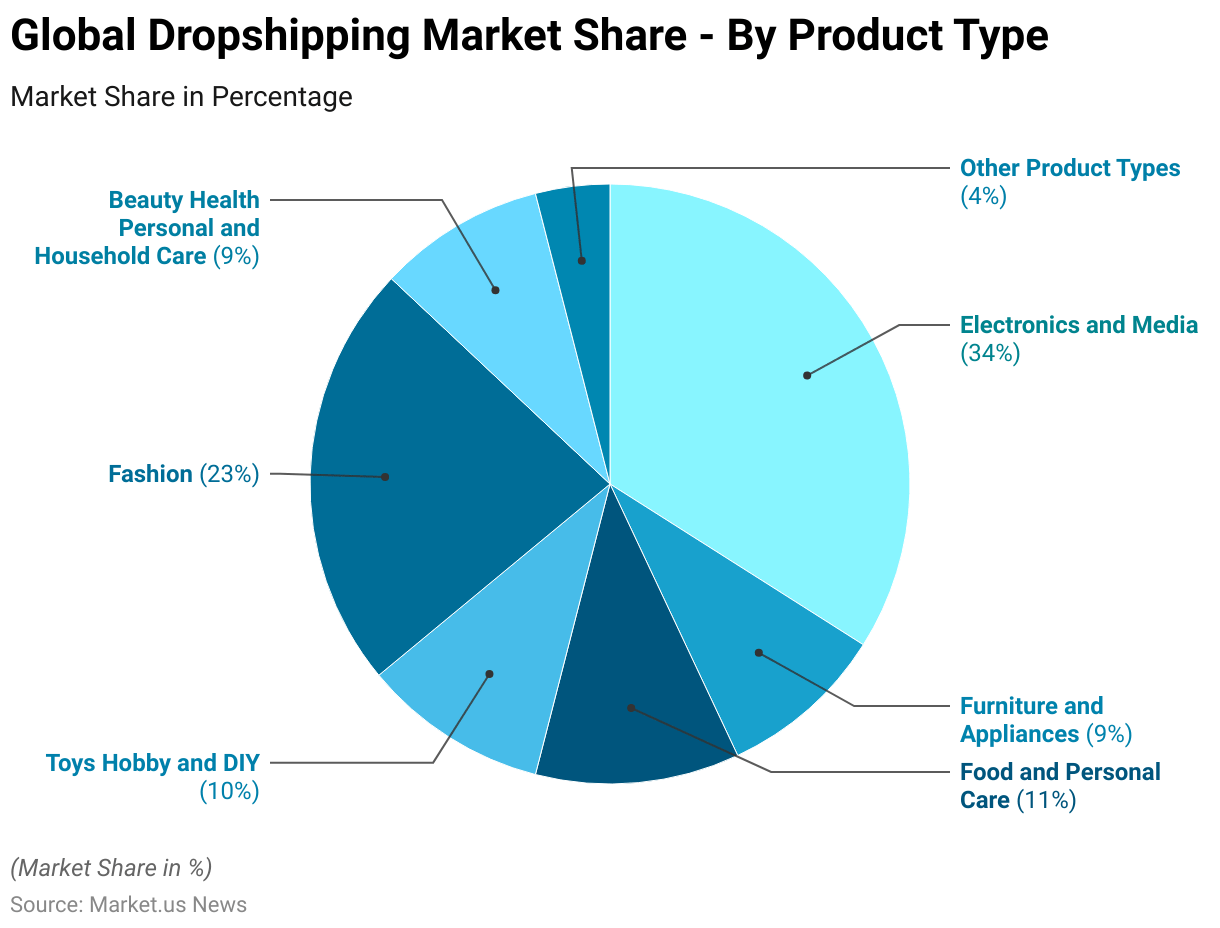
- A diverse range of product types characterizes the global dropshipping market, each holding a significant share of the market.
- Electronics and Media dominate the market with a substantial 34% share. Reflecting the high demand for consumer electronics, gadgets, and media products through online platforms.
- Fashion is another major segment, capturing 23% of the market, driven by consumers’ increasing preference for online apparel and accessory shopping.
- Food and Personal Care products account for 11% of the market. Indicating a robust interest in groceries and personal care items.
- Toys, Hobby, and DIY products also hold a notable share at 10%, showing consumer engagement in hobbies and home projects.
- Furniture and Appliances, as well as Beauty, Health, Personal, and Household Care, each make up 9% of the market, pointing to steady demand in these categories.
- Other product types, including niche and specialized items, represent 4% of the market. Showcasing the versatility and wide-ranging appeal of the dropshipping model.
- This distribution highlights the varied consumer interests catered to by the dropshipping industry.
(Source: market.us)
Market Volume of Main Dropshipping Services – By Region
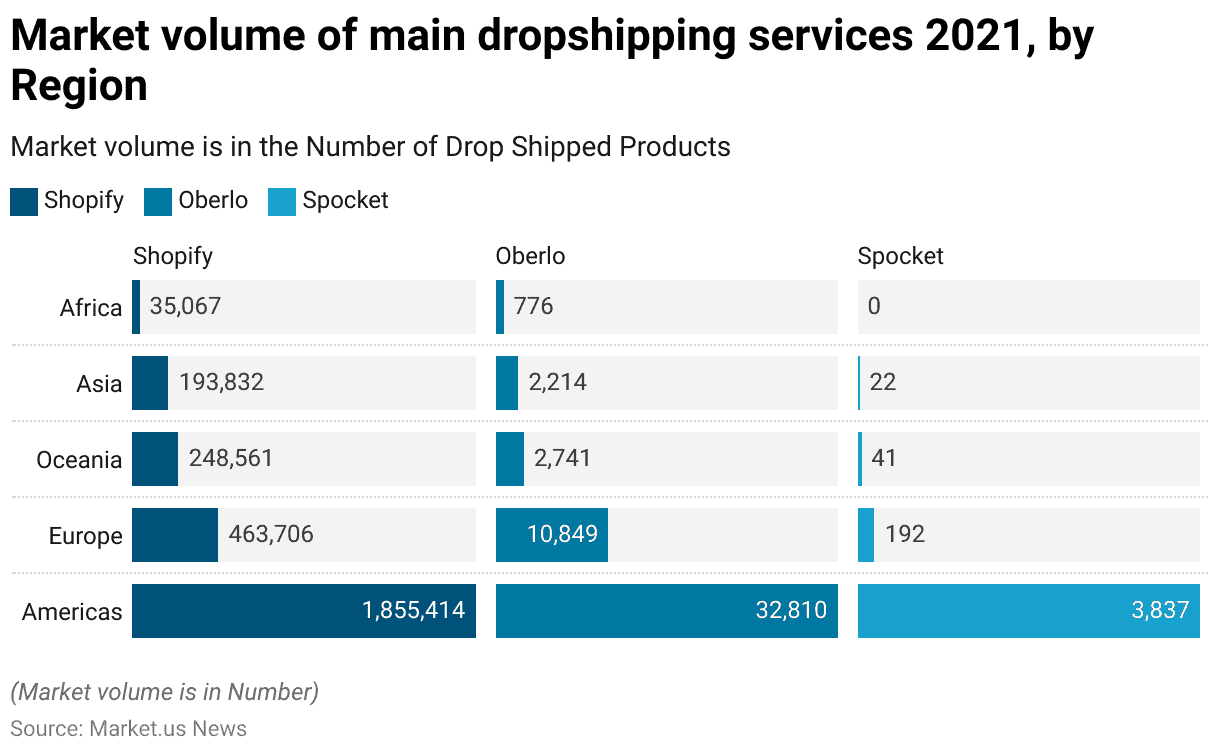
- In 2021, the market volume of main dropshipping services varied significantly across different regions, as demonstrated by the number of products dropshipped.
- The Americas led with a substantial volume, where Shopify facilitated the shipment of 1,855,414 products. Followed by Oberlo with 32,810 products and Spocket with 3,837 products.
- Europe also showed a strong presence in the dropshipping market. With Shopify shipping 463,706 products, Oberlo managing 10,849, and Spocket contributing a modest 192 products.
- Oceania’s market was smaller yet significant, with Shopify handling 248,561 products, Oberlo 2,741, and Spocket just 41 products.
- In Asia, the numbers were lower, with Shopify at 193,832 products, Oberlo at 2,214, and Spocket at 22 products.
- Africa had the least volume, where Shopify shipped 35,067 products. Oberlo handled 776, and Spocket had no activity.
- This data illustrates the varying scale and penetration of dropshipping services across different global regions, with Shopify dominating the market across all regions.
(Source: Statista)
Number of Digital Buyers Worldwide
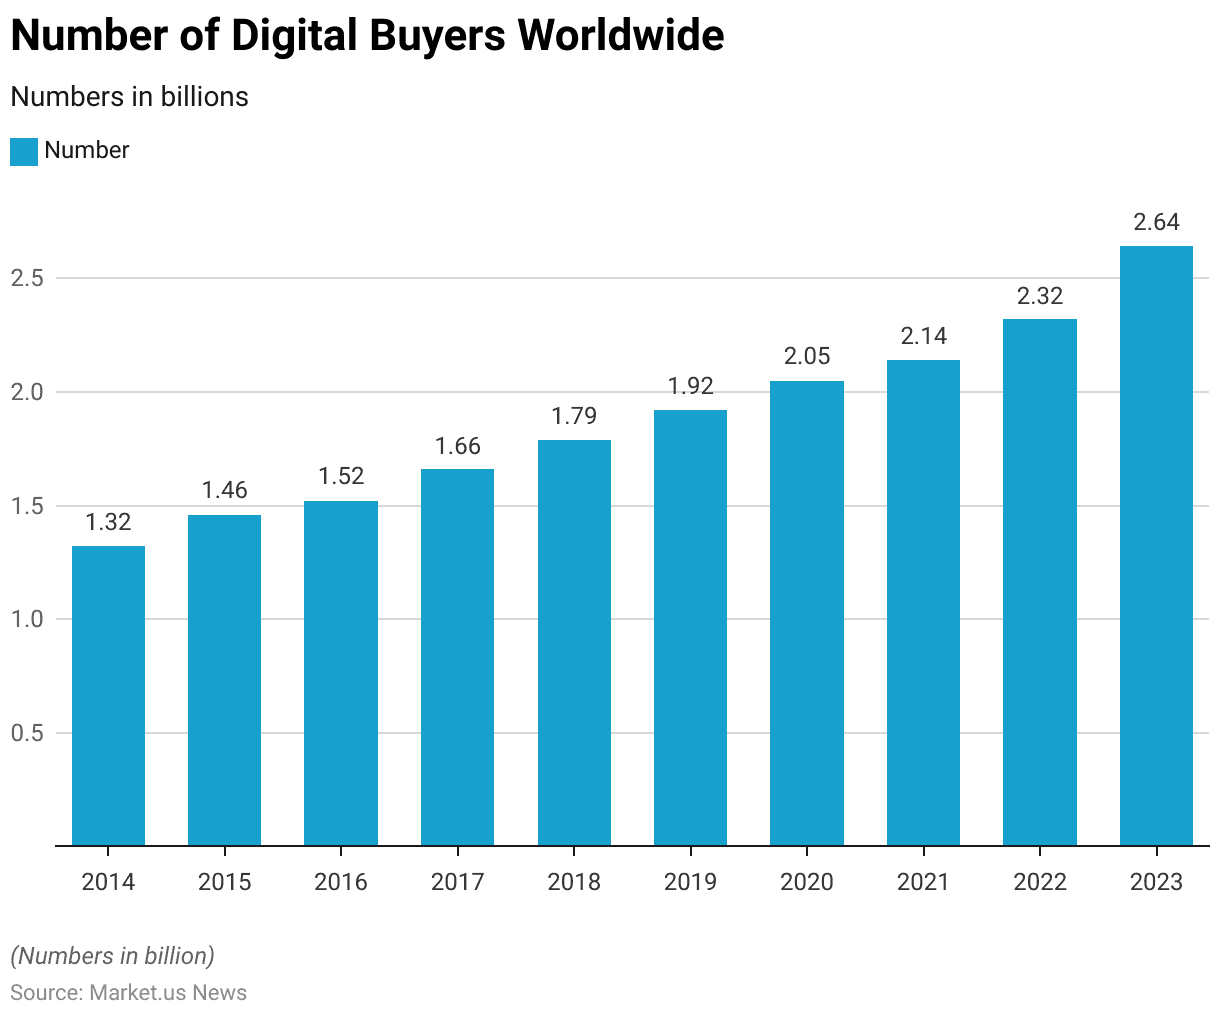
- The number of digital buyers worldwide has shown a consistent upward trend over the past decade. Starting in 2014, the global digital buyer count was approximately 1.32 billion.
- This figure gradually increased to 1.46 billion in 2015, followed by a slight rise to 1.52 billion in 2016.
- The growth continued more robustly through the subsequent years, reaching 1.66 billion in 2017, 1.79 billion in 2018, and 1.92 billion in 2019.
- The year 2020 saw the number surpass the two billion mark, with a total of 2.05 billion digital buyers. This growth was slightly tempered in 2021, with the count reaching 2.14 billion.
- However, a significant jump was observed in 2022, with the number climbing to 2.32 billion.
- The most dramatic increase occurred in 2023, when the number of digital buyers surged to 2.64 billion, indicating a robust expansion in global e-commerce activity.
- This consistent rise reflects the increasing penetration of internet access and the growing comfort of consumers with online shopping platforms.
(Source: Statista)
Main Dropshipping Product Categories Statistics
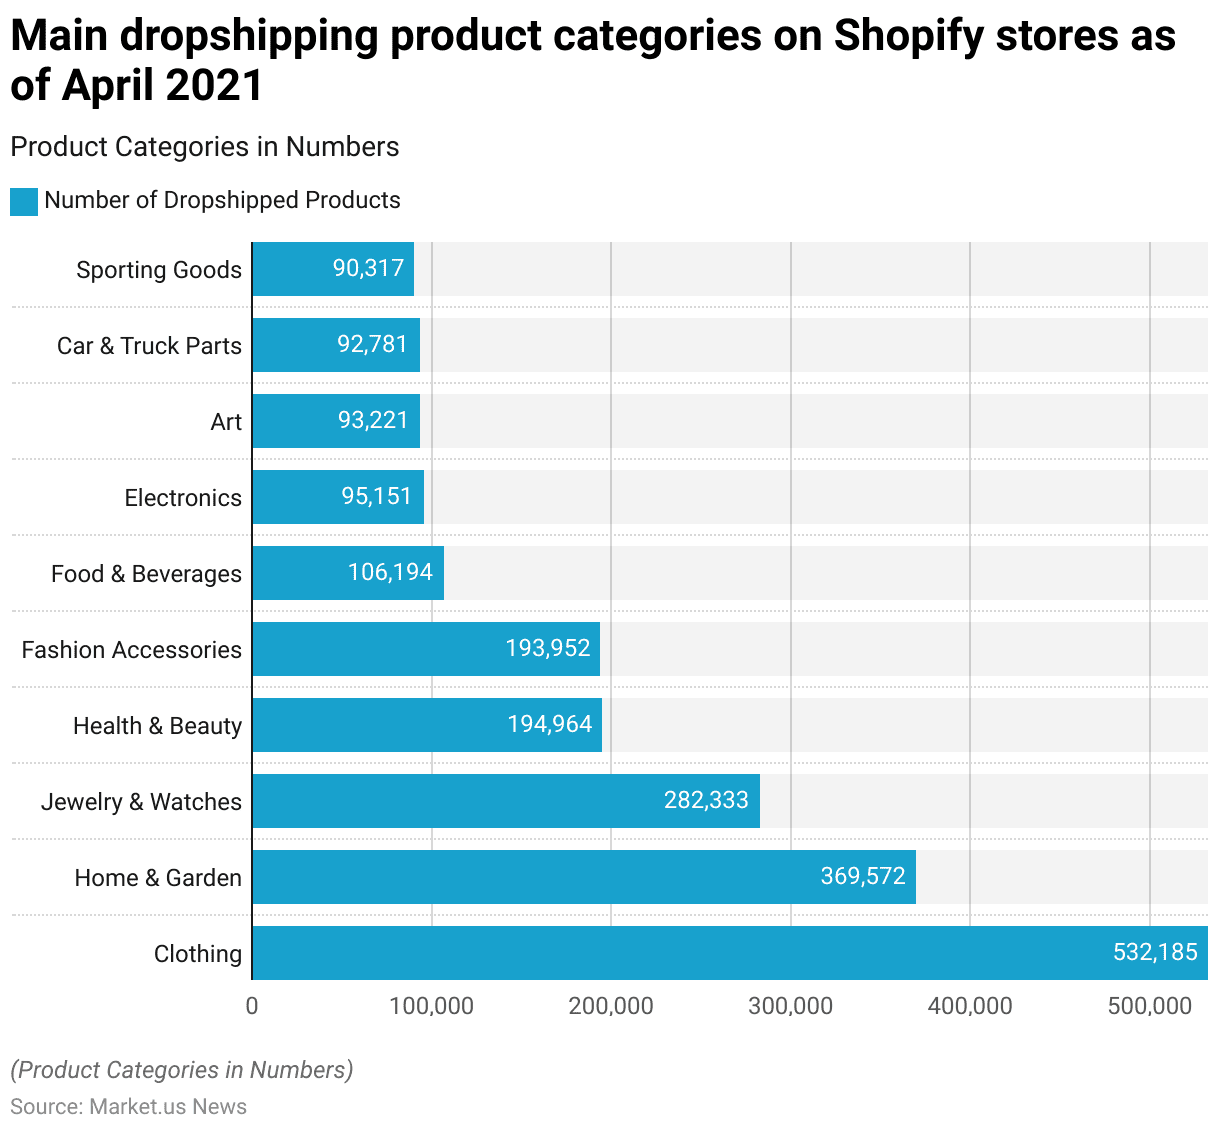
- As of April 2021, the main product categories dropshipped on Shopify stores varied widely, reflecting diverse consumer interests.
- Clothing was the most popular category, with 532,185 products being dropshipped. Underscoring its dominant position in the online retail space.
- Home & Garden followed with 369,572 products, while Jewelry & Watches comprised 282,333 products, highlighting their significant appeal among shoppers.
- Health & Beauty products were also prominently featured. With 194,964 items drop shipped. Fashion Accessories were nearly as prevalent, with 193,952 products.
- Further down the list, Food & Beverages saw 106,194 products being drop shipped, and Electronics came in with 95,151 products.
- Art and Car & Truck Parts were closely matched, with 93,221 and 92,781 products, respectively. Sporting Goods rounded out the list with 90,317 products being drop shipped.
- This distribution reflects the wide range of interests that Shopify dropshippers cater to, from daily essentials to more niche market items.
(Source: Statista)
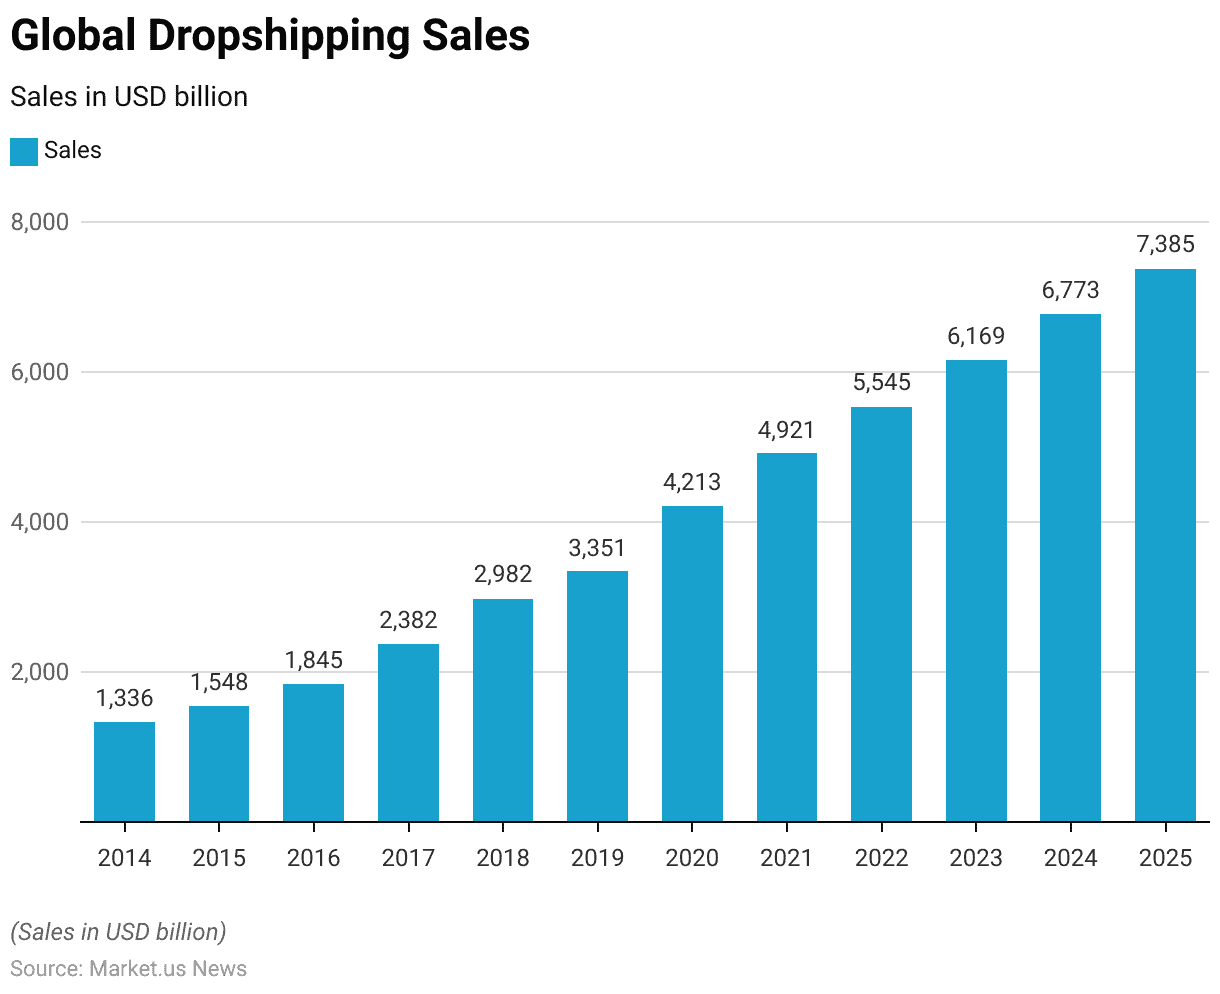
Global Dropshipping Sales Statistics
- Global dropshipping sales have exhibited a strong and steady growth trend over the years. In 2014, sales amounted to $1,336 billion and saw a steady increase to $1,548 billion in 2015.
- The upward trend continued, with sales reaching $1,845 billion in 2016 and surging to $2,382 billion in 2017.
- The growth trajectory maintained its momentum in the following years, with sales escalating to $2,982 billion in 2018 and then to $3,351 billion in 2019.
- The year 2020 marked a significant rise, with sales jumping to $4,213 billion, likely fueled by increased online activity during the global health crisis.
- This growth persisted into 2021, with sales climbing to $4,921 billion, followed by an increase to $5,545 billion in 2022. In 2023, the sales further rose to $6,169 billion.
- Projections for the coming years suggest a continued upward trajectory, with sales expected to reach $6,773 billion in 2024 and $7,385 billion by 2025.
- This consistent increase underscores the expanding role of dropshipping in the global e-commerce sector, driven by evolving consumer behaviors and technological advancements in online retail.
(Source: Statista)
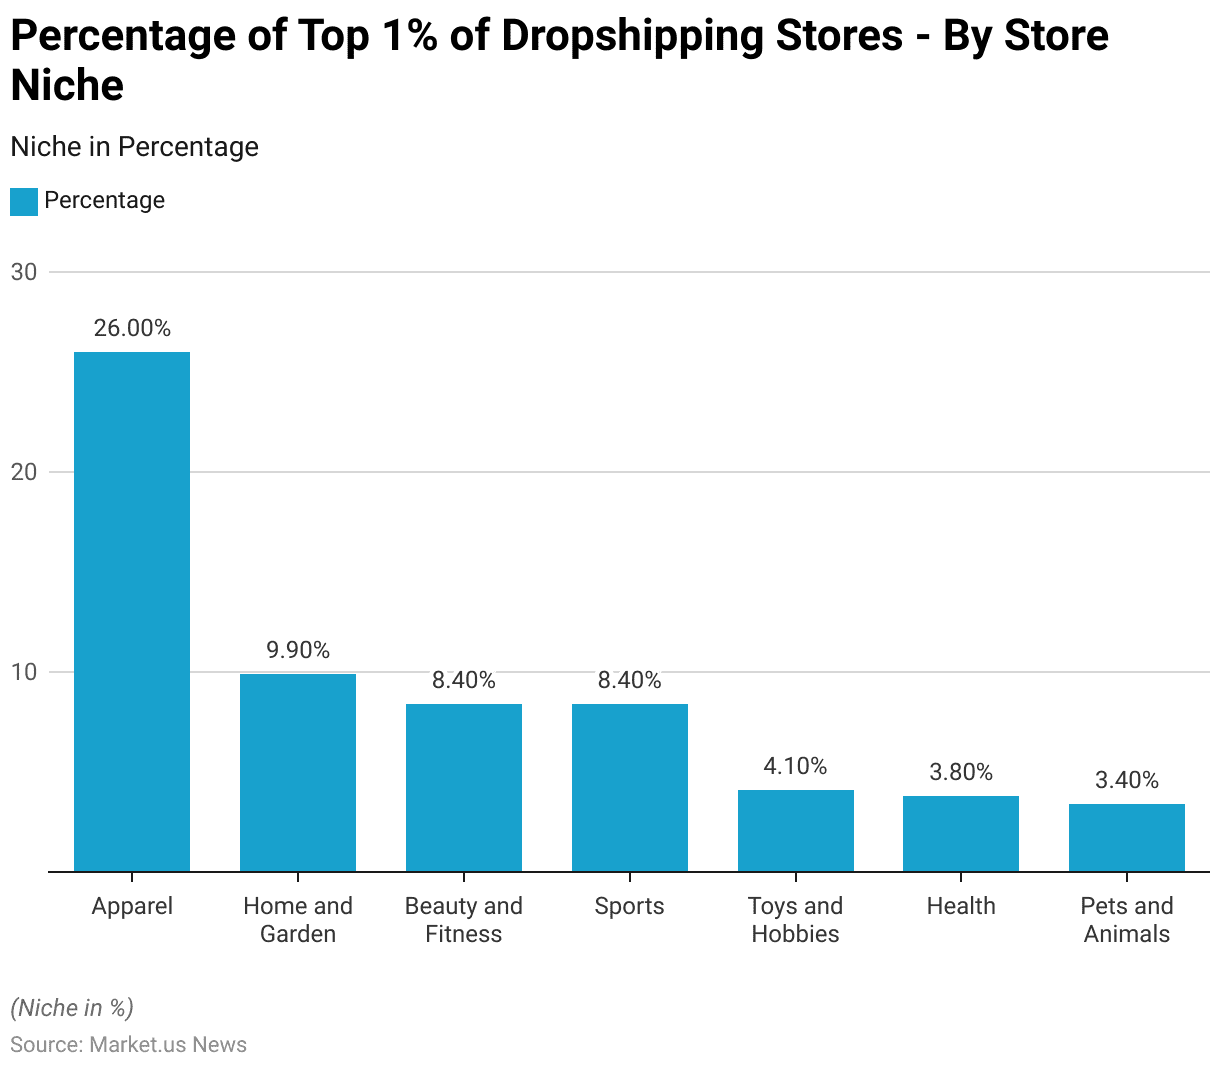
Global Dropshipping Statistics – By Store Niche
- In the dropshipping industry, the distribution of the top 1% of stores by niche highlights a distinct preference for certain categories.
- Apparel leads as the most prominent niche, accounting for 26.00% of the top-performing dropshipping stores, reflecting the high consumer interest in fashion and clothing items.
- Home and Garden is the second most significant niche, comprising 9.90% of the top stores, suggesting a strong market for home decor and gardening products.
- Beauty and Fitness, alongside Sports, each capture 8.40% of the elite dropshipping stores, indicating robust demand for products in both the personal care and sports equipment categories.
- Toys and Hobbies represent 4.10% of the top stores, followed closely by Health, which makes up 3.80%.
- Pets and Animals also hold a notable share, with 3.40% of the top stores specializing in this niche.
- This distribution underscores the varied consumer preferences and the opportunities within these sectors for dropshipping businesses to capitalize on specific market demands.
(Source: dodropshipping.com)
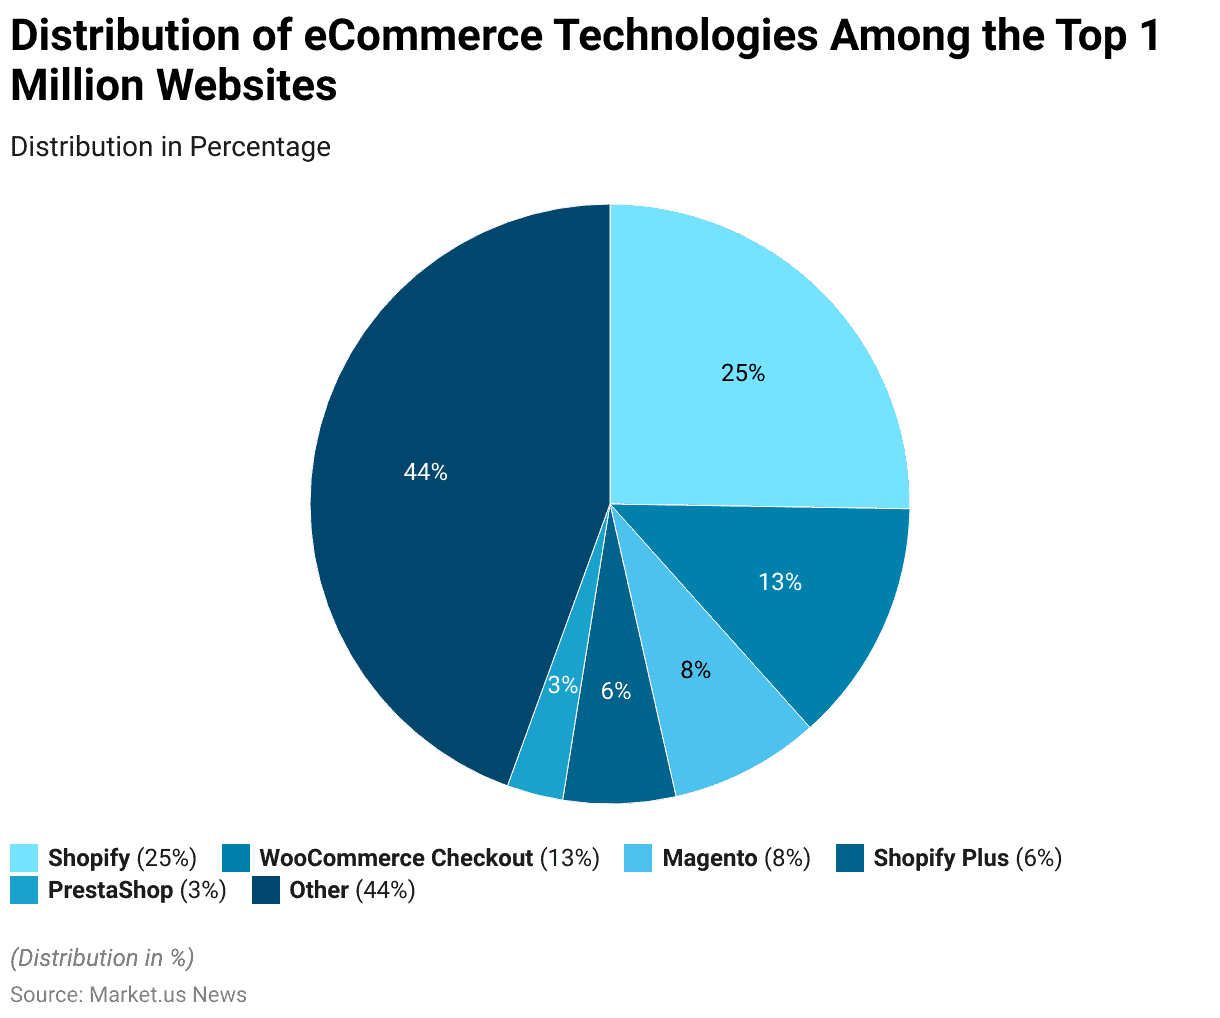
eCommerce Usage Distribution in Sites
- The eCommerce technology landscape across the top 1 million sites reveals a diverse usage distribution of various platforms.
- Shopify emerges as the dominant technology, being utilized by 25% of these websites, highlighting its popularity and user-friendly nature.
- WooCommerce Checkout follows, accounting for 13% of the distribution, underscoring its role as a significant player in the eCommerce sector, especially among WordPress users.
- Magento, known for its robustness and scalability, is used by 8% of the sites. While Shopify Plus, an enterprise version of Shopify, accounts for 6% of the usage.
- PrestaShop, another eCommerce solution, is used by 3% of the sites. Reflecting its presence in niche markets.
- The remaining 44% of the distribution comprises a variety of other technologies, indicating a highly fragmented market with numerous smaller platforms catering to specific needs and preferences.
- This diversity in eCommerce technology usage points to a competitive landscape where businesses choose platforms based on factors like scalability, cost, and specific feature requirements.
(Source: Built with)
Demographics of Dropshipping Consumers Statistics
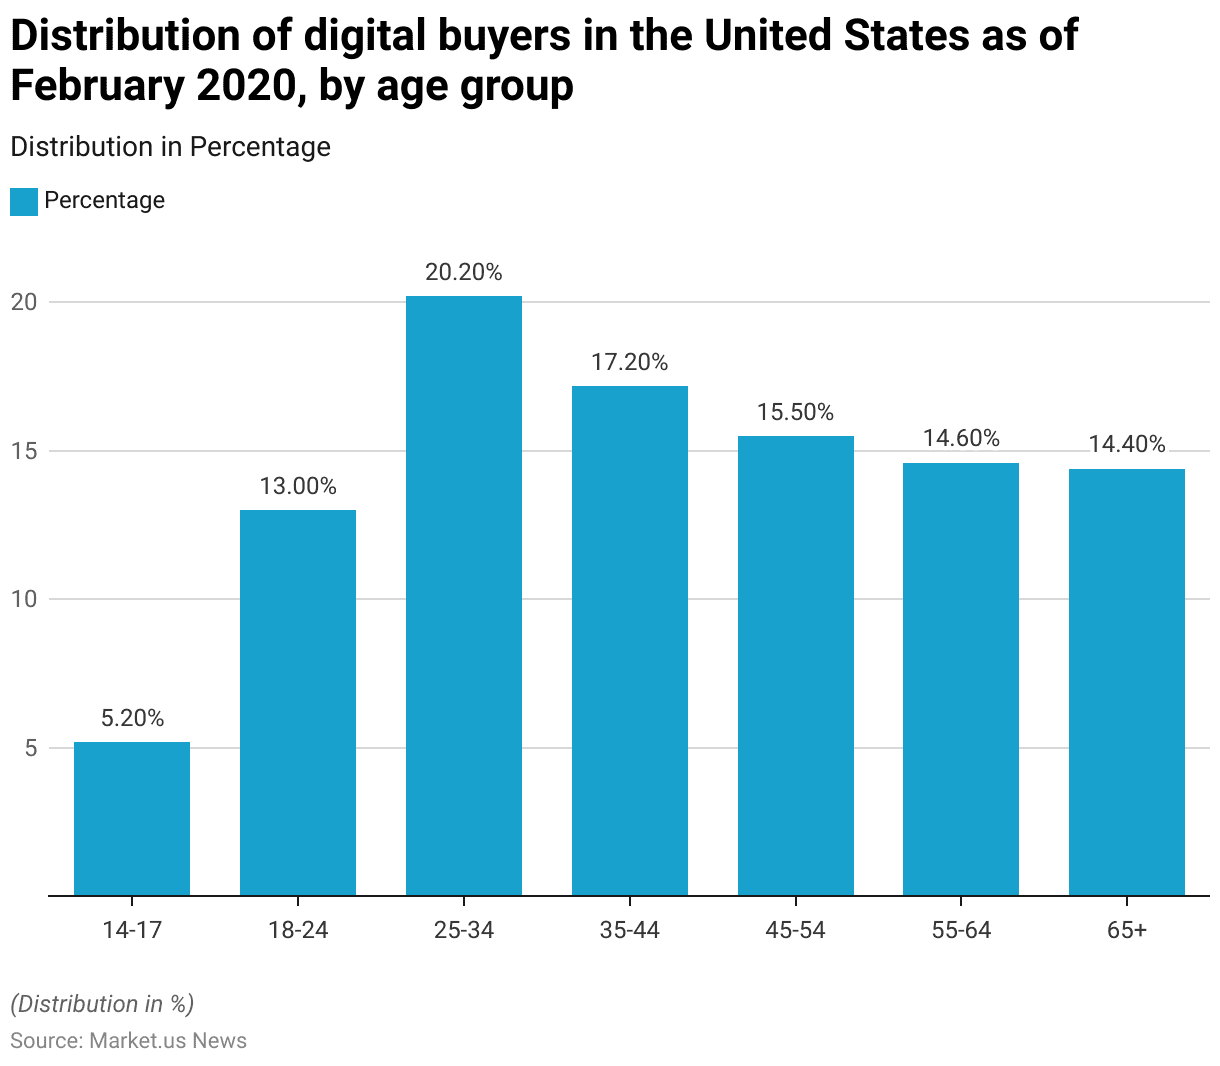
By Age Group
- As of February 2020, the distribution of digital buyers in the United States by age group demonstrated a diverse range of online shopping participation across different age demographics.
- The largest group of digital buyers was those aged 25-34, who accounted for 20.20% of the total, indicating a strong affinity for online shopping among younger adults.
- This was followed by the 35-44 age group. Which comprised 17.20% of digital buyers.
- Slightly smaller but still significant, the 45-54 and 55-64 age groups represented 15.50% and 14.60%. Respectively, showcasing substantial engagement among middle-aged and older adults.
- The 65 and older group also had a noteworthy presence, making up 14.40% of digital buyers.
- Young adults aged 18-24 constituted 13% of the market, while teenagers aged 14-17 were the smallest group, accounting for just 5.20%.
- This distribution highlights the broad appeal and reach of e-commerce across various age groups in the U.S.
(Source: Statista)
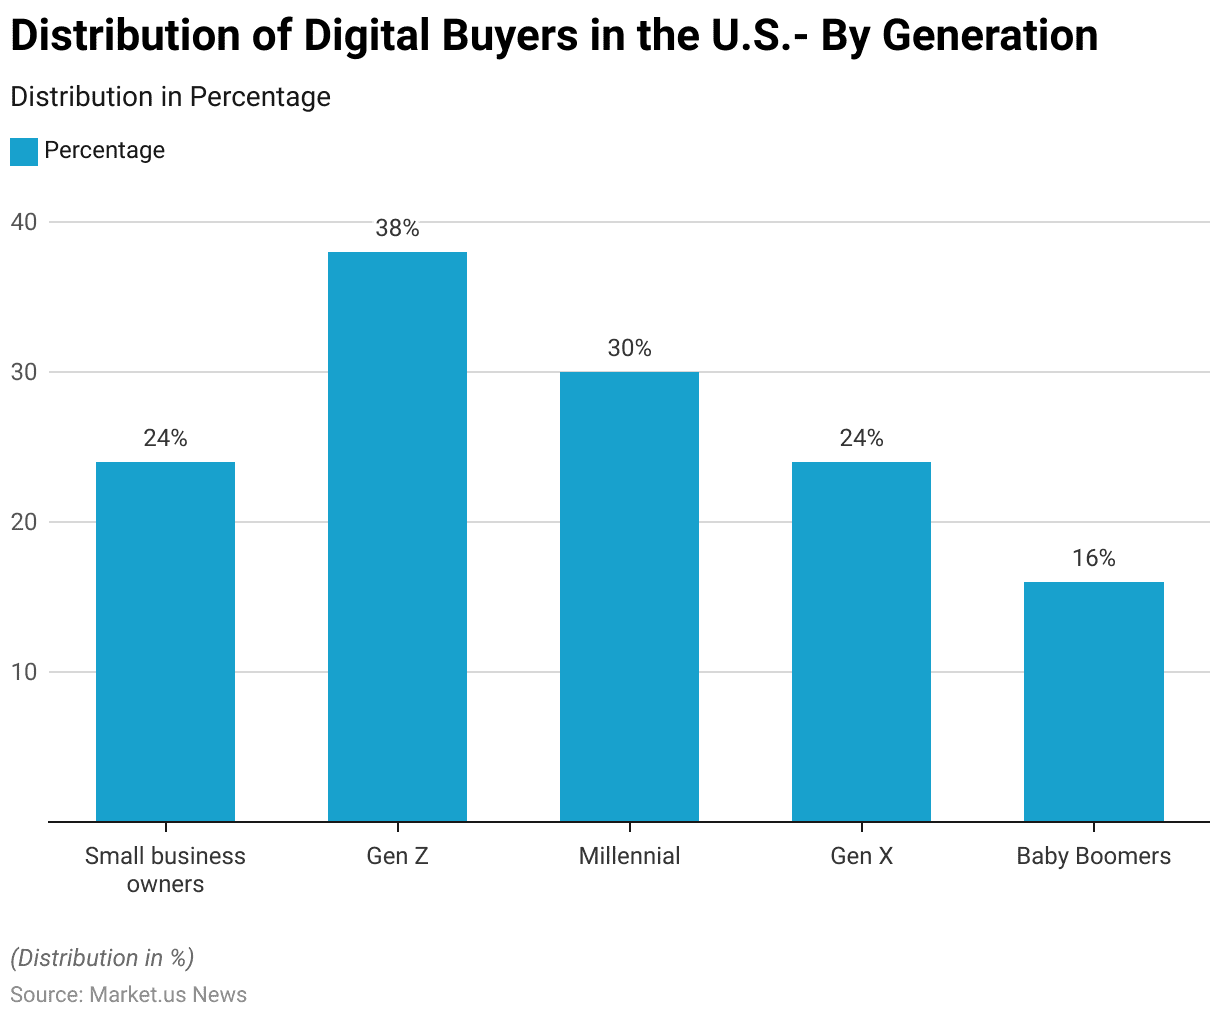
By Generation
- The distribution of digital engagement across different generations reveals varying levels of participation.
- Gen Z leads with a significant 38% share, highlighting their strong presence and active involvement in digital activities.
- Following closely are Millennials, who comprise 30% of the segment, underscoring their integral role in the digital landscape.
- Gen X and small business owners each hold a 24% share, indicating substantial engagement from more established generations and entrepreneurs.
- Baby Boomers, though less represented compared to younger generations, still account for 16% of digital engagement, showing that they remain active participants in the digital realm.
- This distribution illustrates the diverse adoption of digital practices across generations. With younger groups showing higher engagement but substantial participation spanning all age groups.
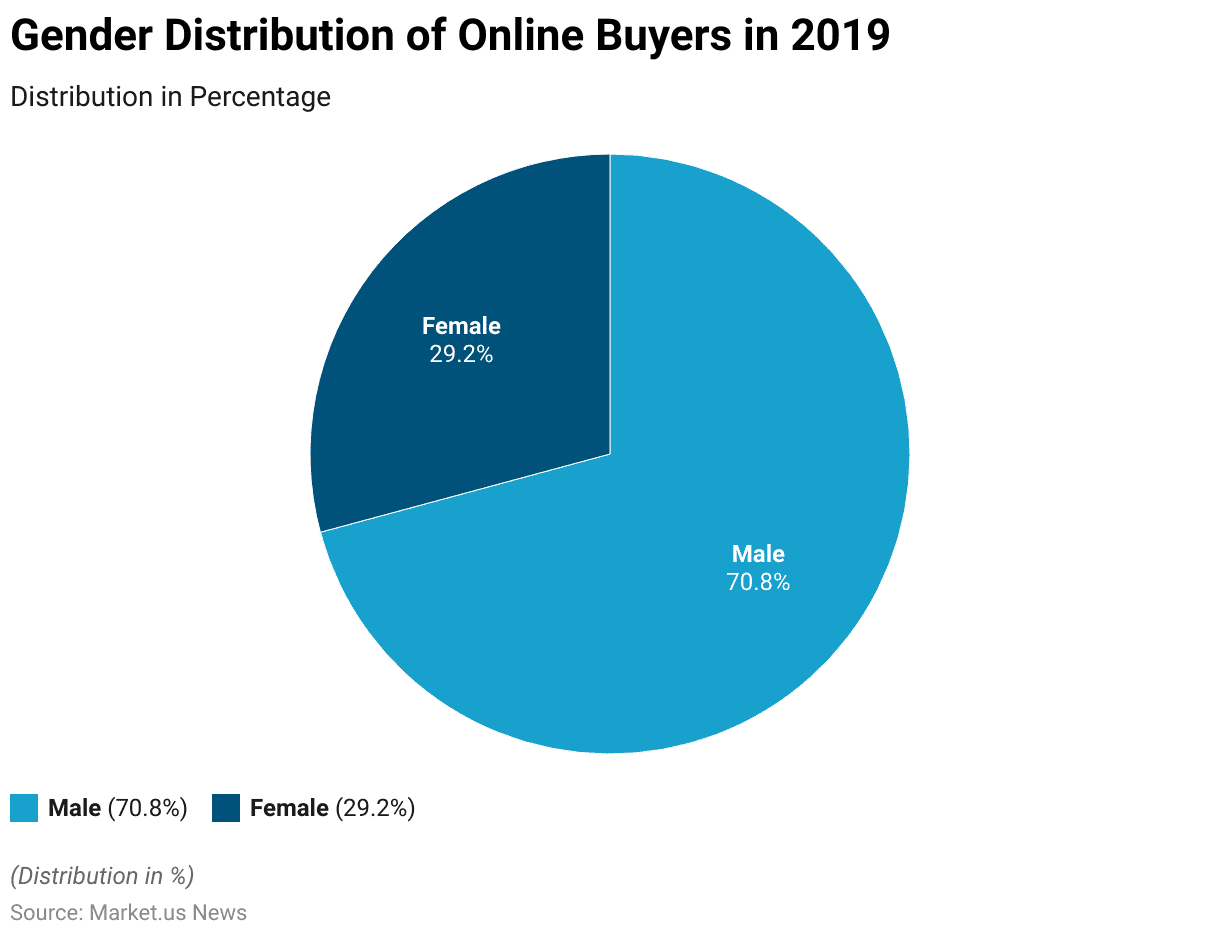
By Gender
- A gender segmentation study of online buyers conducted in 2019 revealed significant disparities in shopping behavior between genders.
- The data showed that male users dominated the online buying landscape, accounting for 70.8% of online buyers.
- In contrast, female buyers made up a smaller portion of the market, constituting just 29.2%.
- This stark difference highlights the varying engagement levels with online shopping between the two genders during that year.
(Source: Amazon Smbhav)
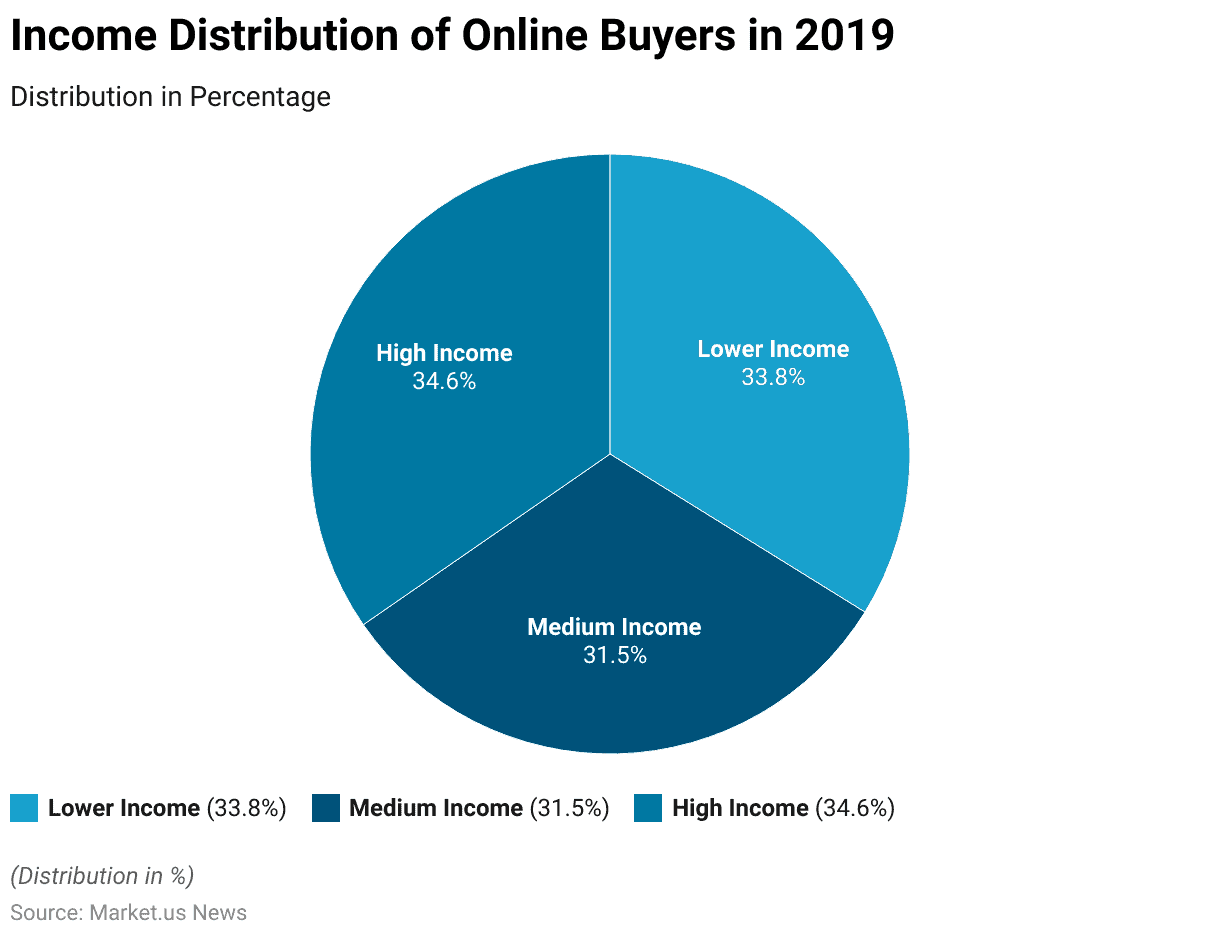
By Income Group
- According to the Statista Global Survey conducted in 2019. The distribution of online buyers by income group was relatively evenly spread across different economic demographics.
- The survey found that 33.8% of online buyers belonged to the lower-income group. Indicating significant participation from this segment in e-commerce activities.
- The medium-income group comprised slightly less, with 31.5% of online buyers.
- Meanwhile, the high-income group represented a slightly larger share, accounting for 34.6% of online buyers.
- This data highlights how online shopping is prevalent across all income levels. With a nearly balanced representation from each economic stratum.
- A survey conducted in August 2022 across the United States, United Kingdom, France, Germany, and Australia found that female digital buyers were more likely to purchase fashion products online compared to their male counterparts.
- The findings indicated that within the 12 months before the survey, 82 percent of women had bought clothing online, whereas only 73 percent of men had made similar purchases.
- This suggests a higher propensity among women to engage in online shopping for fashion items.
(Source: Statista, Amazon Smbhav)
Retailer vs. Dropshipping Statistics
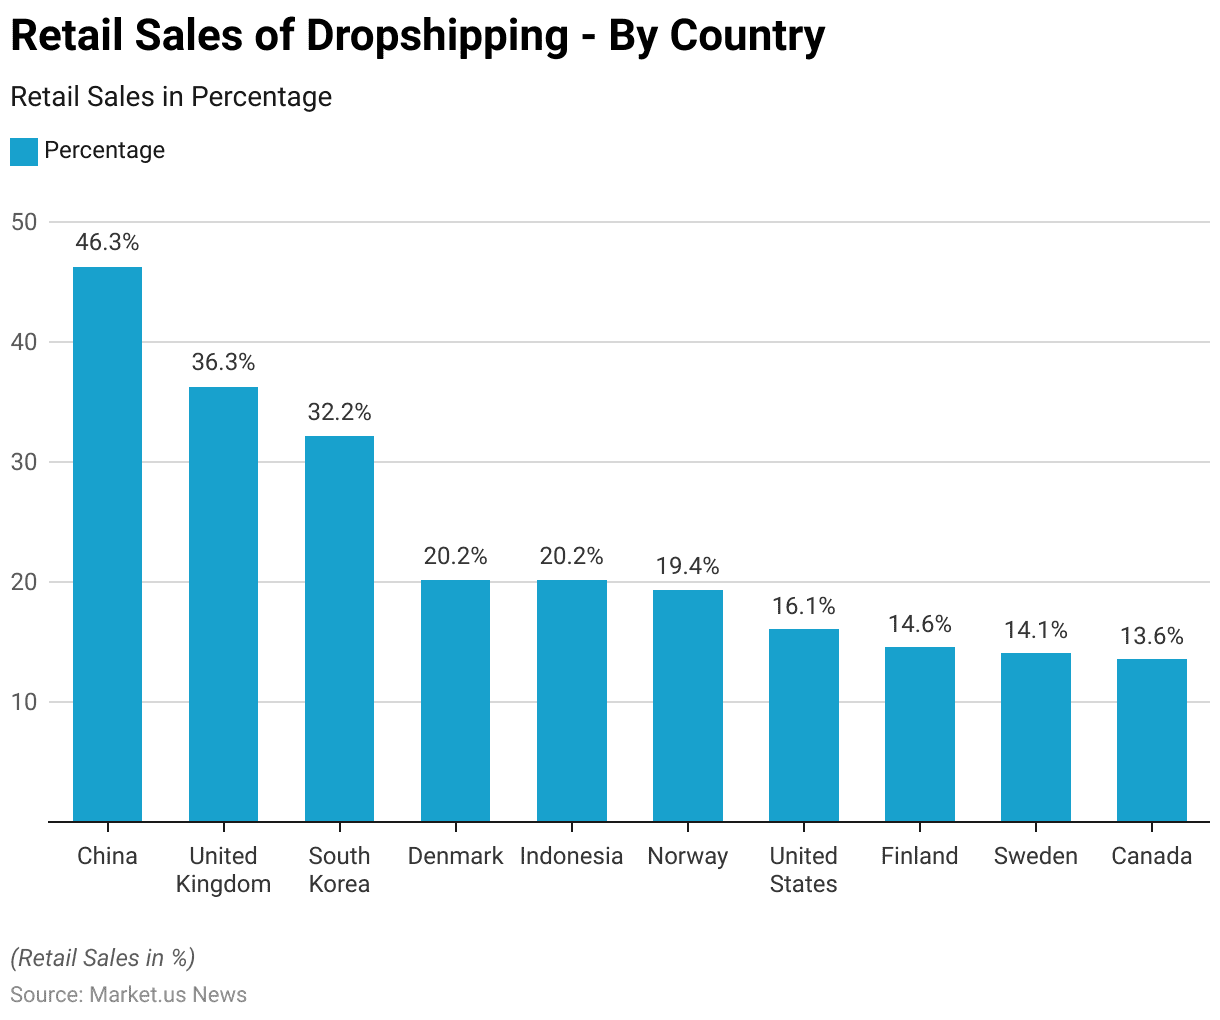
Retail Sales of Dropshipping – By Country Statistics
- Retail sales from dropshipping show a significant variance by country.
- China leads with the highest percentage of dropshipping retail sales at 46.30%. Followed closely by the United Kingdom with 36.30%.
- South Korea also holds a substantial share, contributing 32.20% to the market.
- Both Denmark and Indonesia report equal percentages at 20.20%, demonstrating a strong engagement in dropshipping activities in these regions.
- Norway follows with a slightly lower percentage of 19.40%. The United States also has a notable share of dropshipping sales, accounting for 16.10%.
- In the Nordic region, Finland and Sweden report dropshipping sales percentages of 14.60% and 14.10%, respectively, while Canada rounds out the list with 13.60%.
- This distribution highlights the varied adoption and integration of dropshipping as a retail strategy across different global markets.
(Source: appscenic.com)
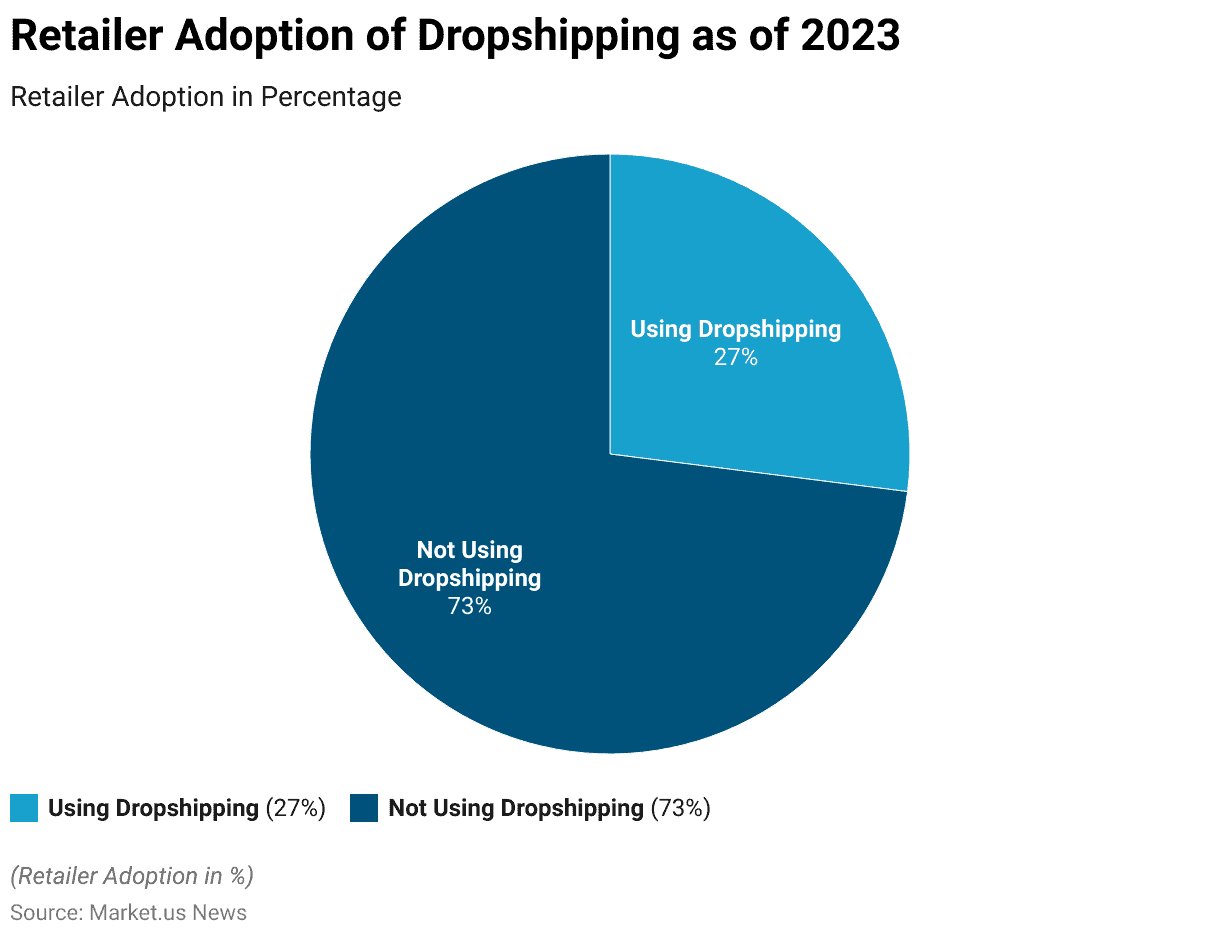
Retailer Adoption of Dropshipping Statistics
- As of 2023, the adoption of the dropshipping business model among retailers shows that only 27% are utilizing this method for fulfilling customer orders.
- Conversely, a significant majority, approximately 73%, of retailers have not yet invested in the dropshipping model.
- This disparity highlights a cautious approach or potential underutilization of dropshipping among the broader retail market, suggesting room for growth and expansion in this sector.
(Source: appscenic.com)
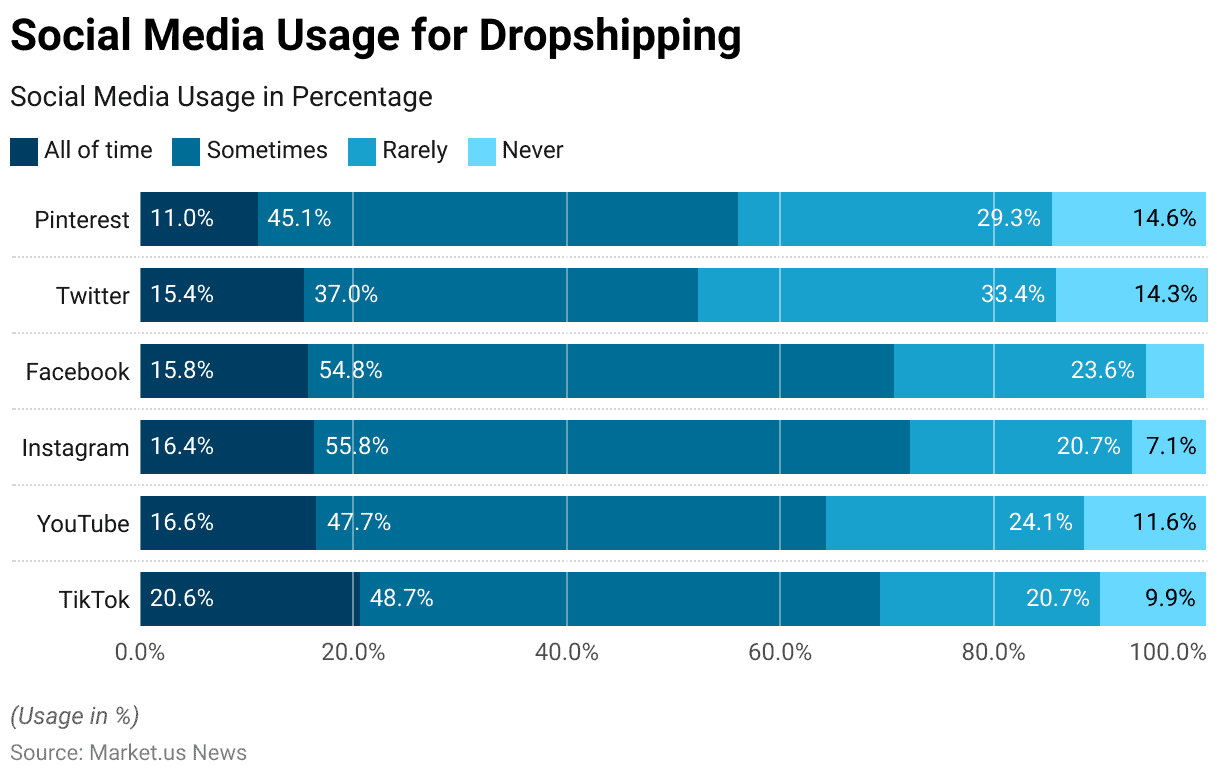
Social Media Usage for Dropshipping Statistics
- A breakdown of social media usage for dropshipping reveals varied engagement levels across different platforms.
- TikTok is used ‘all of the time’ by 20.60% of drop shippers. With 48.70% using it ‘sometimes,’ 20.70% ‘rarely,’ and 9.90% ‘never’ using it.
- YouTube shows similar usage patterns, with 16.60% of dropshippers consistently using it, 47.70% occasionally, 24.10% rarely, and 11.60% never engaging with it.
- Instagram sees a higher frequency of use, with 16.40% using it all the time, 55.80% sometimes, 20.70% rarely, and a smaller fraction, 7.10%, never using it.
- Facebook usage is also significant, with 15.80% always using it, 54.80% sometimes, 23.60% rarely, and only 5.50% never.
- Twitter, however, has a lower consistent usage rate at 15.40%, 37% sometimes, 33.40% rarely, and 14.30% never using it.
- Pinterest is less frequently used, with only 11% using it all the time, 45.10% sometimes, 29.30% rarely, and 14.60% never engaging with it.
- These statistics illustrate the diverse strategies and preferences of drop shippers in leveraging social media platforms to enhance their business operations.
(Source: dodropshipping.com)
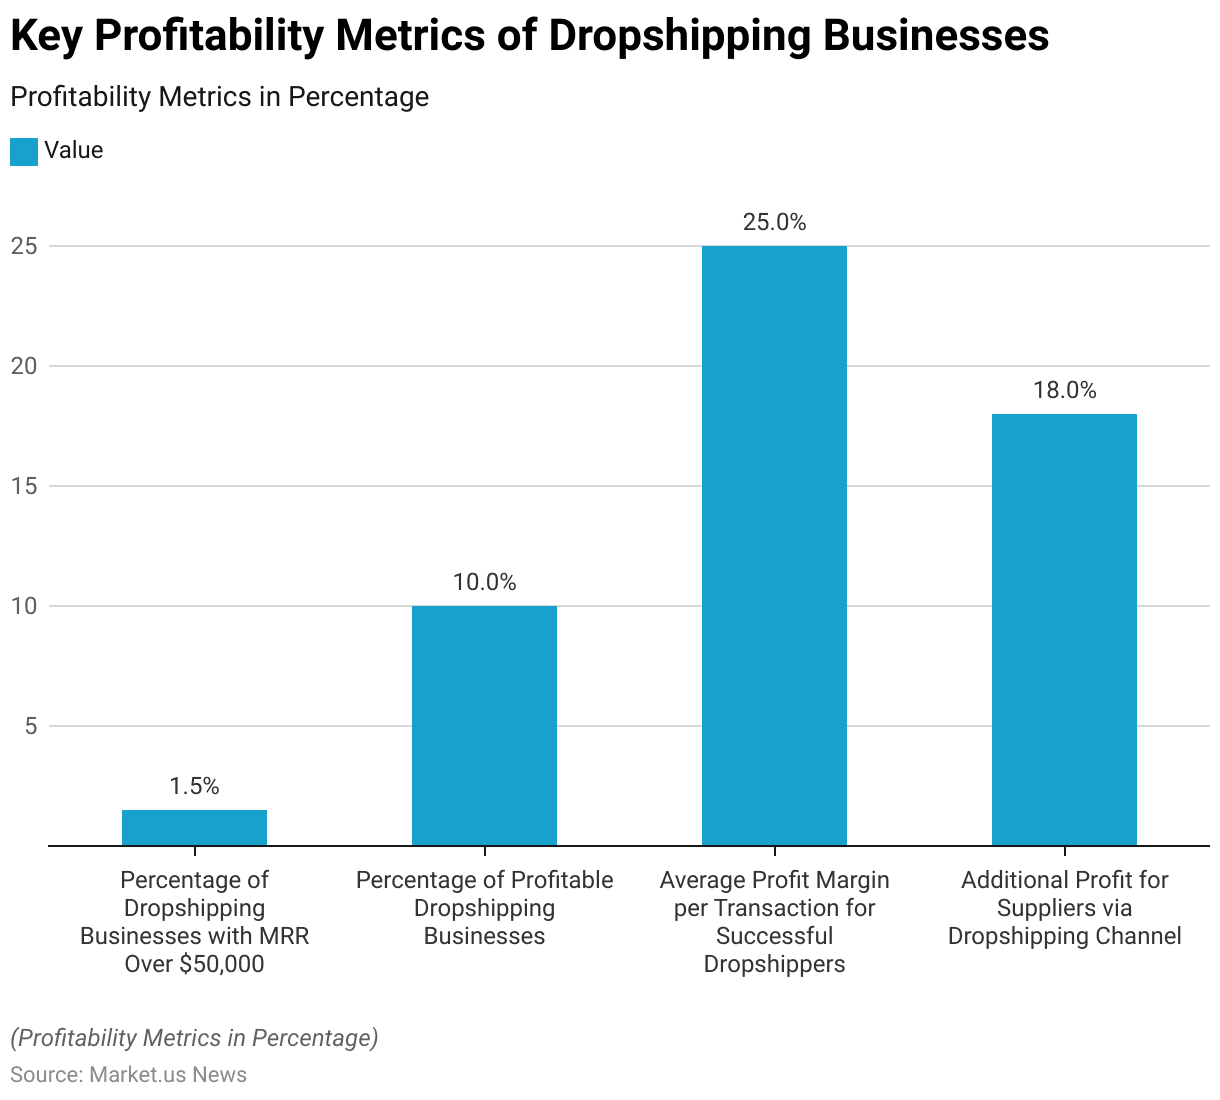
Dropshipping Revenue & Profit Statistics
- DoDropshipping has revealed that only a small fraction, 1.5%, of dropshipping businesses manage to generate over $50,000 in monthly recurring revenue. This underscores the challenges involved in identifying the right niche and forming effective partnerships.
- Shopify experts add another layer to this picture, indicating that only 10% of dropshipping businesses turn a profit.
- Despite these hurdles, dropshipping offers a significant advantage in terms of profitability over traditional retail models. This is primarily because drop shippers are not burdened with the overhead costs associated with managing warehouses and holding inventory.
- E-commerce giants like Amazon and Shopify recognize the potential of dropshipping and have developed specialized services that help reduce operational costs and can increase profit margins by as much as 50%.
- Moreover, a report from BlueCard points out that the most successful drop shippers achieve an average profit margin of 20-30% per transaction. It’s noted that higher-value products typically bring in higher margins, though they tend to sell less frequently.
- Additionally, suppliers who utilize dropshipping channels benefit from an 18% increase in profits compared to direct sales. This statistic highlights the financial benefits of dropshipping for both suppliers and retailers, emphasizing its effectiveness as a business model.
(Source: DoDropshipping, Shopify, Founder Jar, BlueCard, Torch Bankz)
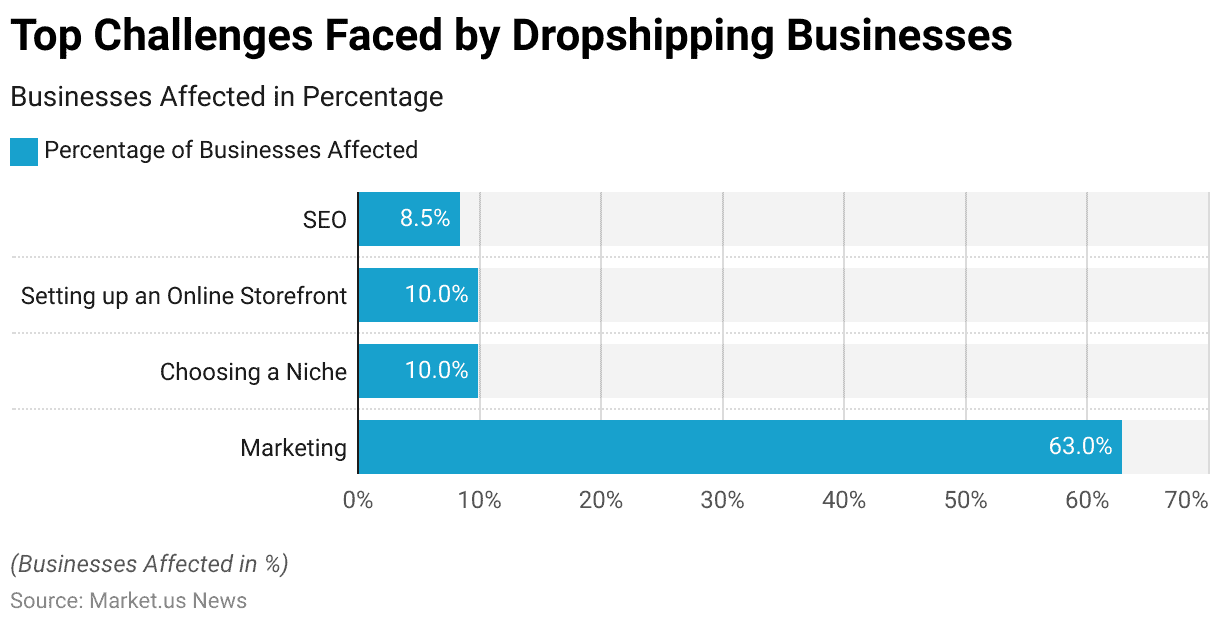
Top Challenges Faced by Dropshipping Businesses Statistics
- A study by AliDropShip has identified several key challenges faced by dropshipping businesses.
- The most significant challenge, reported by over 63% of businesses, is marketing.
- Challenges follow this in choosing a niche and setting up an online storefront, each affecting 10% of businesses.
- Additionally, about 8.5% of businesses struggle with search engine optimization (SEO).
- These issues highlight the diverse hurdles that dropshippers encounter as they attempt to establish and grow their online presence in a competitive market.
(Source: AliDropShip)
Recent Developments
Mergers and Acquisitions:
- American Securities acquired NWN Carousel, marking a strategic expansion into IT services and support (February 2024).
- Cisco Systems completed a significant acquisition of Splunk Inc.. Which was valued at an undisclosed amount (March 2024).
- Bristol Myers Squibb acquired RayzeBio for $4.1 billion, further enhancing its capabilities in targeted radiopharmaceuticals (December 2023).
- Thoma Bravo took Everbridge, a critical event management firm, private in a deal valued at $1.5 billion (February 2024).
Funding Rounds:
- Freenome secured $254 million to advance its early cancer detection platform, reflecting increased investment interest in healthcare innovations (February 2024).
- COUR Pharmaceuticals raised $105 million in Series A funding, primarily to advance clinical trials for autoimmune disorders (January 2024).
- ProfoundBio gathered $112 million in Series B funding to further develop its cancer-fighting antibody-drug conjugate portfolio (January 2024).
Conclusion
Dropshipping Statistics – Dropshipping has become a popular e-commerce model. Enabling entrepreneurs to operate without the typical overhead of traditional retail, such as inventory and warehousing.
Despite the attractive low startup costs and potential for significant profit margins, drop shippers face challenges, including effective marketing. Choosing the right niche, and setting up a user-friendly online store.
The key to success in this model is leveraging tools from platforms like Shopify and Amazon to reduce costs and increase efficiency.
Additionally, using social media effectively is crucial for marketing and customer engagement. As consumer behaviors continue to shift online. The dropshipping model offers a viable pathway for entrepreneurial success, provided the inherent challenges are managed effectively.
FAQs
Dropshipping is a retail fulfillment method where a store doesn’t keep the products it sells in stock. Instead, when a store sells a product, it purchases the item from a third party and has it shipped directly to the customer. As a result, the seller doesn’t handle the product directly.
The main benefits of dropshipping include lower overhead costs since there’s no need to purchase inventory or manage a warehouse. The ability to offer a wide range of products, the flexibility to operate from anywhere, and the ease of scaling operations.
Some of the main challenges include finding reliable suppliers and managing customer service and returns. Dealing with out-of-stock issues, and executing effective marketing strategies to stand out in a competitive market.
Yes, dropshipping can be profitable if managed correctly. Profitability depends on your ability to market your products effectively, maintain a good relationship with suppliers, and manage operational costs. Successful drop shippers typically achieve good margins by optimizing their product offerings and marketing strategies.
Common mistakes include not researching the market thoroughly, selecting unreliable suppliers, and neglecting customer service. Failing to optimize the online store for conversions, and not investing in effective marketing strategies. Avoiding these pitfalls can significantly increase your chances of success.
Discuss your needs with our analyst
Please share your requirements with more details so our analyst can check if they can solve your problem(s)