

Table of Contents
- Introduction
- Editor’s Choice
- Prevalence of Undernourishment By Food Security Statistics
- Food Security Statistics By Global Hunger Index Scores in Regions
- Food Security Prevalence During COVID-19 Statistics
- Food Prices and Inflation Statistics
- Initiatives and Projects to Combat Food Security Concerns Statistics
- Recent Developments
- Conclusion
- FAQs
Introduction
Food Security Statistics: Food security, vital for ensuring everyone has access to enough nutritious food, hinges on its availability, access, utilization, and stability.
Influenced by factors like economic growth, agriculture, market dynamics, governance, and environmental health. It’s a global priority tackled by organizations such as the FAO, WFP, and IFAD, along with governments and NGOs.
Efforts to improve food security are gauged using metrics like undernourishment prevalence, the FIES, and the GHI.
However, A holistic strategy is essential, focusing on boosting agricultural output, and enhancing food distribution. Ensuring diet quality, and building system resilience against disruptions.
Leveraging tech innovations and addressing root causes such as poverty and climate change are key steps towards global food security. Which is crucial for health, economic progress, and social stability.
Editor’s Choice
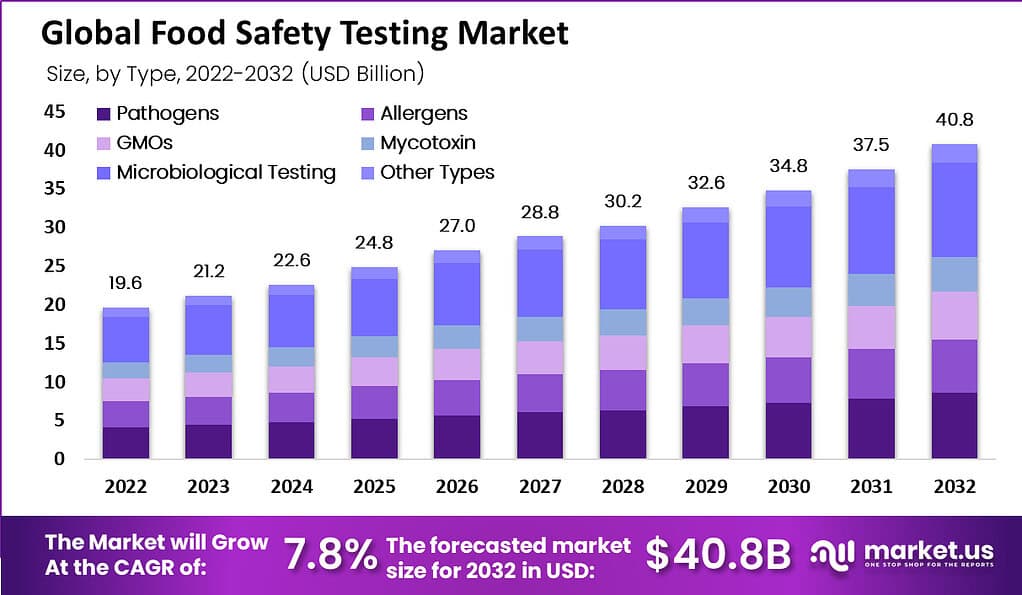
- The Global Food Safety Testing Market was valued at USD 19.6 Billion, this market is estimated to register the highest CAGR of 7.8% and is expected to reach USD 40.8 Billion during the forecast period of 2023 to 2032.
- In 2020, when the number of people undernourished escalated to 768 million, marking a prevalence rate of 9.9%.
- By 2020, global severe food insecurity escalated to 11.9%, with Africa bearing the brunt at 25.9%. Followed by Latin America and the Caribbean at 14.2%, Asia at 10.2%, and Northern America and Europe at 1.4%.
- During the period from November 2023 to February 2024, Argentina topped the list with a staggering nominal food inflation rate of 303%.
- During the early stages of the COVID-19 pandemic, approximately 64.4% of respondents reported never experiencing food insecurity. Indicating a majority had stable access to sufficient food.
- Moreover, In January 2024, the Food Price Index, reflecting the fluctuating costs of essential food items, recorded a level of 118.
- In 2022, global freight rates increased by 1.73%, while grain prices rose by 1.95%.
- Hence, A $150 million grant has been allocated for the second phase of the Yemen Food Security Response and Resilience Project. Thus funding aims to tackle food insecurity, enhance resilience, and safeguard livelihoods.
Prevalence of Undernourishment By Food Security Statistics
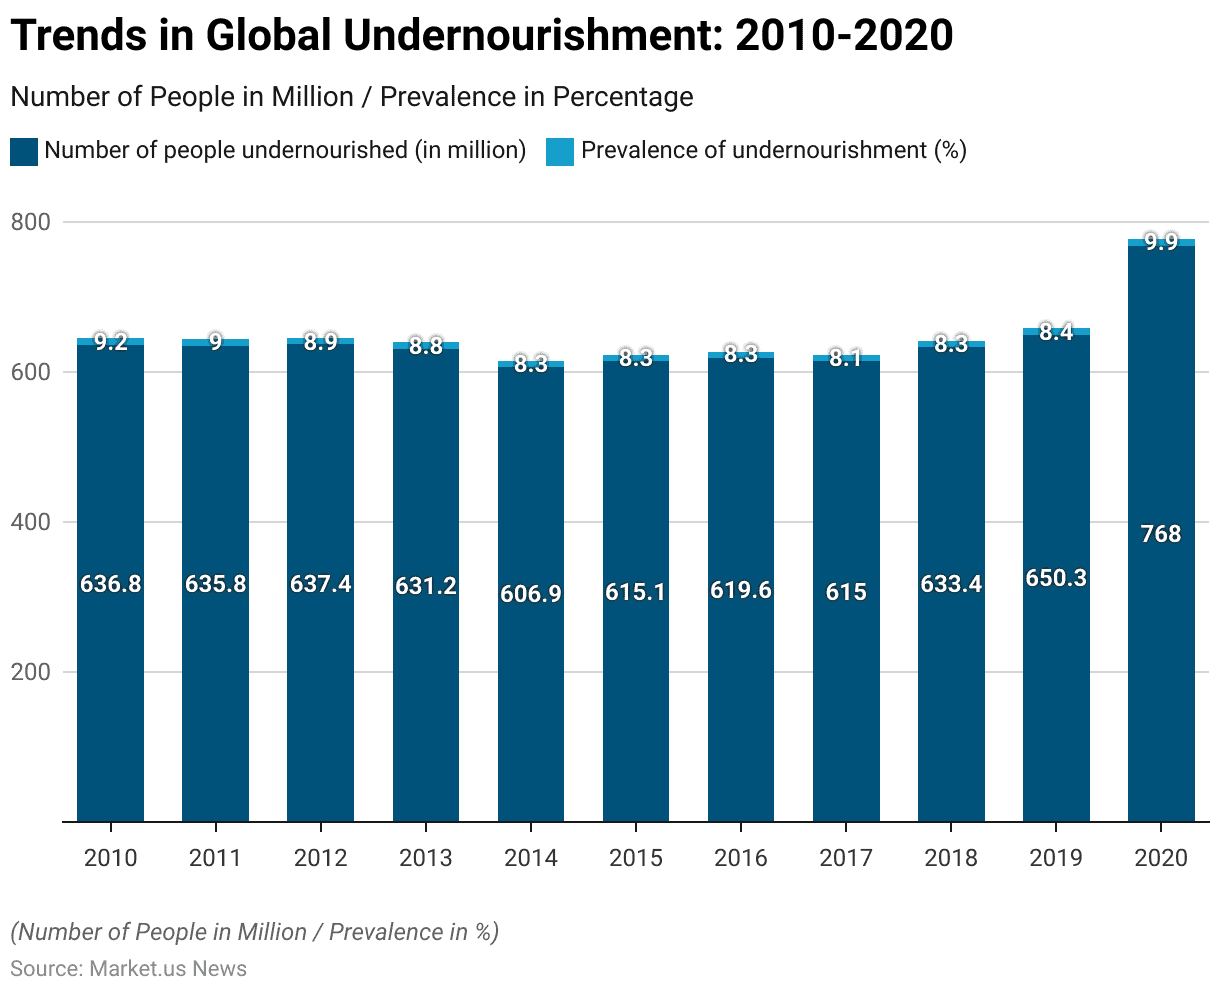
- Between 2010 and 2020, the global landscape of undernourishment witnessed fluctuating trends.
- In 2010, there were approximately 636.8 million people facing undernourishment, with a prevalence rate of 9.2%.
- This figure slightly decreased to 635.8 million (9.0%) in 2011 and continued to show minor variations over the next few years, reaching its lowest in 2014 at 606.9 million people (8.3%).
- Despite these fluctuations, the prevalence rate remained relatively stable at around 8.3% between 2014 and 2016.
- A slight decrease was noted in 2017, with 615 million people undernourished (8.1%). But the number again rose to 633.4 million (8.3%) in 2018 and further to 650.3 million (8.4%) in 2019.
- A significant surge occurred in 2020, when the number of people undernourished escalated to 768 million, marking a prevalence rate of 9.9%.
- This decade-long observation underscores the challenges and variable progress in combating global undernourishment.
(Source: FAO)
Food Security Statistics By Severe Insecurity Rates Across Regions
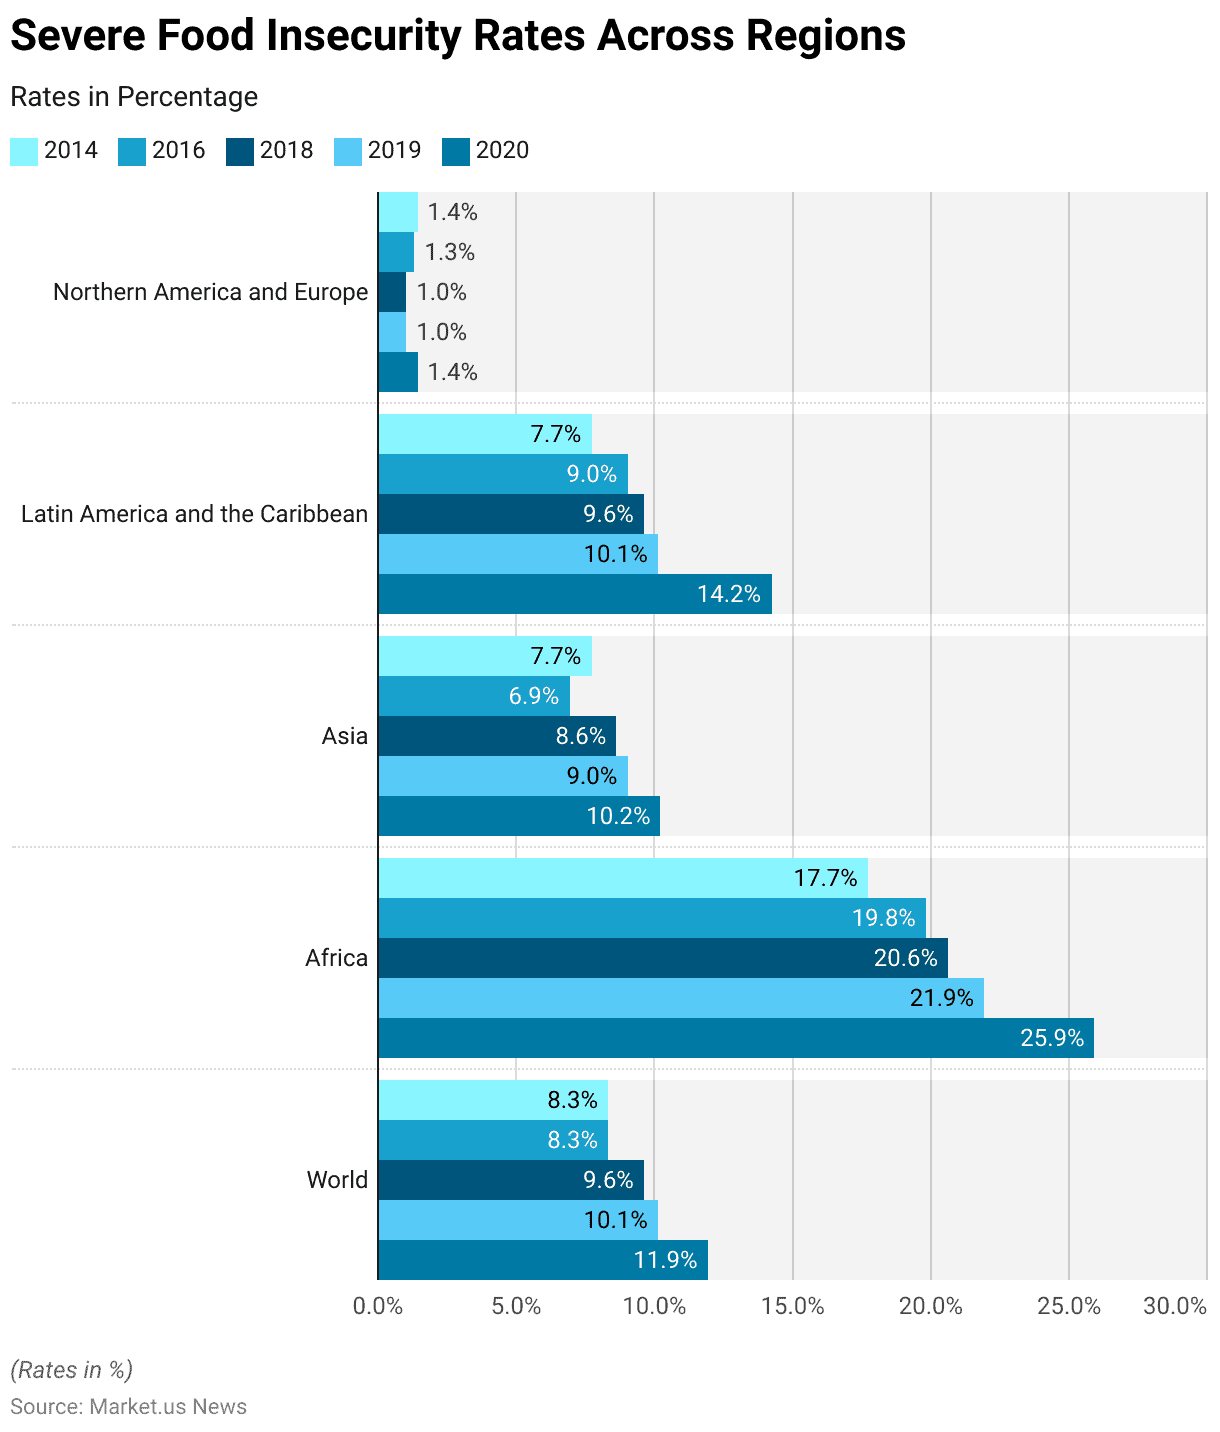
- Severe food insecurity rates varied across different regions over the years, with notable trends observed.
- In 2014, the global rate stood at 8.3%, with Africa experiencing the highest severity at 17.7%. Followed by Asia, Latin America, and the Caribbean at 7.7% each. Northern America and Europe had the lowest rate at 1.4%.
- By 2016, the global rate remained steady at 8.3%, with Africa witnessing a significant increase to 19.8%. Asia, Latin America, and the Caribbean saw slight declines to 6.9% and 9%, respectively, and Northern America and Europe maintained a low rate of 1.3%.
- In 2018, there was a notable rise in global severe food insecurity to 9.6%. Africa continued to experience the highest severity at 20.6%. Followed by Latin America the Caribbean, and Asia at 9.6% and 8.6%, respectively. While Northern America and Europe remained relatively stable at 1%.
- The trend persisted in 2019, with a global rate of 10.1%, with Africa still at the forefront at 21.9%, Latin America and the Caribbean and Asia at 10.1% and 9%, respectively, and Northern America and Europe at 1%.
- By 2020, global severe food insecurity escalated to 11.9%, with Africa bearing the brunt at 25.9%, followed by Latin America and the Caribbean at 14.2%, Asia at 10.2%, and Northern America and Europe at 1.4%.
- These figures underscore the persistent challenges faced in ensuring food security across regions. Highlighting the urgent need for targeted interventions and collaborative efforts to alleviate hunger and improve livelihoods globally.
(Source: FAO)
Food Security Statistics By Countries with High Nominal Food Inflation
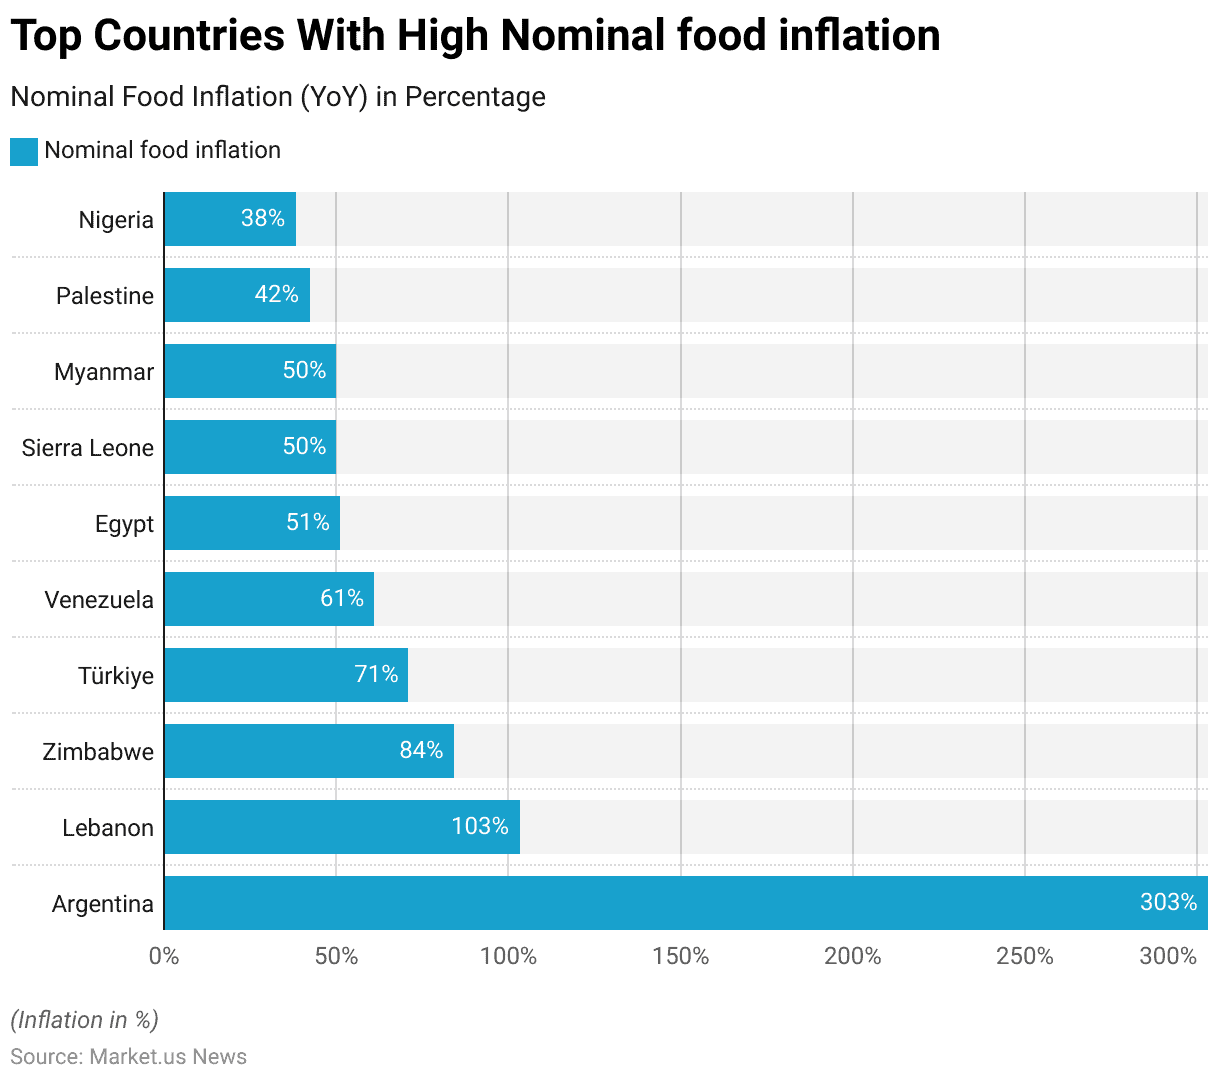
- During the period from November 2023 to February 2024, several countries experienced notable food price inflation. As reflected in their year-over-year percentage changes.
- Argentina topped the list with a staggering nominal food inflation rate of 303%. Followed by Lebanon at 103% and Zimbabwe at 84%.
- Türkiye (Turkey) and Venezuela also faced significant inflationary pressures, with rates of 71% and 61% respectively.
- Egypt, Sierra Leone, and Myanmar witnessed moderate but still substantial inflation rates of 51%, 50%, and 50% respectively.
- Additionally, Palestine and Nigeria rounded out the top 10 list with inflation rates of 42% and 38% respectively.
- These figures underscore the economic challenges faced by these nations during the specified timeframe. Highlighting the urgency of addressing food affordability and access issues within these regions.
(Source: World Bank)
Food Security Statistics By Threshold Values for the Prevalence of Undernourishment
- Threshold values for the prevalence of undernourishment and related indicators are categorized into five levels: Very low, Low, Medium, High, and Very high.
- In the category of undernourishment, prevalence rates below 5% are classified as Very low, while rates between 5% and less than 15% fall under the Low category.
- Prevalence rates ranging from 15% to less than 25% are categorized as Medium, those between 25% and less than 35% are considered High, and rates equal to or exceeding 35% are classified as Very high.
- Similarly, for child wasting, stunting, and mortality, prevalence rates below 2.5%, 2.5%, and 1%, respectively, are classified as Very low, while rates between 2.5% and less than 5% for wasting, 2.5%, and less than 10% for stunting, and 1% and less than 4% for mortality fall under the Low category.
- Medium prevalence rates range from 5% to less than 10% for wasting, 10% to less than 20% for stunting, and 4% to less than 7% for mortality.
- High prevalence rates range from 10% to less than 15% for wasting, 20% to less than 30% for stunting, and 7% to less than 10% for mortality.
- Finally, very high prevalence rates are equal to or exceed 15% for waste, 30% for stunting, and 10% for mortality.
- These categories provide a framework for assessing and addressing levels of undernourishment and related indicators across populations.
(Source: FAO)
Food Security Statistics By Global Hunger Index Scores in Regions
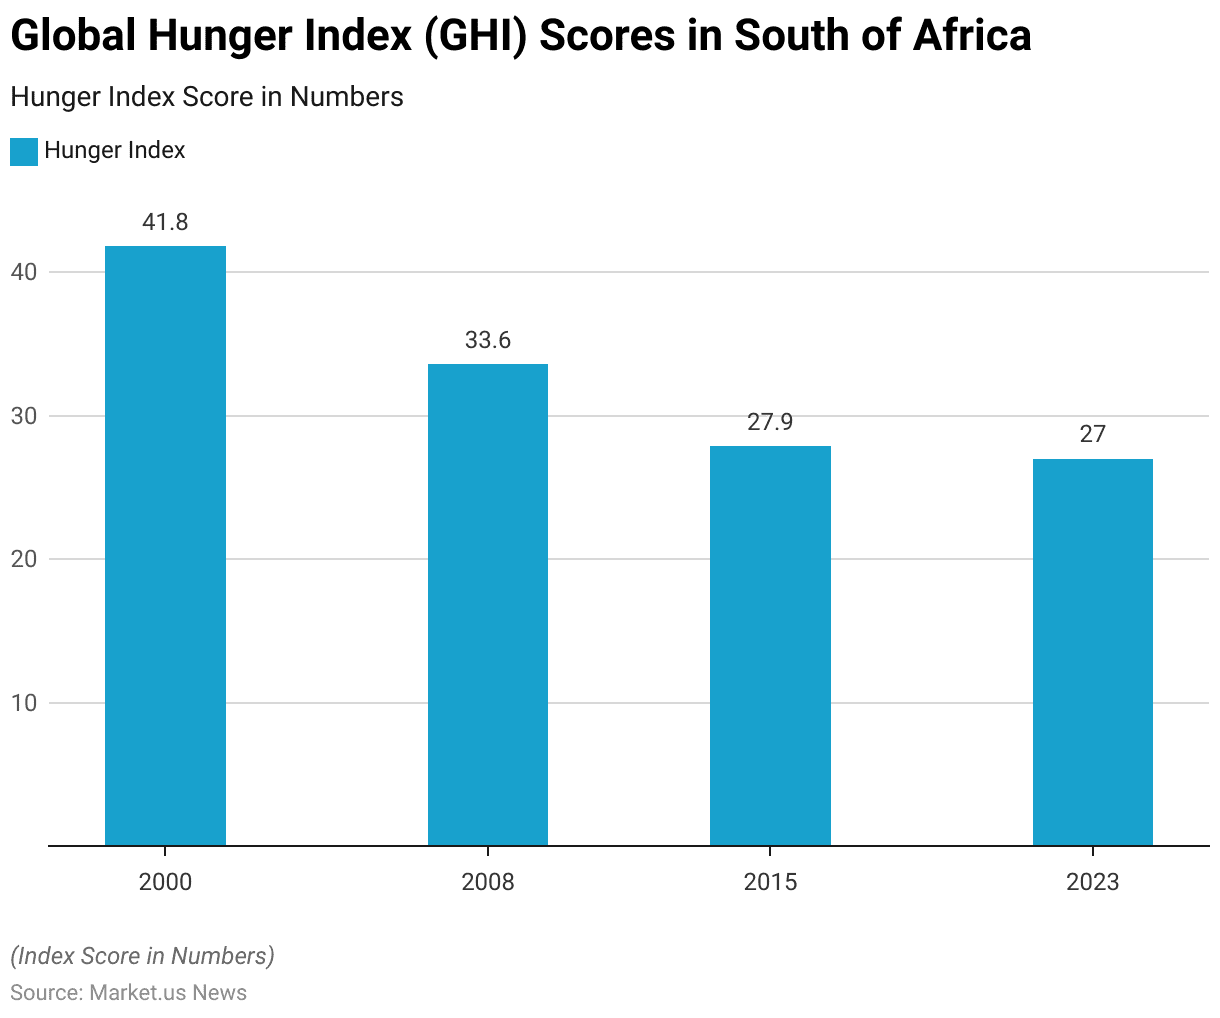
South of Africa
- The Global Hunger Index (GHI) scores in the southern region of Africa have exhibited a notable downward trend over the past two decades, reflecting concerted efforts to address food insecurity and malnutrition within the area.
- In 2000, the GHI score stood at 41.8, indicating significant challenges related to hunger prevalent across various nations in southern Africa.
- However, by 2008, there was a marked improvement, with the score declining to 33.6, signaling progress in combating hunger and its associated impacts.
- Subsequent years witnessed further advancements, with the score decreasing to 27.9 in 2015, showcasing continued momentum in alleviating hunger challenges across the region.
- Notably, by 2023, the GHI score reached 27.0, underscoring sustained progress and a steadfast commitment to enhancing food security and nutrition outcomes in the southern part of the African continent.
- This trend underscores the importance of coordinated efforts and targeted interventions aimed at eradicating hunger and promoting sustainable development within the region.
(Source: 2023 Global Hunger Index)
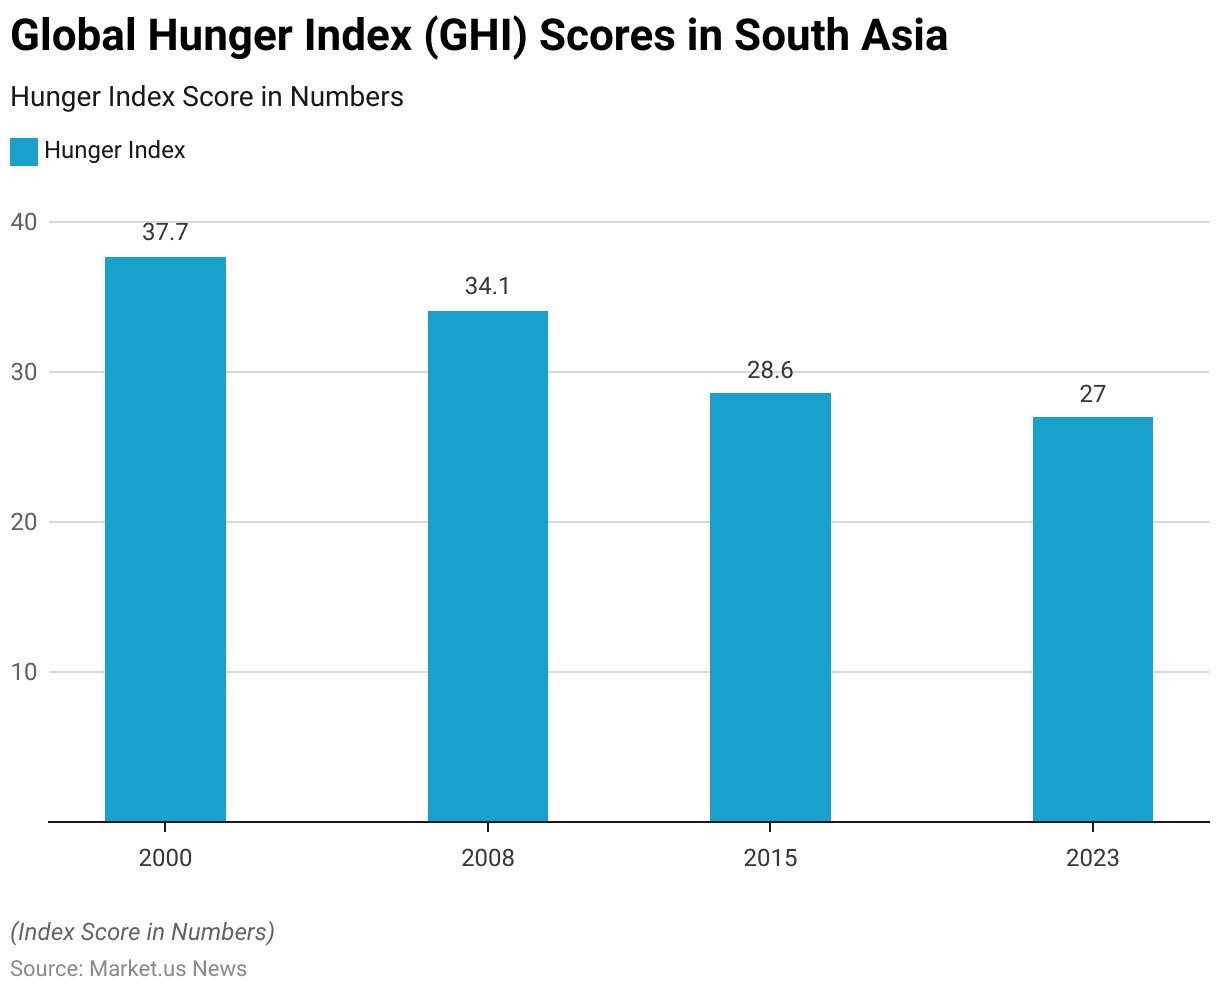
South Asia
- The Global Hunger Index (GHI) scores in South Asia have depicted a consistent downward trajectory over the past two decades, reflecting substantial strides in addressing food insecurity and malnutrition within the region.
- In 2000, the GHI score was recorded at 37.7, indicating significant challenges related to hunger prevalent across South Asian nations.
- However, by 2008, there was a notable improvement, with the score decreasing to 34.1, signifying progress in combating hunger and its associated impacts.
- Over the subsequent years, this positive trend continued, with the GHI score further declining to 28.6 in 2015, demonstrating sustained efforts in enhancing food security and nutritional outcomes.
- By 2023, the GHI score reached 27.0, underscoring continued advancements and a steadfast commitment to addressing hunger and promoting sustainable development throughout South Asia.
- This trend highlights the importance of coordinated initiatives and targeted interventions aimed at eradicating hunger and improving livelihoods across the region.
(Source: 2023 Global Hunger Index)
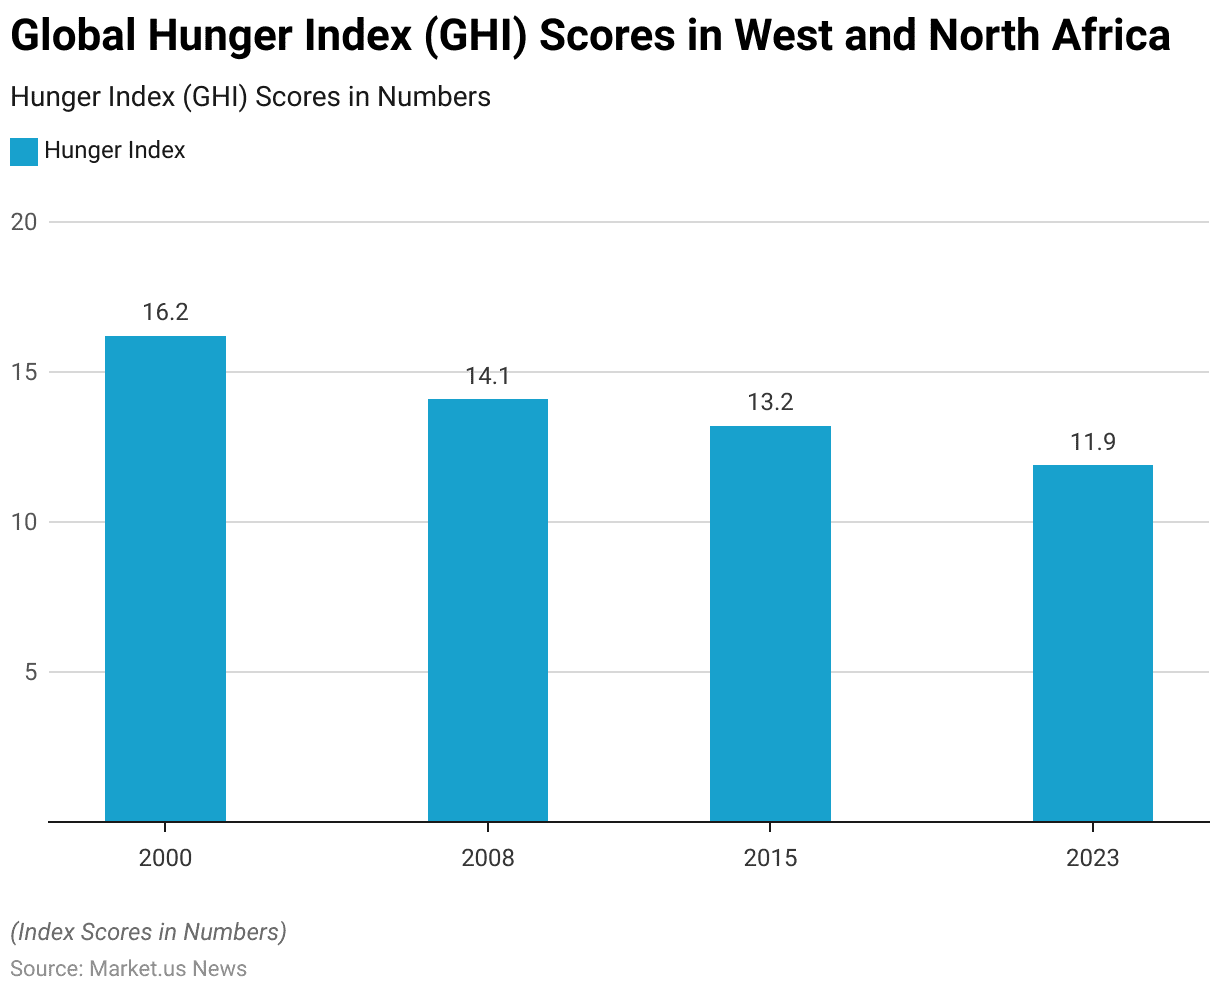
West and North Africa
- The Global Hunger Index (GHI) scores in West and North Africa have consistently demonstrated a downward trend over the past two decades, indicative of substantial progress in addressing food insecurity and malnutrition within the region.
- In 2000, the GHI score was notably low at 16.2, reflecting comparatively lower levels of hunger prevalent across various nations in West and North Africa.
- By 2008, there was a further improvement, with the score decreasing to 14.1, underscoring ongoing efforts to combat hunger and its associated challenges.
- Over subsequent years, this positive trend continued, with the GHI score declining to 13.2 in 2015, showcasing sustained momentum in alleviating hunger and improving nutritional outcomes.
- By 2023, the GHI score reached 11.9, highlighting continued progress and a steadfast commitment to enhancing food security and livelihoods within West and North Africa.
- This trend underscores the importance of coordinated interventions and targeted initiatives aimed at eradicating hunger and fostering sustainable development across the region.
(Source: 2023 Global Hunger Index)
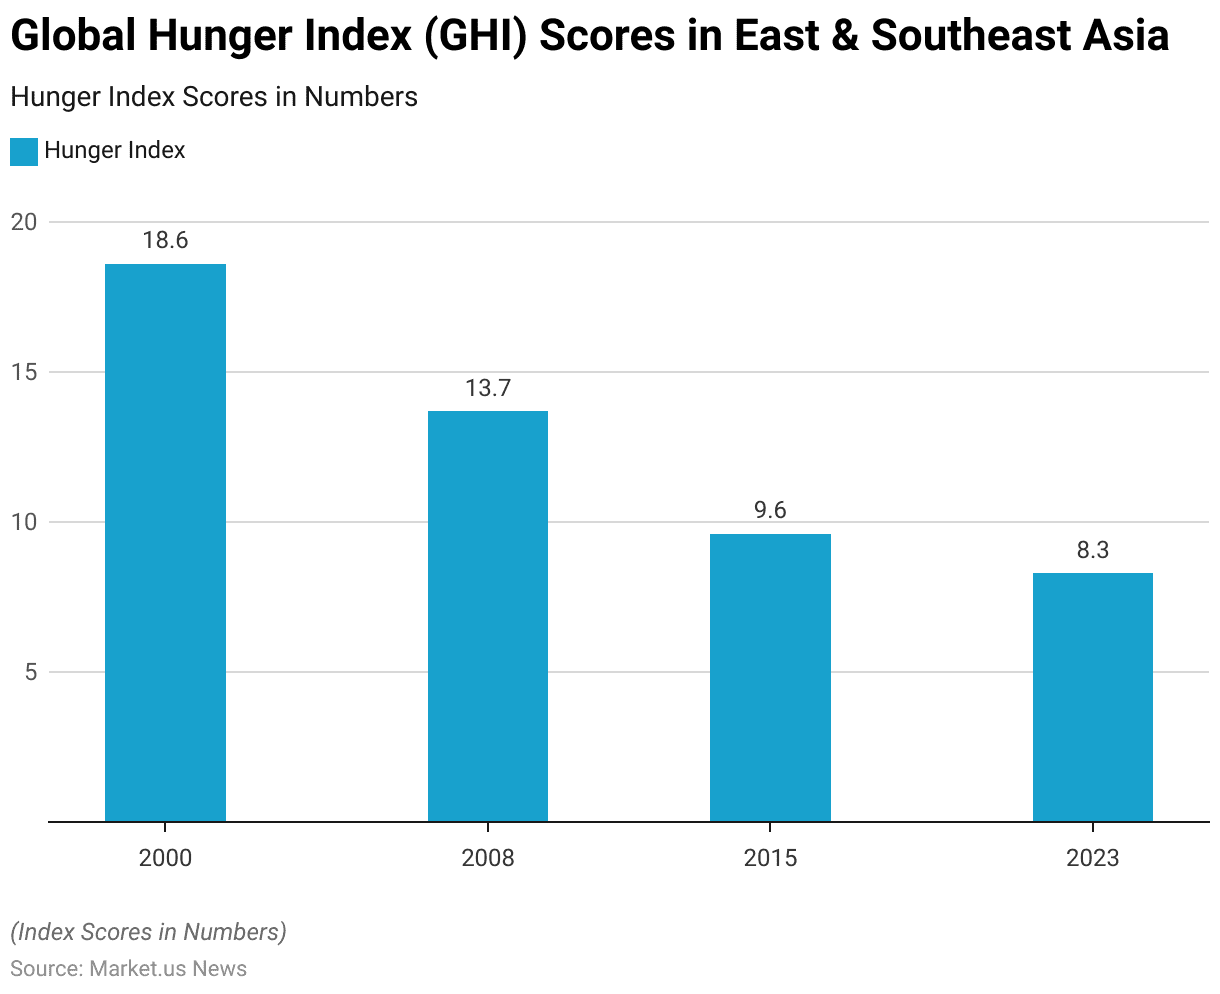
East and Southeast Asia
- The Global Hunger Index (GHI) scores in East and Southeast Asia have exhibited a consistent downward trend over the past two decades. Reflecting substantial progress in addressing food insecurity and malnutrition within the region.
- In 2000, the GHI score was relatively low at 18.6, indicating comparatively lower levels of hunger prevalent across various nations in East and Southeast Asia.
- By 2008, there was a significant improvement, with the score decreasing to 13.7, underscoring concerted efforts to combat hunger and its associated challenges.
- Over subsequent years, this positive trend continued, with the GHI score declining to 9.6 in 2015. Showcasing sustained momentum in alleviating hunger and improving nutritional outcomes.
- By 2023, the GHI score further decreased to 8.3, highlighting continued progress and a steadfast commitment to enhancing food security and livelihoods within East and Southeast Asia.
- This trend underscores the importance of coordinated interventions and targeted initiatives aimed at eradicating hunger and fostering sustainable development across the region.
(Source: 2023 Global Hunger Index)
Europe and Central Asia
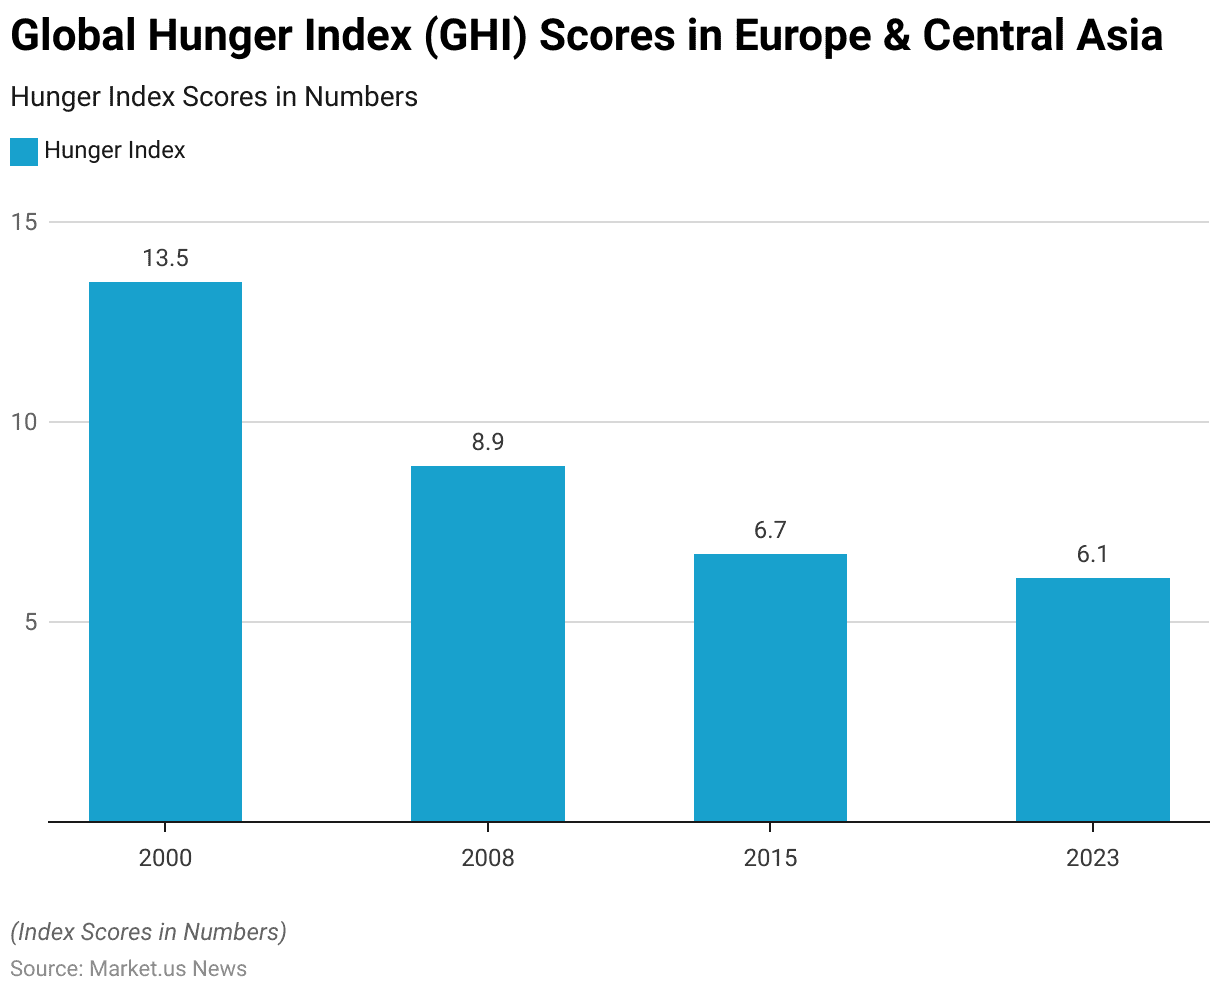
- The Global Hunger Index (GHI) scores in Europe and Central Asia have consistently depicted a downward trend over the past two decades. Signaling significant progress in addressing food insecurity and malnutrition within the region.
- In 2000, the GHI score was notably low at 13.5, indicating relatively minimal levels of hunger prevalent across various nations in Europe and Central Asia.
- By 2008, there was a substantial improvement, with the score decreasing to 8.9. Highlighting concerted efforts to combat hunger and its associated challenges.
- Over subsequent years, this positive trajectory continued. The GHI score further declined to 6.7 in 2015, showcasing sustained momentum in alleviating hunger and improving nutritional outcomes.
- By 2023, the GHI score reached 6.1, underscoring continued progress and a steadfast commitment to enhancing food security and livelihoods within Europe and Central Asia.
- This trend underscores the importance of coordinated interventions and targeted initiatives aimed at eradicating hunger and fostering sustainable development across the region.
(Source: 2023 Global Hunger Index)
Food Security Prevalence During COVID-19 Statistics
Food Security Prevalence During Early COVID-19 Statistics
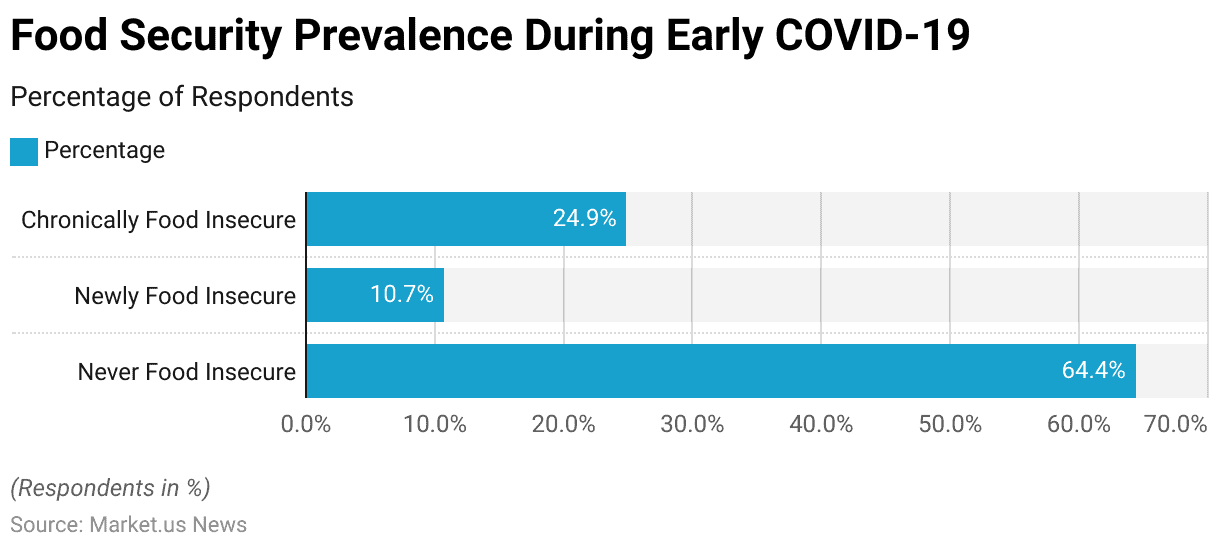
- During the early stages of the COVID-19 pandemic, a study on food security status among respondents revealed significant insights.
- Approximately 64.4% of respondents reported never experiencing food insecurity, indicating a majority had stable access to sufficient food.
- However, the pandemic introduced new challenges, as evidenced by 10.7% of respondents who became newly food insecure. Facing difficulties in accessing food for the first time due to the crisis.
- Additionally, 24.9% of participants were identified as chronically food insecure. Suggesting they had faced ongoing challenges with food access even before the pandemic began.
- This data highlights the varied impact of the early COVID-19 period on food security. Affecting individuals differently based on their prior conditions and the pandemic’s disruptions.
(Source: Nature)
Food Security Prevalence During Various Stages of COVID-19 Statistics
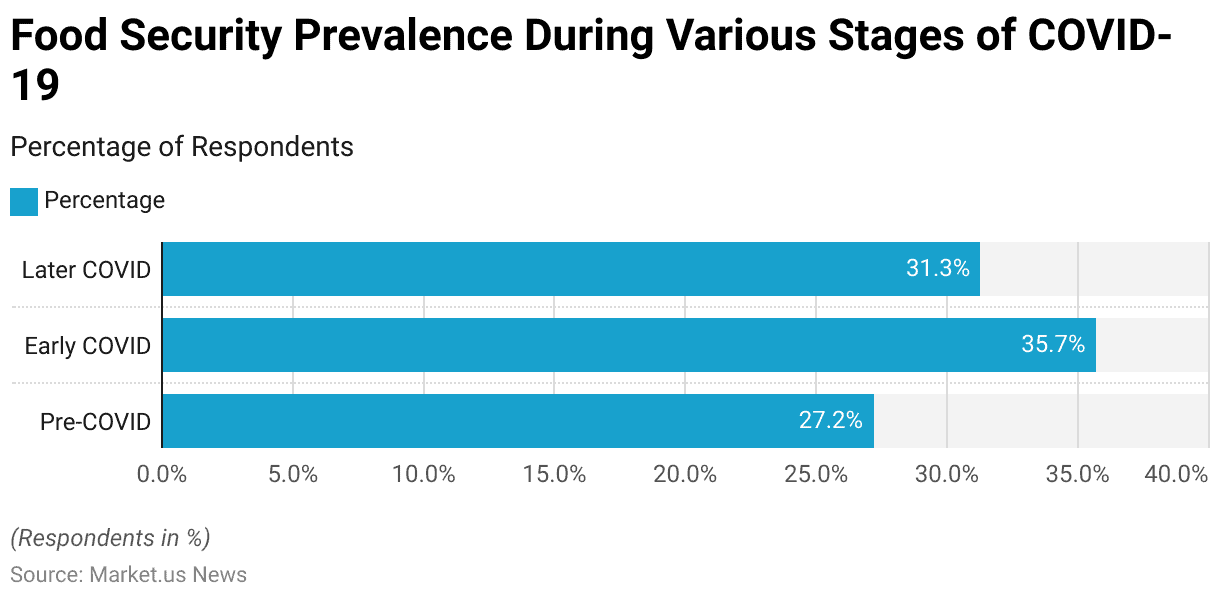
- The prevalence of food insecurity among respondents evolved through various stages of the COVID-19 pandemic, revealing a dynamic impact on access to sufficient food.
- Before the pandemic (Pre-COVID), 27.2% of respondents reported experiencing food insecurity, highlighting pre-existing challenges within communities.
- As the pandemic unfolded during its early stages, the rate of food insecurity significantly increased to 35.7%. Reflecting the immediate disruptions in food supply chains, economic downturns, and access issues that exacerbated the situation for many individuals.
- However, as the pandemic progressed into later stages, a slight decrease in food insecurity was observed. With 31.3% of respondents still reporting issues of access to adequate food.
- This decrease suggests a partial adaptation to the new conditions or the effectiveness of intervention measures. However, the rates remained higher than pre-pandemic levels, underscoring the lasting impact of COVID-19 on food security.
(Source: Nature)
Food Prices and Inflation Statistics
Monthly Food Price Index
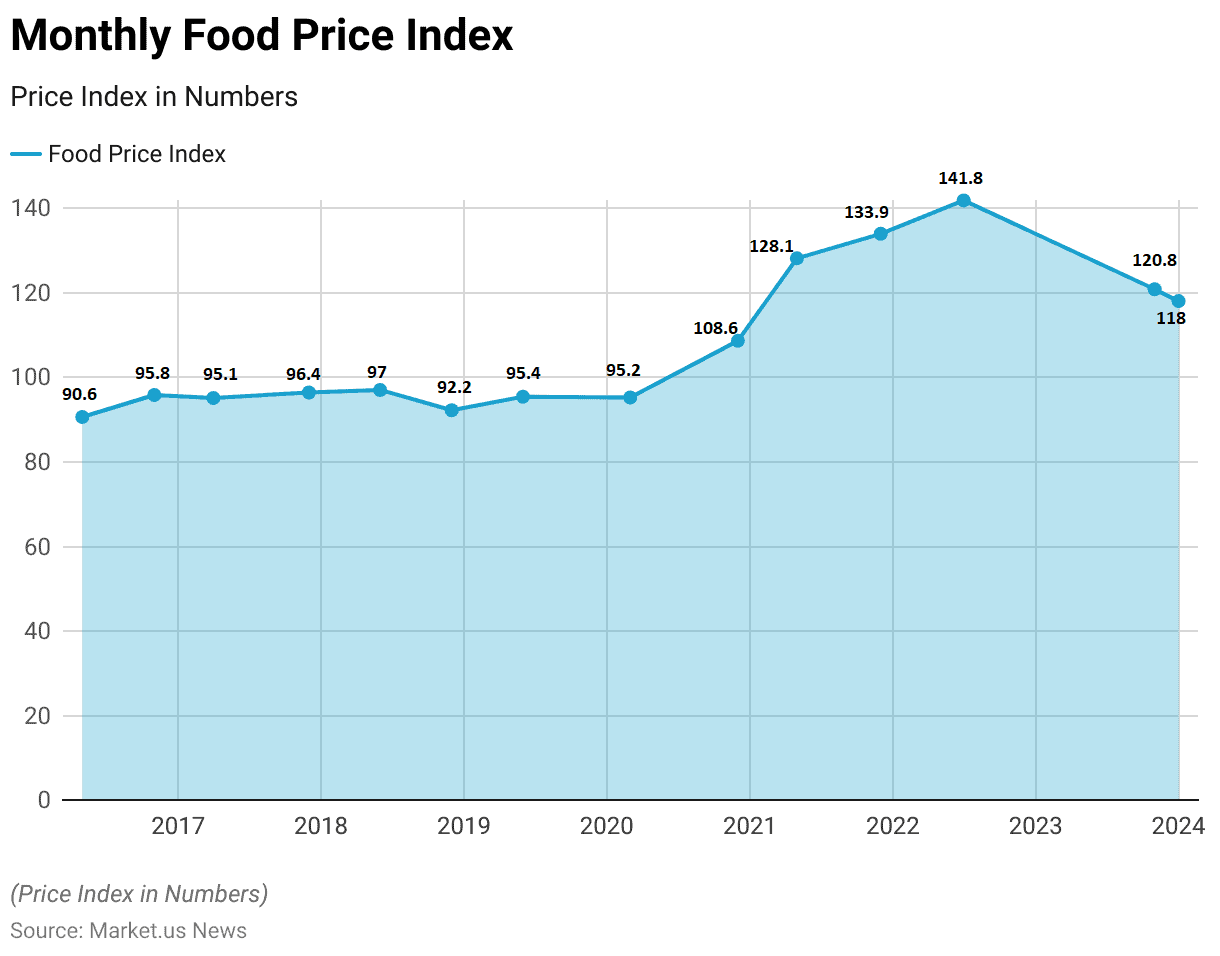
- The Food Price Index, reflecting the fluctuating costs of essential food items, has witnessed varied trends over the analyzed period.
- Beginning in May 2016 at a level of 90.6, the index demonstrated a gradual increase, reaching 95.8 by November 2016.
- However, by April 2017, a slight dip occurred, with the index at 95.1. Subsequently, a modest rise ensued, culminating in a peak of 108.6 in December 2020.
- This upward trajectory continued into 2021, with May recording a notable surge to 128.1 and December reaching a pinnacle of 133.9. However, by July 2022, the index showed signs of moderation, stabilizing at 141.8.
- Subsequent months witnessed a decline, with November 2023 registering 120.8 and January 2024 recording a level of 118.
- These fluctuations underscore the dynamic nature of food prices. Influenced by various factors such as supply chain disruptions, market demand, and economic conditions.
(Source: Statista)
Annual Food Security Price Index Worldwide – By Category Statistics
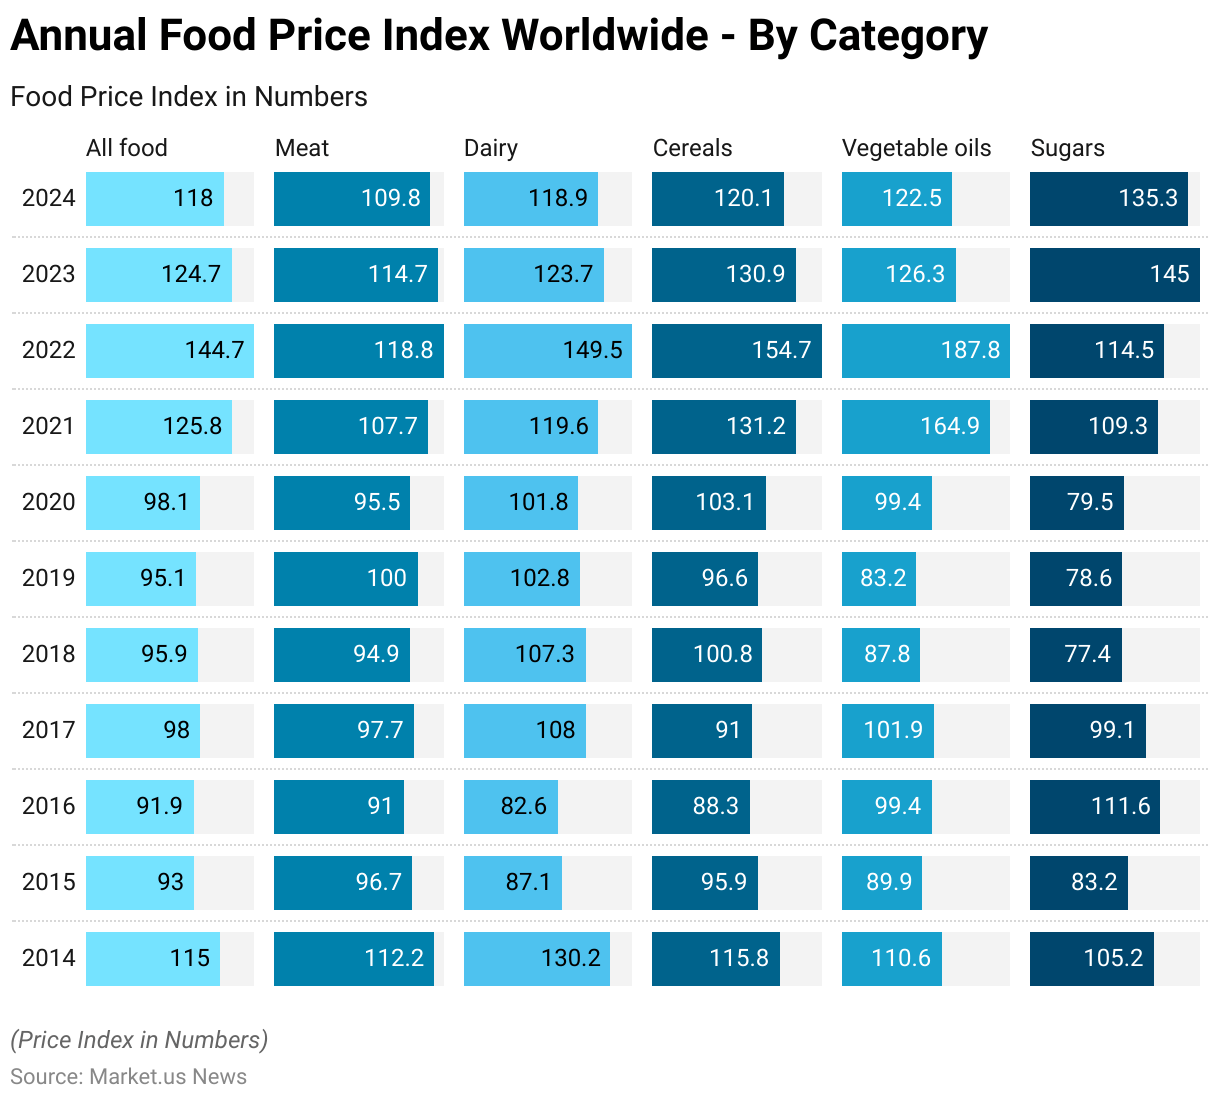
- The annual food price index worldwide, categorized by various food types, illustrates significant fluctuations from 2014 to 2024.
- Overall, the index for all food items stood at 115 in 2014, experiencing a decline to 93 in 2015 before stabilizing at 91.9 in 2016.
- Subsequent years witnessed fluctuations, with a peak of 144.7 recorded in 2022, followed by a decline to 118 in 2024.
- Among specific categories, meat prices started at 112.2 in 2014, fluctuating over the years and ending at 109.8 in 2024.
- Dairy products saw fluctuations, with a peak of 149.5 in 2022 and a slight decline to 118.9 in 2024.
- Cereal prices followed a similar pattern, reaching a peak of 154.7 in 2022 before descending to 120.1 in 2024.
- Vegetable oils experienced volatility, with a notable peak of 187.8 in 2022 and a subsequent decrease to 122.5 in 2024.
- Sugars displayed fluctuating trends, with a notable peak of 145 in 2023 before decreasing to 135.3 in 2024.
- These variations underscore the dynamic nature of food prices influenced by factors such as supply and demand, agricultural conditions, and economic fluctuations.
(Source: Statista)
Impact of Grain Prices and Shipping Costs on Food Prices – By Country Income Group
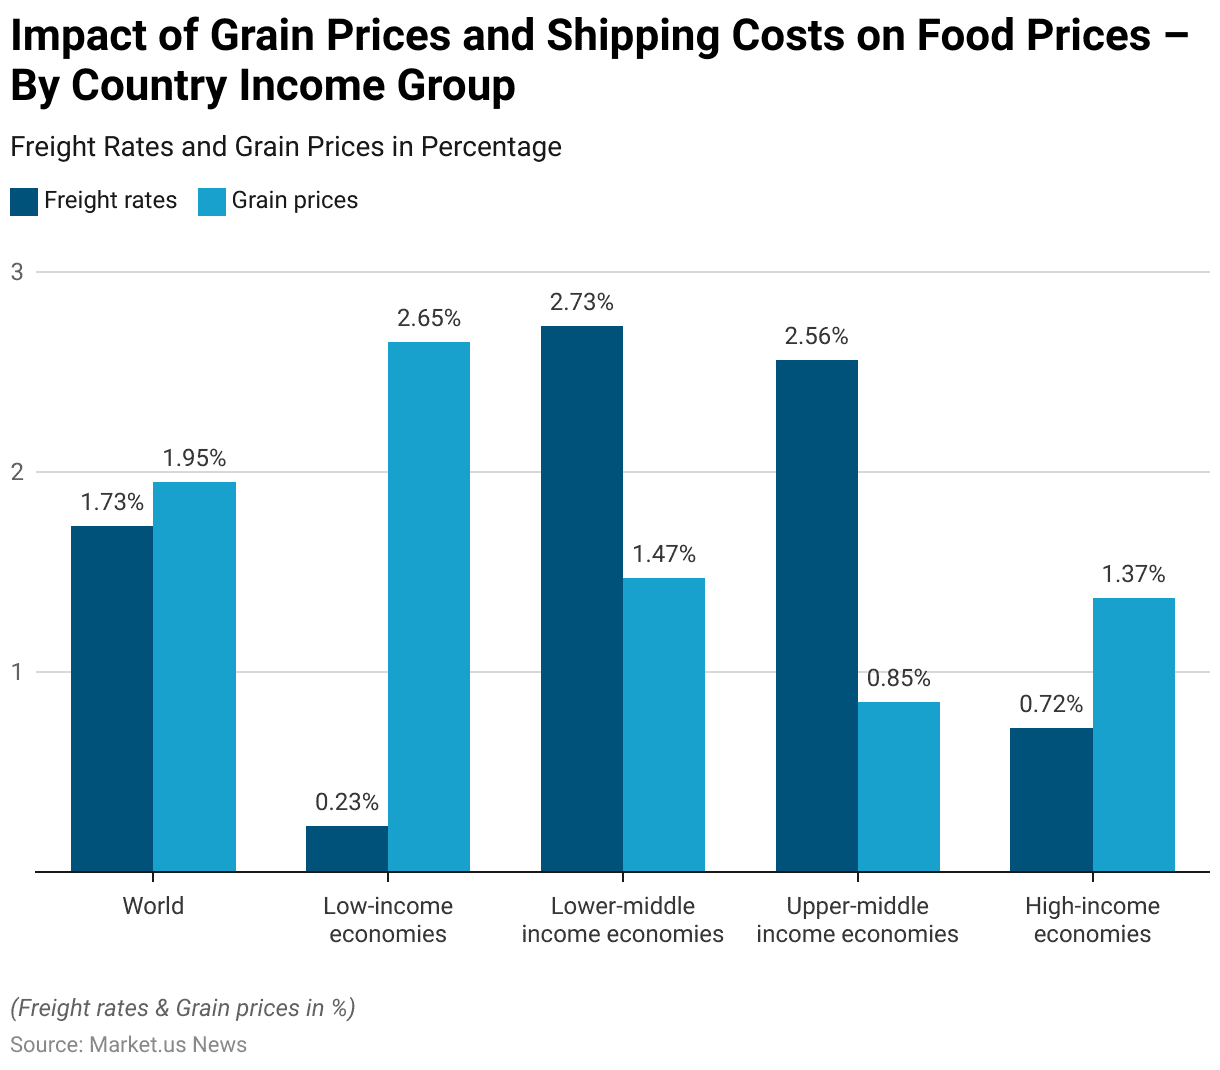
- In 2022, global food prices were significantly influenced by fluctuations in grain prices and shipping costs, varying across country income groups. Worldwide, freight rates increased by 1.73%, while grain prices rose by 1.95%.
- Low-income economies experienced a relatively lower impact from shipping costs. With an increase of only 0.23%, but faced a substantial rise in grain prices at 2.65%.
- In contrast, lower-middle-income economies encountered a significant surge in freight rates at 2.73%, coupled with a more moderate increase in grain prices at 1.47%.
- Similarly, upper-middle-income economies saw a notable rise in shipping costs at 2.56% yet benefited from a relatively lower increase in grain prices at 0.85%.
- High-income economies, on the other hand, experienced a comparatively modest impact from both freight rates. Which increased by 0.72%, and grain prices, which rose by 1.37%.
- These fluctuations underscore the complex interplay between global trade dynamics. Agricultural production, and economic conditions, shaping food prices on a worldwide scale.
(Source: Statista)
Initiatives and Projects to Combat Food Security Concerns Statistics
- IDA has given $95 million to support Malawi’s Agriculture Commercialization Project (AGCOM), focusing on boosting the commercialization of specific agriculture products and aiding quick responses to crises.
- Additionally, Madagascar received $200 million from IDA. This funding aims to improve decentralized services, enhance water supply, conserve landscapes, and strengthen food and livelihood systems in the drought-prone ‘Grand Sud’ region.
- A $60 million credit has been allocated for the Integrated Community Development Project in four northern provinces of Burundi. This initiative targets refugees and host communities, aiming to enhance food and nutrition security, develop socio-economic infrastructure, and promote micro-enterprise through a participatory approach.
- The $50 million Emergency Food Security Response project has assisted 329,000 smallholder farmers in the Central African Republic by providing them with seeds, farming tools, and training in agricultural and post-harvest methods. This initiative seeks to improve crop yields and bolster resilience against climate and conflict-related challenges.
- A $150 million grant has been allocated for the second phase of the Yemen Food Security Response and Resilience Project. This funding aims to tackle food insecurity, enhance resilience, and safeguard livelihoods.
(Source: World Bank)
Recent Developments
Acquisitions and Mergers:
- In the past quarter, the food industry witnessed notable acquisitions and mergers aimed at strengthening market positions and enhancing operational efficiency.
- A prominent merger between two leading food distribution companies resulted in a combined market share increase of 15%, consolidating their presence in key regions.
New Product Launches:
- Several companies introduced innovative food products catering to diverse consumer preferences and dietary needs.
- Plant-based food alternatives experienced a surge in new launches, with a 30% increase compared to the previous year, reflecting growing consumer demand for sustainable and healthier options.
Funding Initiatives:
- Start-ups focused on addressing food security challenges secured substantial funding to scale their operations and develop impactful solutions.
- Agri-tech companies received an influx of investment, totaling over $200 million. To fuel research and development efforts aimed at enhancing crop yields and reducing food wastage.
Government Initiatives:
- Governments globally intensified efforts to tackle food insecurity, with increased funding allocated towards nutrition programs and agricultural development.
- The implementation of sustainable farming practices received significant support. With government grants totaling $500 million distributed to farmers adopting environmentally-friendly techniques.
Technological Advancements:
- Advancements in food technology played a pivotal role in improving food security outcomes. With the adoption of precision agriculture and blockchain solutions witnessing notable growth.
- IoT-enabled sensors and data analytics contributed to a 25% reduction in post-harvest losses, bolstering supply chain resilience and ensuring food accessibility.
Market Expansion Strategies:
- Leading food retailers expanded their market presence through strategic partnerships and entry into new geographical markets.
- E-commerce platforms witnessed a surge in food sales, with a 40% increase in online grocery purchases compared to the same period last year. Reflecting shifting consumer preferences towards convenience and digitalization.
Impact of Global Events:
- The ongoing COVID-19 pandemic continued to exert significant pressure on global food security, with disruptions to supply chains and income loss exacerbating existing vulnerabilities.
- Despite challenges, international organizations collaborated with governments and NGOs to implement emergency food assistance programs. Reaching over 100 million people in food-insecure regions.
Sustainability Initiatives:
- The adoption of sustainable practices across the food supply chain gained momentum, driven by consumer awareness and regulatory mandates.
- Food retailers are committed to reducing carbon emissions and plastic packaging usage, with a collective goal of achieving a 20% reduction by 2025. Fostering a more environmentally-conscious industry ecosystem.
Conclusion
Food Security Statistics – In summary, food security remains a complex global challenge, particularly highlighted by the COVID-19 pandemic.
The pandemic has exacerbated existing vulnerabilities, disproportionately affecting marginalized communities and worsening pre-existing food insecurity.
However, it has also demonstrated the resilience of food systems and the importance of proactive interventions.
Addressing food security requires a comprehensive approach involving immediate relief efforts and long-term strategies tackling underlying issues like poverty, inequality, and climate change.
Collaboration between governments, international organizations, NGOs, and the private sector is crucial to develop sustainable solutions, promote equity, and ensure everyone’s right to food.
Prioritizing food security is essential for global development, and public health is crucial for building a more equitable and resilient future in the post-pandemic era.
FAQs
Food security refers to the availability, access, utilization, and stability of food, ensuring that all individuals have reliable access to sufficient, safe, and nutritious food to maintain a healthy and active life.
Food security is essential for promoting health, economic stability, and social well-being. Access to an adequate and nutritious diet is fundamental for individual development and societal progress.
Food insecurity can arise from various factors, including poverty, inequality, conflict, climate change, natural disasters, and inadequate access to resources such as land, water, and education.
Food insecurity is measured using indicators such as the prevalence of undernourishment. The Food Insecurity Experience Scale (FIES), the Global Hunger Index (GHI), and national surveys assessing food access, availability, and utilization.
Food insecurity can lead to malnutrition, poor health outcomes, reduced productivity, economic instability, social unrest, and exacerbation of poverty cycles, impacting individuals, communities, and entire nations.
Discuss your needs with our analyst
Please share your requirements with more details so our analyst can check if they can solve your problem(s)