

Table of Contents
Introduction
According to Apparel Statistics, The basics segment in the apparel industry, covering essentials such as t-shirts and casual wear plays a crucial role in the global economy. This sector spans from mass to premium markets, meeting diverse consumer needs for affordability and quality.
It’s evolving under the influence of sustainability trends, technological advances in materials, and global supply dynamics. The demand for eco-friendly products, direct-to-consumer sales, personalization, and athleisure wear is prominent.
Despite facing issues like fluctuating material costs and ethical production challenges, the segment offers ample opportunities for innovation in design and sustainability, particularly in burgeoning markets.
The resilience and adaptability of the basic apparel sector, propelled by consumer preferences and tech advancements, underscore its importance in the broader apparel industry’s growth.
Editor’s Choice
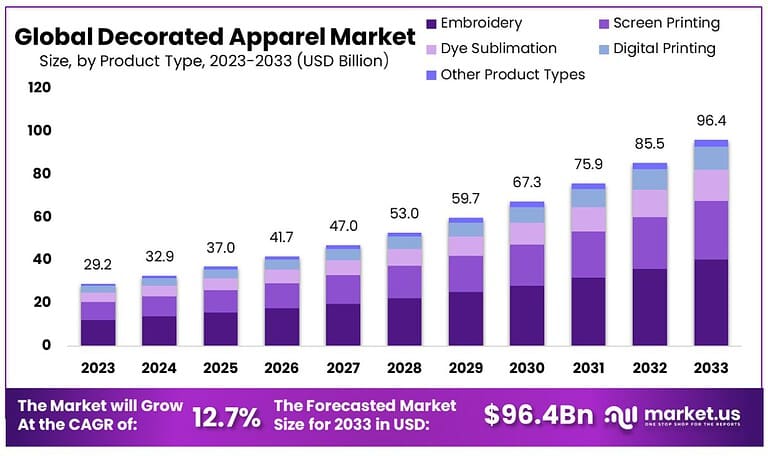
- The Global Decorated Apparel Market size is expected to be worth around USD 96.4 Billion by 2033, from USD 29.2 Billion in 2023, growing at a CAGR of 12.7% during the forecast period from 2024 to 2033.
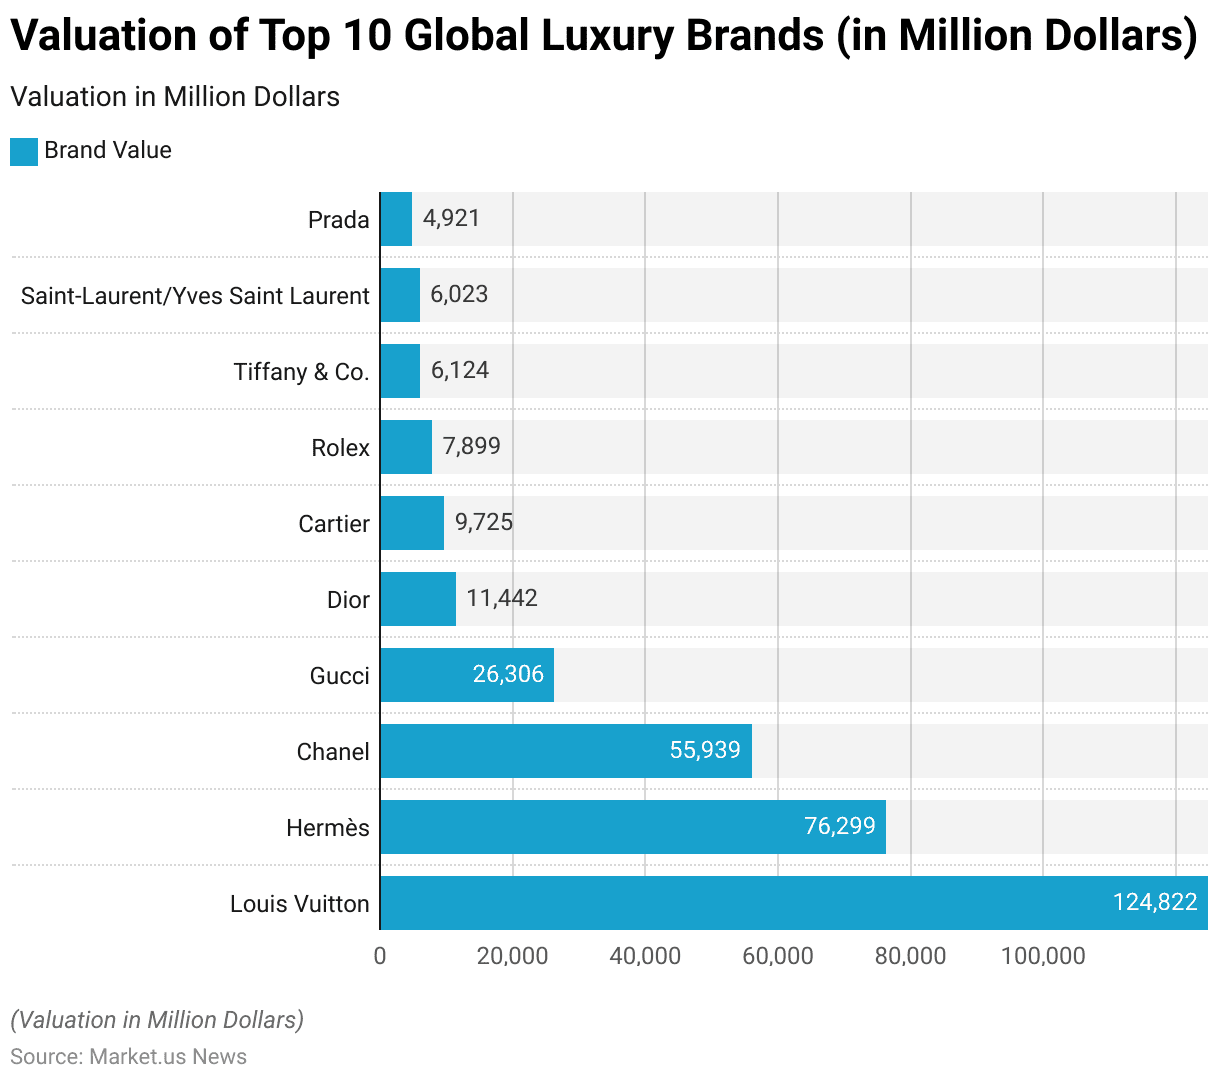
- Louis Vuitton, headquartered in France, leads the luxury brand valuation with an impressive figure of USD 124,822 million, underscoring its unparalleled market dominance and global recognition.
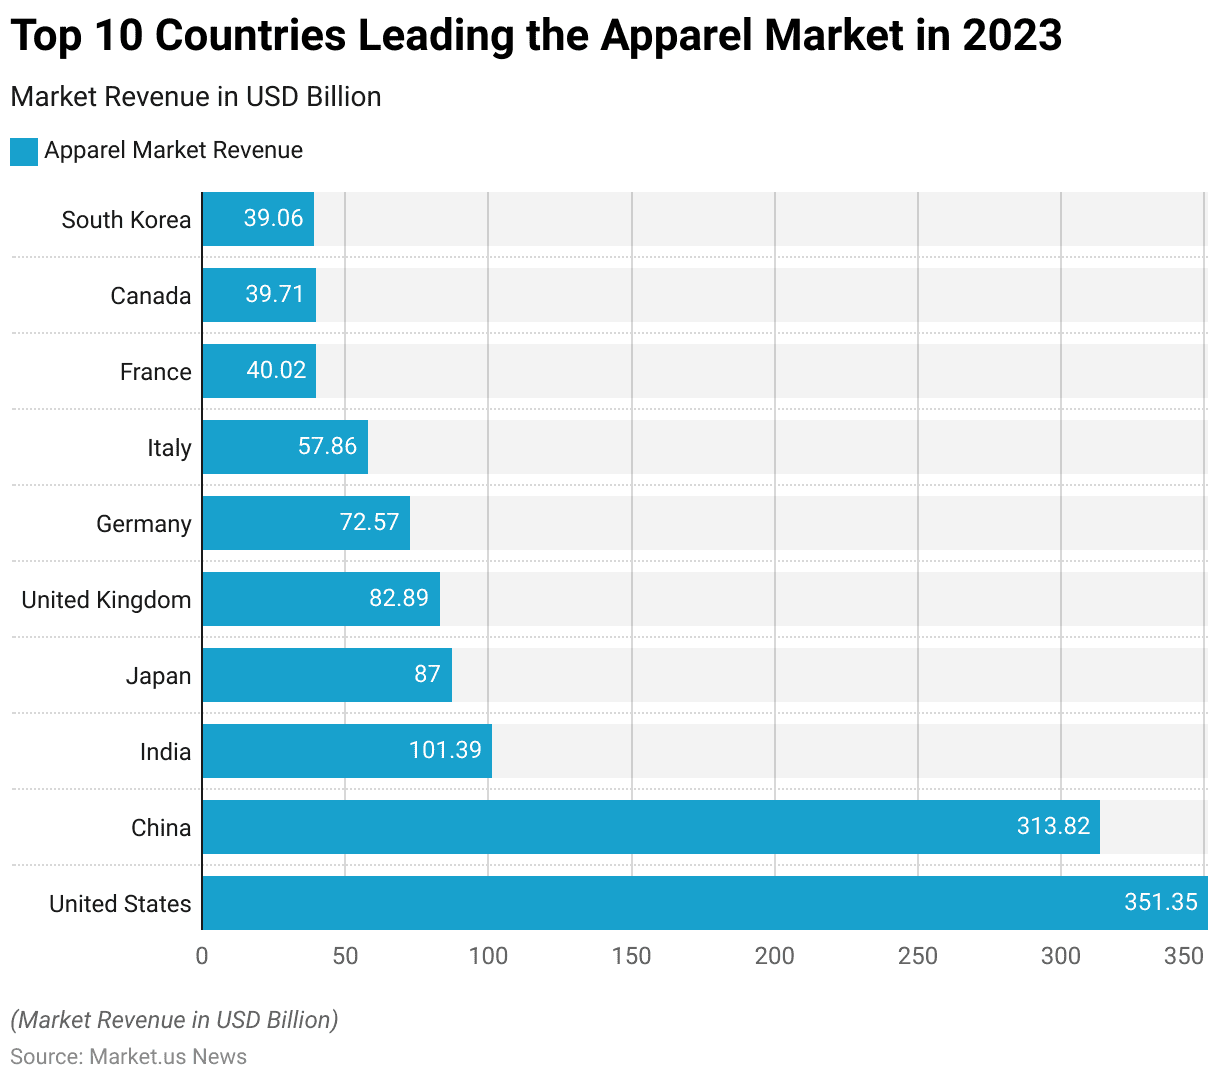
- The United States stands at the pinnacle of the global apparel market, generating a staggering revenue of USD 351.35 billion in 2023. This positions it as the unequivocal leader in the apparel sector, reflecting its massive consumer base and robust retail ecosystem.
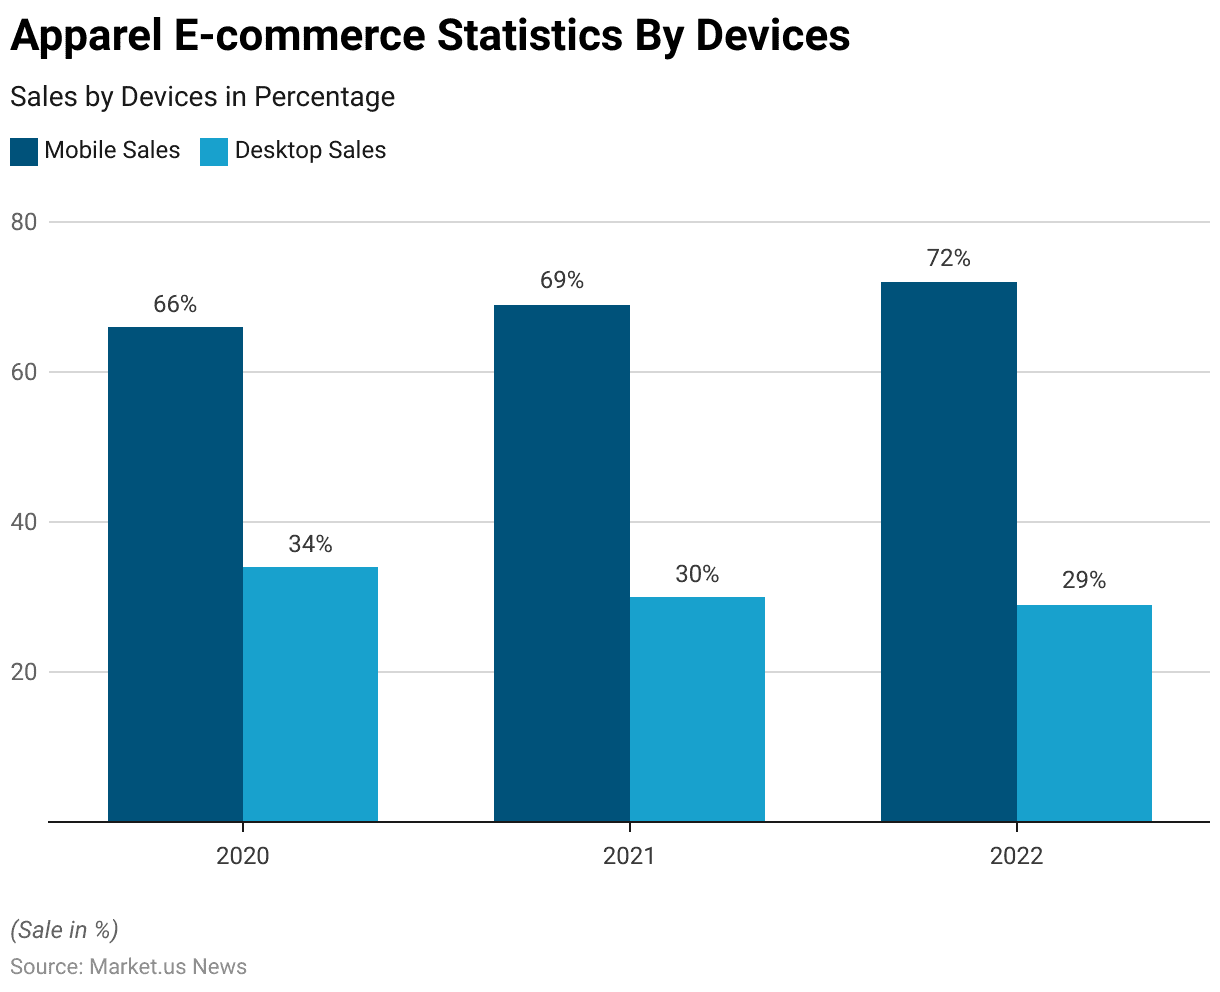
- In 2020, mobile sales constituted 66% of the total e-commerce sales in the fashion industry, signifying a dominant start over desktop sales, which accounted for 34%. This indicates the onset of mobile’s predominance in the digital shopping experience.
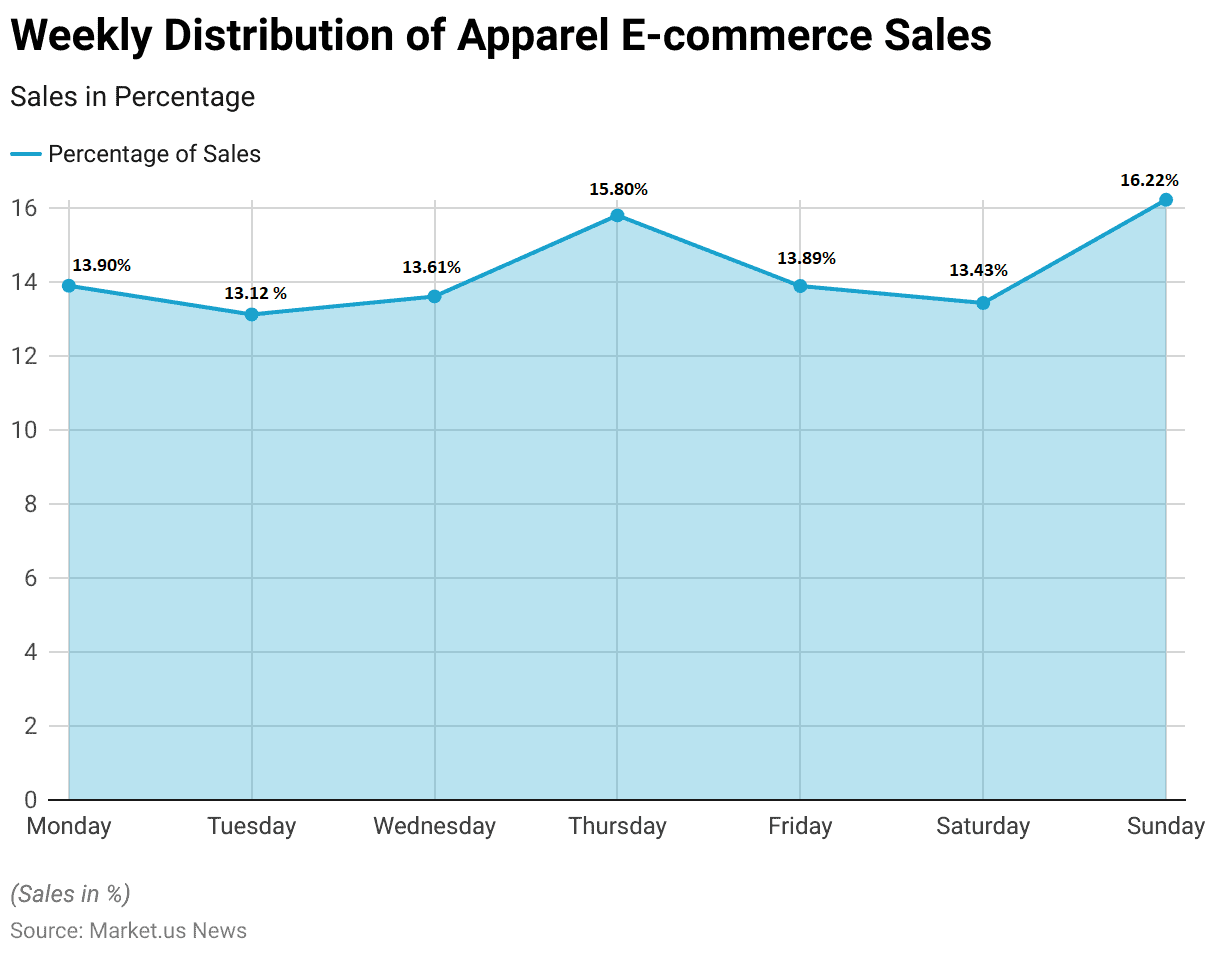
- Monday kicks off the week with a notable 13.90% of total fashion e-commerce sales, indicating a strong start as consumers engage in shopping activities perhaps following weekend browsing.
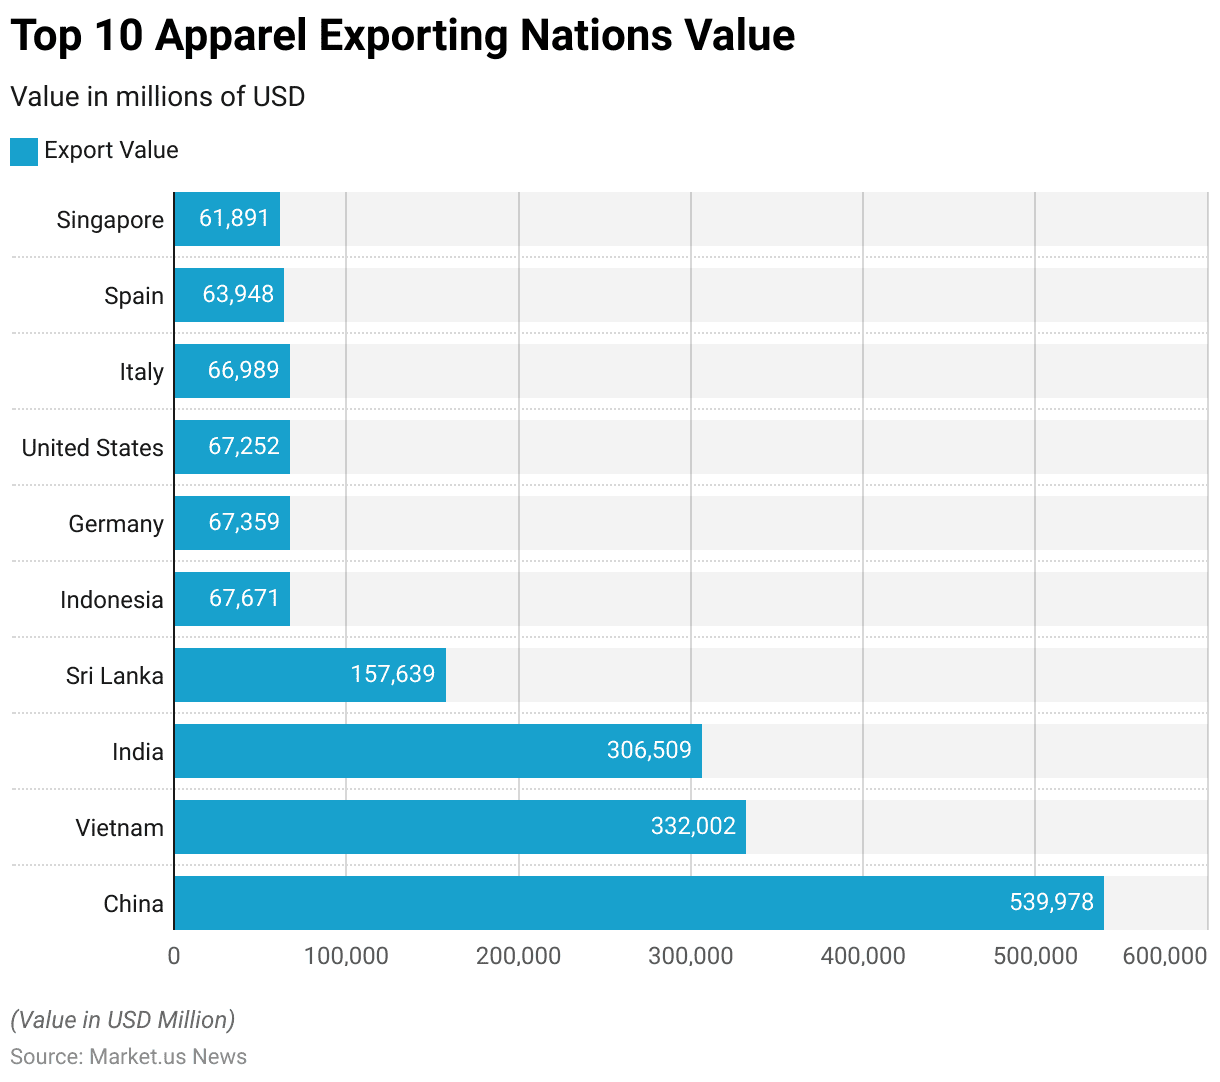
- China leads with an export value of 539,978 million USD, showcasing its dominance in global exports across various sectors.
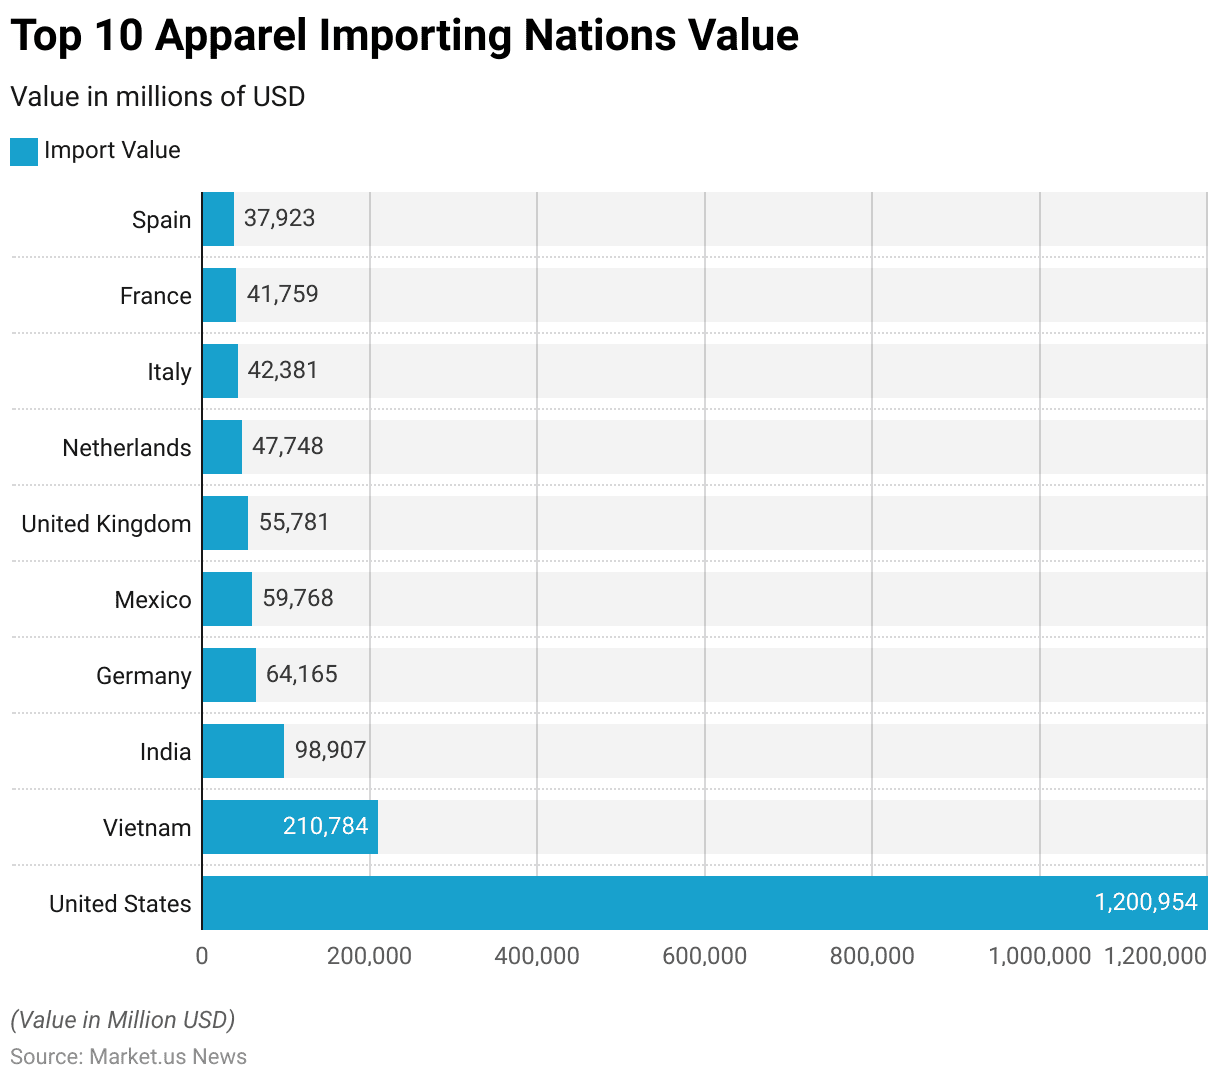
- United States leads with a staggering import value of 1,200,954 million USD, reflecting its position as one of the world’s largest importers across various industries.
Global Apparel Market Overview
Top 10 Most Valuable Luxury Brands Globally
- Louis Vuitton, headquartered in France, leads the luxury brand valuation with an impressive figure of USD 124,822 million, underscoring its unparalleled market dominance and global recognition.
- Hermès, also based in France, has a brand value of USD 76,299 million, reflecting its esteemed position in the luxury goods sector, which is celebrated for craftsmanship and timeless designs.
- Chanel, another iconic French brand, boasts a valuation of USD 55,939 million, indicative of its enduring influence and legacy in fashion and luxury.
- Gucci, representing Italy’s contribution to the luxury market, holds a brand value of USD 26,306 million, showcasing its innovative designs and strong brand identity.
- Dior, with its rich heritage in haute couture, is valued at USD 11,442 million, highlighting France’s significant role in shaping luxury fashion narratives.
- Cartier, known for its exquisite jewelry and watches, contributes to France’s luxury reputation with a brand value of USD 9,725 million.
- Rolex, based in the United Kingdom, has a brand value of USD 7,899 million, symbolizing its status as a timeless symbol of prestige and precision in the watchmaking industry.
Top 10 Countries Leading the Apparel Market
- The United States stands at the pinnacle of the global apparel market, generating a staggering revenue of USD 351.35 billion in 2023. This positions it as the unequivocal leader in the apparel sector, reflecting its massive consumer base and robust retail ecosystem.
- China follows closely, with an apparel market revenue of USD 313.82 billion in 2023. China’s significant manufacturing capacity, coupled with a growing middle class, underscores its critical role in both production and consumption within the global apparel landscape.
- India emerges as a key player with a revenue of USD 101.39 billion, highlighting its rapidly expanding market driven by an increasing population, rising disposable incomes, and a burgeoning fashion consciousness among its citizens.
- Japan, with an apparel market revenue of USD 87.00 billion, showcases its refined fashion sense and high consumer spending power, marking it as a vital market for luxury and high-end apparel brands.
- The United Kingdom, generating USD 82.89 billion in revenue, reflects its strong retail sector and the presence of globally recognized fashion brands, underpinning its significant contribution to the global apparel market.
- Germany’s apparel market, with revenue of USD 72.57 billion, indicates the country’s robust economic framework and consumer preference for quality and sustainability, emphasizing its position in the European apparel market.
Apparel E-commerce Statistics
By Device
- In 2020, mobile sales constituted 66% of the total e-commerce sales in the fashion industry, signifying a dominant start over desktop sales, which accounted for 34%.
- The following year, 2021, saw a further increase in mobile sales, which rose to 69%, while desktop sales dipped to 30%.
- The gap widened in 2022, with mobile sales climbing to 72%, nearly three-quarters of all fashion e-commerce sales, while desktop sales continued to decrease, settling at 29%.
Trends by Weekly distribution
- Monday kicks off the week with a notable 13.90% of total fashion e-commerce sales, indicating a strong start as consumers engage in shopping activities perhaps following weekend browsing.
- Tuesday sees a slight dip to 13.12%, suggesting a potential normalization of consumer purchasing patterns after the beginning of the workweek.
- Midweek, on Wednesday, there’s a marginal increase to 13.61%, which could indicate mid-week marketing efforts or promotions catching shopper interest.
- Thursday shows a significant spike, claiming the highest weekday percentage at 15.80%, possibly reflecting payday patterns or the anticipation of upcoming weekend events.
- Friday’s share is at 13.89%, slightly down from Thursday’s peak but still robust, as consumers may make last-minute purchases for the weekend.
- Saturday experiences a further reduction to 13.43%, which might be attributed to people spending less time online and more time in physical retail environments or enjoying weekend leisure activities.
- The week concludes with Sunday recording the highest percentage of the week at 16.22%.
Online Sales of Apparel
Consumer Segment
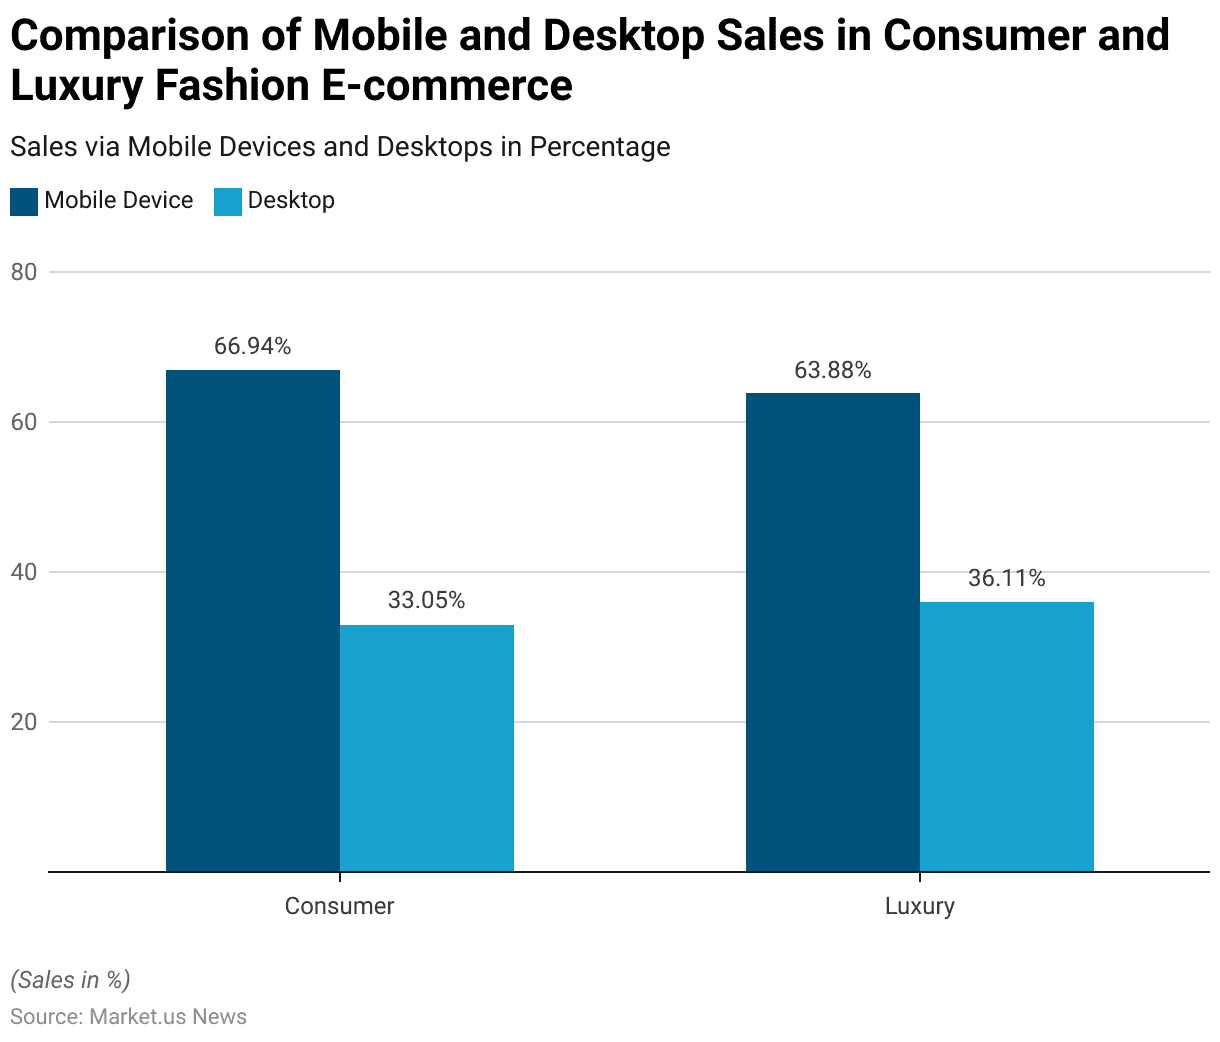
- Mobile Device: Within the consumer segment of fashion e-commerce, mobile devices play a dominant role, accounting for a significant majority of online sales at 66.94%.
- Desktop: While mobile devices lead in terms of sales, desktop usage remains relevant, representing a notable portion of online sales at 33.05%.
Luxury Segment
- Mobile Device: In the luxury segment of fashion e-commerce, mobile devices also play a significant role, accounting for a substantial portion of online sales at 63.88%.
- Desktop: While mobile devices dominate in terms of sales, desktop usage remains noteworthy within the luxury segment, representing a considerable share of online sales at 36.11%.
Top 10 Apparel Exporting Nations
- China leads with an export value of 539,978 million USD, showcasing its dominance in global exports across various sectors.
- Vietnam follows closely behind China, with an export value of 332,002 million USD, reflecting its significant role in international trade, particularly in textiles, electronics, and agriculture.
- India ranks third with an export value of 306,509 million USD, highlighting its diverse export portfolio ranging from textiles and pharmaceuticals to software services.
- Sri Lanka represents a notable exporter with an export value of 157,639 million USD, largely driven by its textile and apparel industry.
- Indonesia contributes significantly, with an export value of 67,671 million USD, primarily driven by its natural resources, manufacturing, and agriculture sectors.
- Germany maintains a strong position with an export value of 67,359 million USD, underscoring its status as an industrial powerhouse renowned for high-quality engineering and automotive products.
- United States demonstrates its global presence with an export value of 67,252 million USD, driven by a diverse range of industries, including technology, aerospace, and agriculture.
Top 10 Apparel Importing Nations
- United States leads with a staggering import value of 1,200,954 million USD, reflecting its position as one of the world’s largest importers across various industries.
- Vietnam follows with a significant import value of 210,784 million USD, indicating its role as an emerging market with increasing demand for imported goods, particularly in textiles, electronics, and machinery.
- India ranks third with an import value of 98,907 million USD, highlighting its diverse import requirements ranging from crude oil and electronics to machinery and precious metals.
- Germany maintains a strong position with an import value of 64,165 million USD, showcasing its reliance on imported goods to support its manufacturing and industrial sectors.
- Mexico contributes significantly, with an import value of 59,768 million USD, driven by its close economic ties with the United States and its role as a major exporter of automotive, electronics, and machinery products.
- United Kingdom exhibits a substantial import value of 55,781 million USD, reflecting its position as a major trading partner within the European Union and globally.
- Netherlands shows resilience with an import value of 47,748 million USD, largely driven by its role as a transportation and logistics hub in Europe, facilitating trade between European nations and beyond.
Consumer Trends in Apparel Statistics
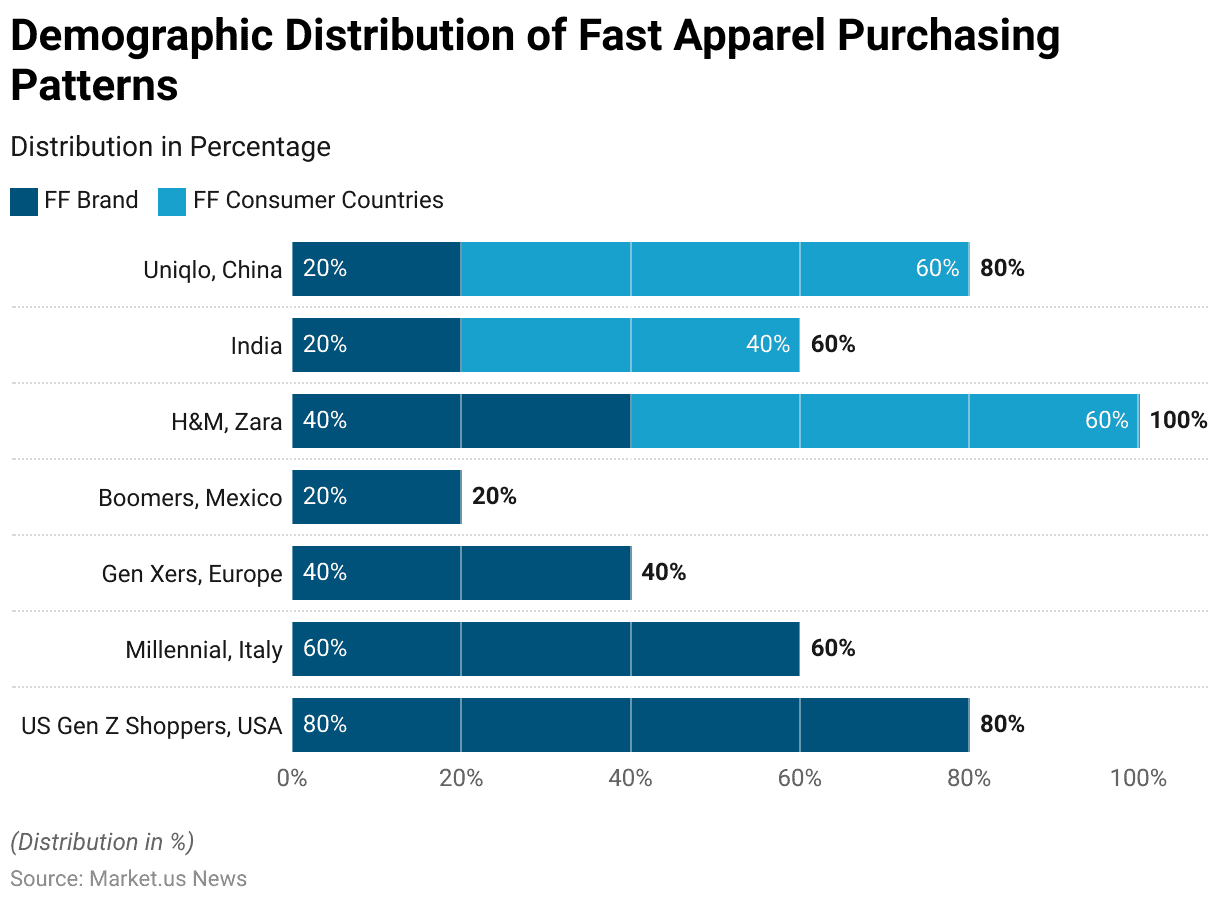
Demographic Distribution of Fast Apparel Purchasing Patterns
- U.S. Gen Z shoppers lead the affinity for fast fashion brands, with a significant 80% preference, yet show no corresponding interest in countries typically associated with fast fashion consumption.
- Italian Millennials also demonstrate a notable preference for fast fashion brands at 60%, aligning with the trend seen in younger demographics.
- Generation Xers in Europe exhibit a 40% preference for fast fashion brands, suggesting a moderate level of engagement with fast fashion.
- Mexican Boomers show the least preference for fast fashion brands among the demographics listed, with only a 20% inclination toward these brands.
- Notably, the preference for fast fashion brands like H&M and Zara matches a 60% consumer base in their associated countries, indicating a balanced brand and country association.
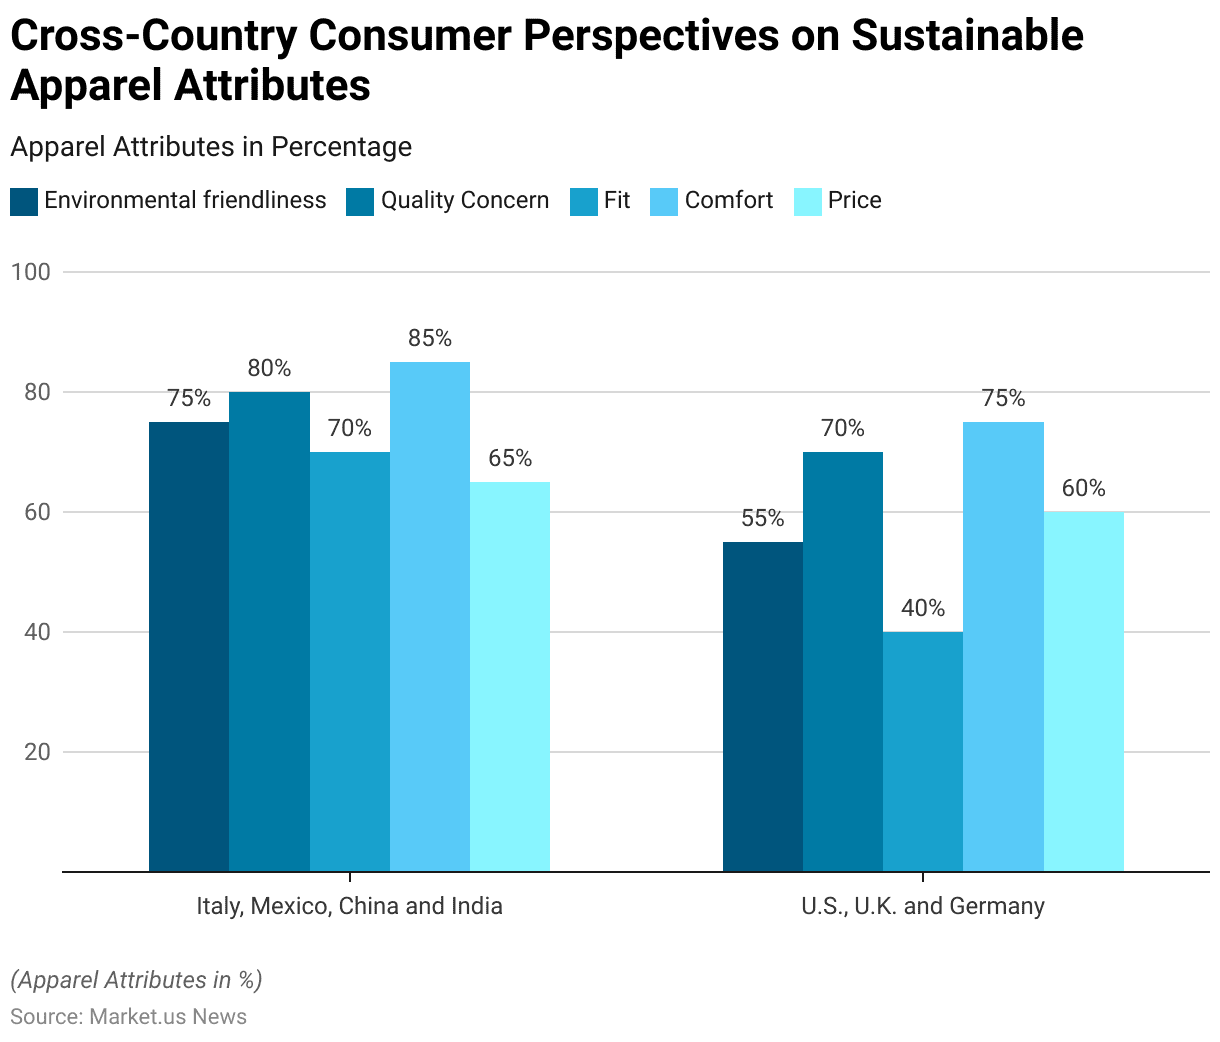
Concerns about sustainable apparel buying
- In Italy, consumer concerns for sustainable clothing are high, with environmental friendliness and comfort being the primary considerations at 75% and 85%, respectively. Quality concerns follow closely at 80%, while fit and price hold 70% and 65% concern levels.
- Mexican consumers mirror the Italian concerns for sustainable clothing, placing a significant emphasis on environmental friendliness and comfort, both at 75% and 85%. Quality concerns stand at 80%, with fit and price at 70% and 65%.
- The Chinese market also shows similar priorities in sustainable apparel, valuing environmental friendliness and comfort (75% and 85%). Quality is a close second at 80%, with fit and price concerns at 70% and 65%.
- India’s statistics align with the other three countries mentioned above, with high importance placed on environmental friendliness (75%) and comfort (85%). Quality concerns are reported at 80%, and fit and price at 70% and 65%.
- In contrast, the U.S. displays a lower emphasis on environmental friendliness at 55%, although comfort remains a significant factor at 75%. Quality concerns and price are at 70% and 60%, respectively, with fit being the least concern at 40%.
Discuss your needs with our analyst
Please share your requirements with more details so our analyst can check if they can solve your problem(s)